Get SLA Time Metrics
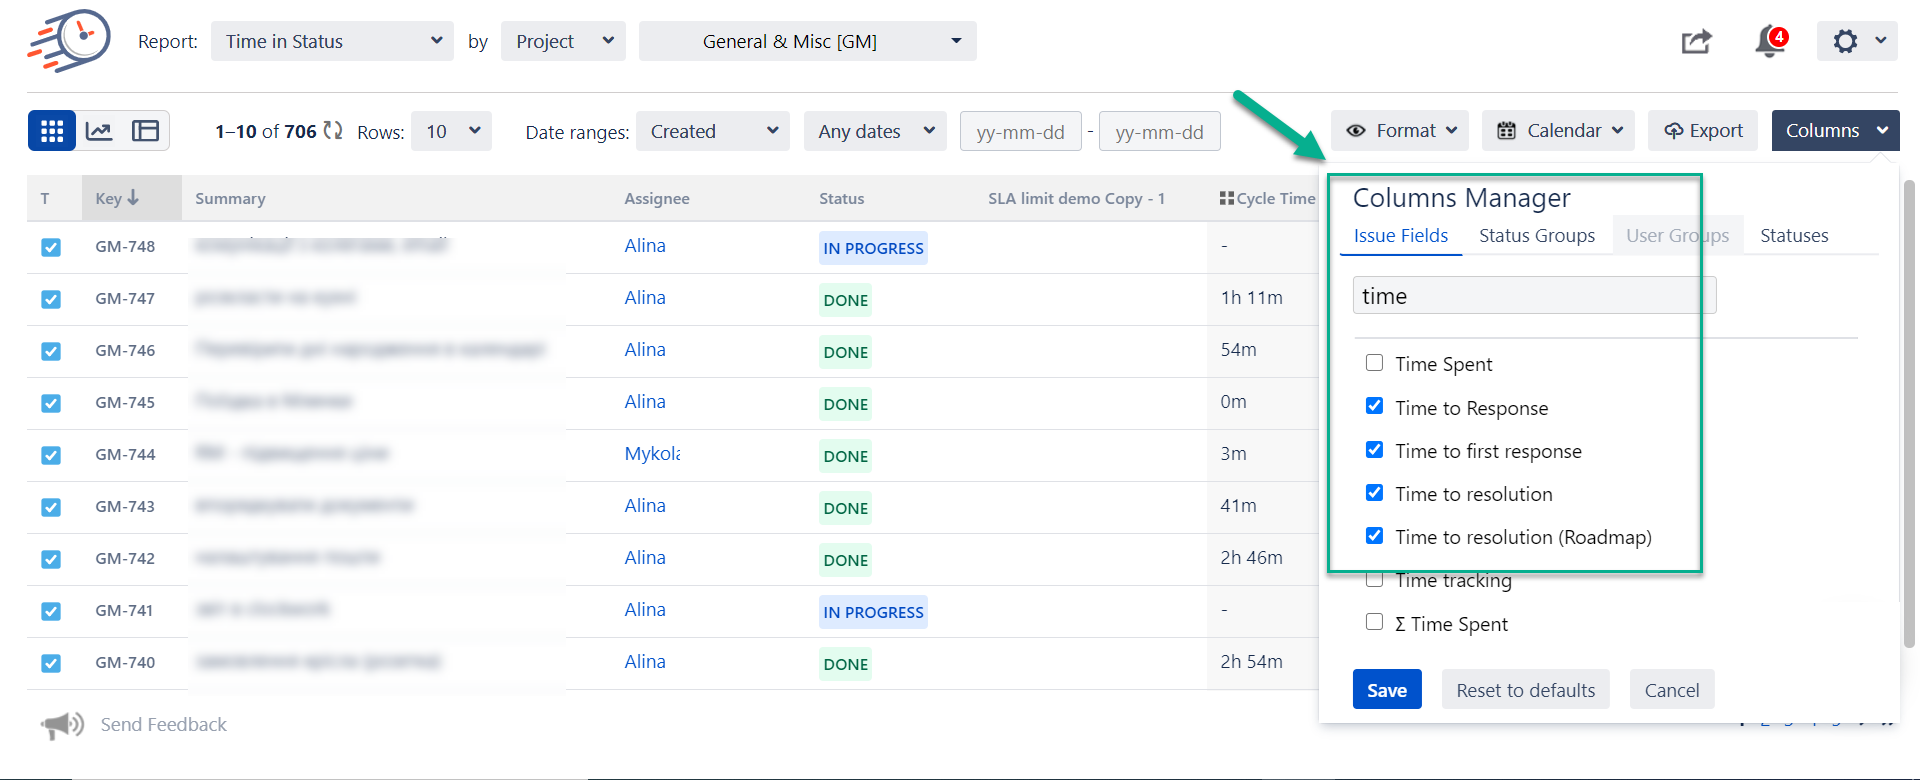
📝 Context: The system has been enhanced to display Service Level Agreement (SLA) data from the service desk. Users can now select specific SLA metrics from a drop-down list in the Column Manager, such as time to first response, time to resolution, or time to response. |
|---|
🤔 User Problem: Users need to access and view specific SLA metrics to monitor performance, ensure compliance with service agreements, and identify areas for improvement. However, they lack an intuitive way to select and display these metrics within the current interface. |
|---|
Just choose a particular SLA and add a column.

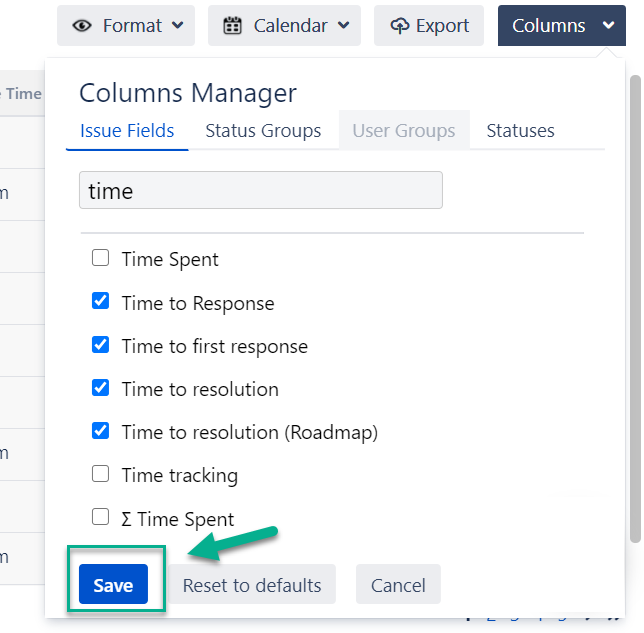
Then click a “Save” button.

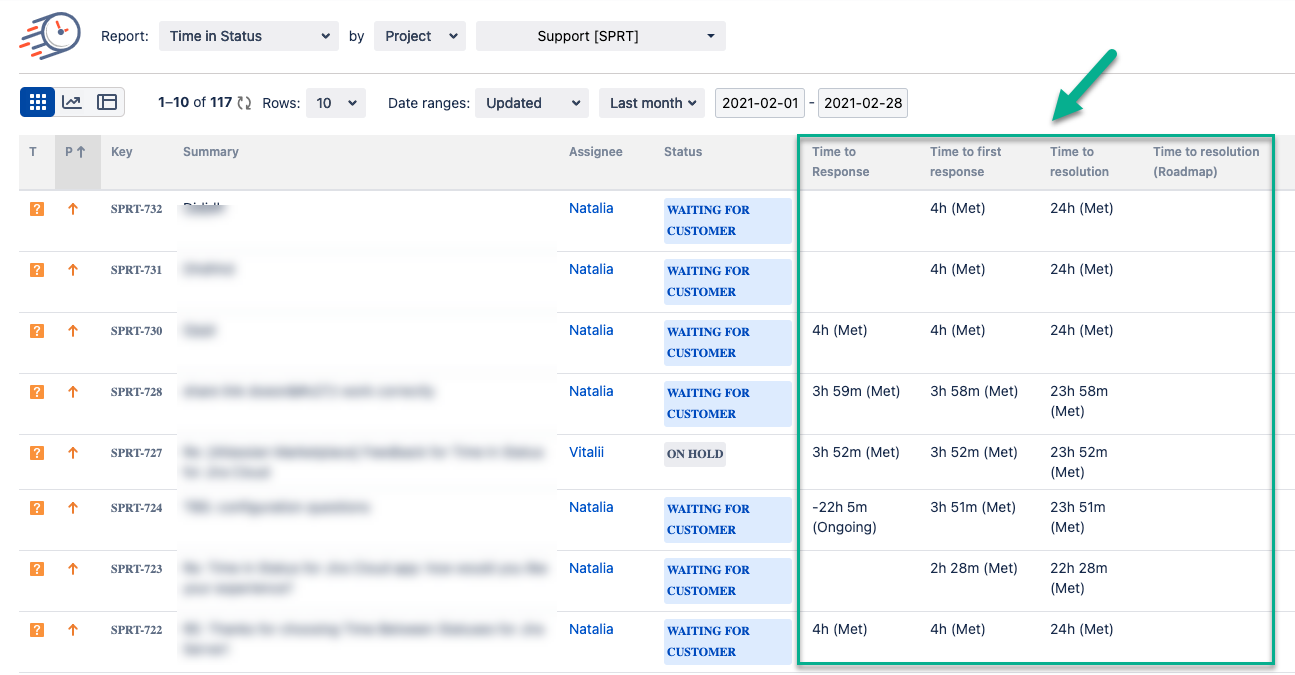
That’s all! Get already generated data based on the chosen SLAs.

📈 Outcomes:
|
|---|
If you need help or want to ask questions, please contact SaaSJet Support or email us at support@saasjet.atlassian.net
Haven't used this add-on yet? Try it now!