Average Time in Status Reports: A Tool for Improved Productivity
📝 Context: The Average Time in Status report in Jira is a powerful tool for project managers, software developers, and customer service teams. It provides valuable insights into the workflow, helping to identify bottlenecks, set realistic deadlines, optimize resource allocation, streamline processes, and detect training needs. This guide explains how to use this report to boost productivity and improve project management. |
|---|
🤔 User Problem: Teams and project managers need a way to analyze workflow efficiency, identify bottlenecks, set realistic deadlines, optimize resource allocation, streamline processes, and detect training needs. The Average Time in Status report can help address these needs. |
|---|
Improving Software Development Cycle Time
🎯 Challenge: The company wanted to reduce its software development Cycle time to deliver features faster.
🔍 Solution: They used the Average Time in Status report to understand how long issues stayed in each status on average.

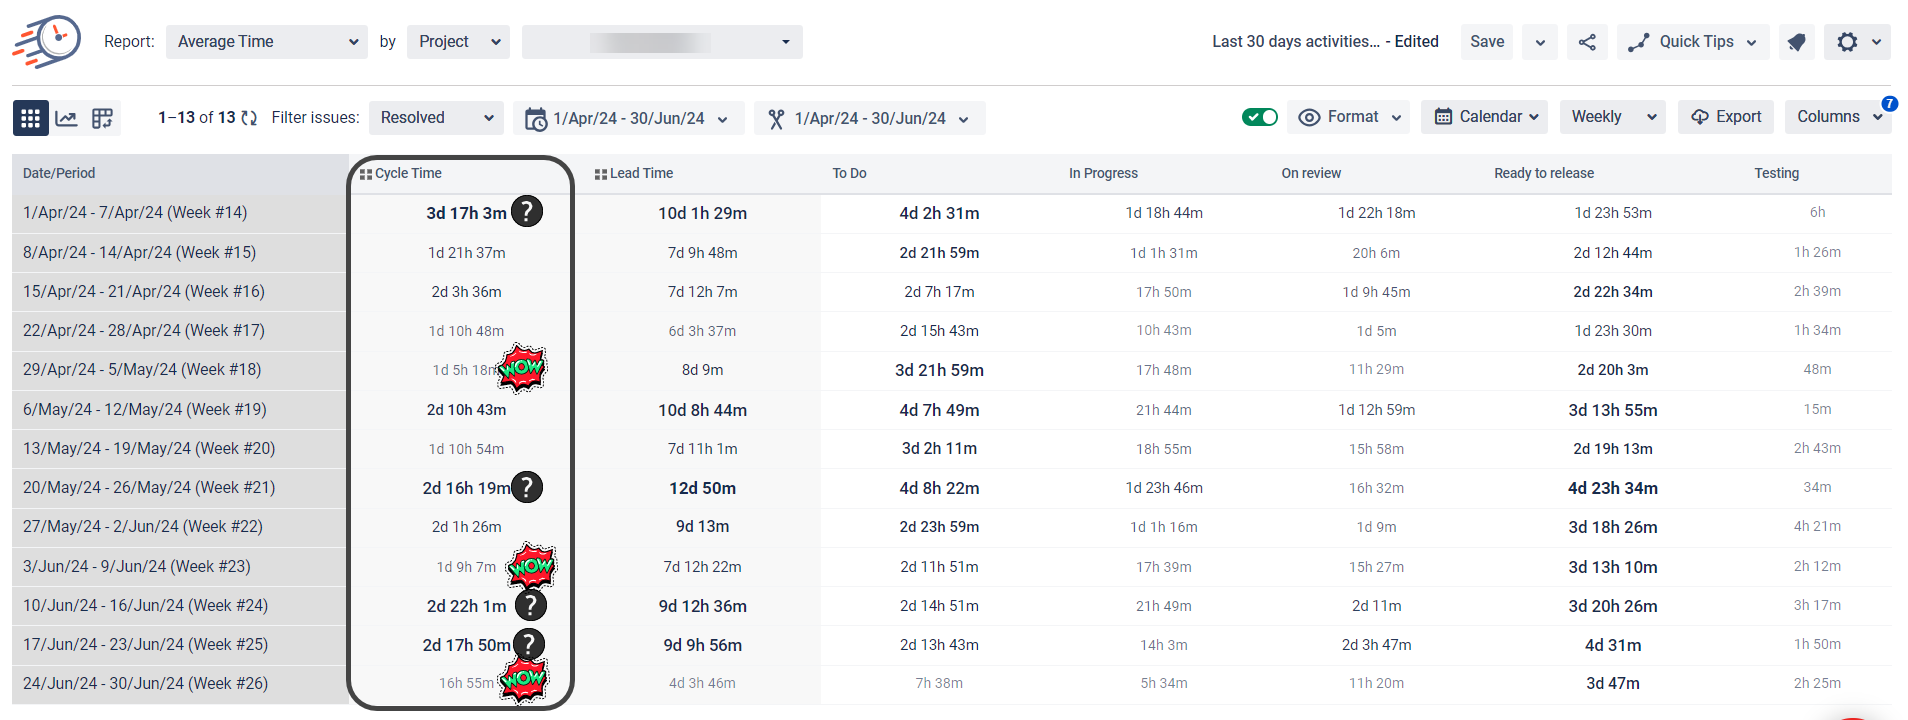
For example, the report shows that Cycle time is not uniform and that a certain trend is not repeated. This does not mean that one indicator is bad or good. Looking only at the time calculation, we can't know what task scopes were included, how complex they are, which team members worked on them, etc.
If the numbers are too high, and vice versa, if they are shockingly low, visually evaluate them yourself. Then, go back to the regular Time in Status report and see in more detail what your team was working on and what led to certain Cycle Time indicators.
Predicting Future Workload and Resource Allocation
🎯 Challenge: The company struggled to predict its future workload and allocate resources effectively and accurately.
🔍 Solution: They used the Average Time report to analyze the average time in status spent on different types of issues or tasks. This data was then used to predict how long future tasks would take and allocate resources accordingly.
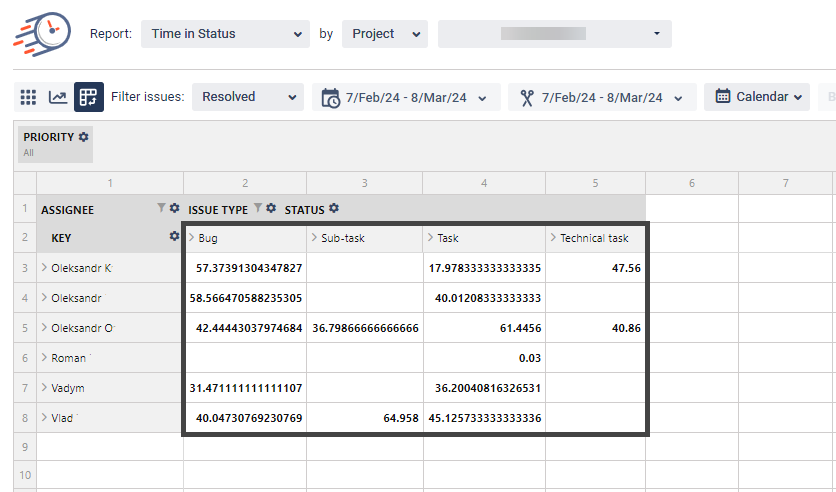
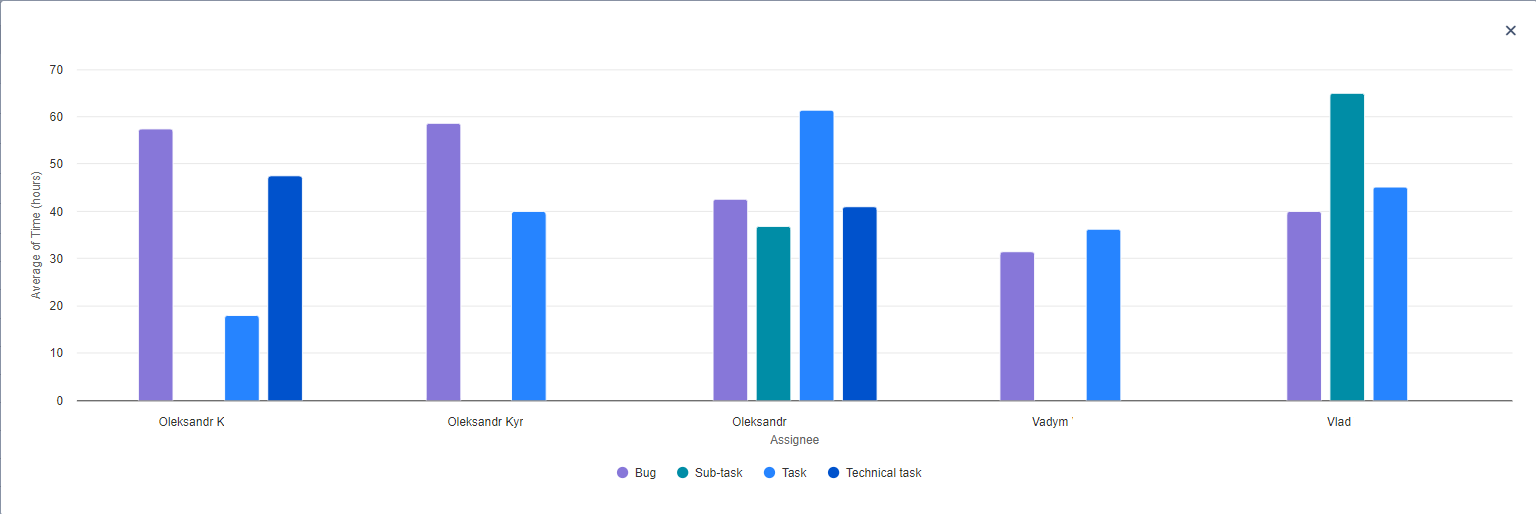
By generating a report using pivots, you get a report showing how much time each Assignee spends on average on a particular issue. This way, you'll understand where each team member has potential time losses and can consider this when planning task scoping for the next period.


Individual Performance Review and Training Needs Identification
🎯 Challenge: The team leader noticed significant variations in the average time spent in status by different assignees during a project, indicating potential performance issues and skill gaps.
🔍 Solution: The team leader decided to utilize the Average Time in Status Report per Assignee to identify performance discrepancies and potential training needs. By analyzing the report, they could pinpoint which assignees were taking longer than expected in certain statuses and which tasks were consistently taking longer to complete.
An example of a generated report for a single Assignee for the last six months. We used a monthly data breakdown. Thus, we can analyze how the average time in each status changed over time.

📈 Outcomes:
|
|---|
If you need help or want to ask questions, please contact SaaSJet Support or email us at support@saasjet.atlassian.net
Haven't used this add-on yet? Try it now!