
Time in Status turns your Jira data into actionable time-based and flow metrics so you can improve delivery, support, and planning.
This page shows:
-
What problems Time in Status help you solve
-
How to generate your first reports
-
How to use Sprint Report for deeper agile insights
-
A 2-week implementation plan with success metrics
1. What you can achieve with Time in Status
Use Time in Status as a toolkit for different teams:
|
Team / Function |
Typical goals with Time in Status |
|---|---|
|
HR & People Ops |
Task time monitoring, assignee time tracking, productivity, and workload insights. |
|
Support & ITSM |
Time metrics for SLAs, support effort analysis, incident triage, and ticket lifecycle tracking. |
|
PMO & Product |
Cycle time analysis, blocker detection, idea-to-release tracking, and sprint performance monitoring. |
|
Engineering |
Workflow bottleneck detection, lead time reduction, scope change control, and team efficiency. |
|
Business Ops & Data |
Time metrics in Power BI / Qlik, funnel visualization, and KPI forecasting. |
|
Strategy & OKRs |
OKR alignment using time data, story point estimation, year-end reporting, and sprint analytics. |
Use this matrix to decide which reports to set up first for your team.
2. Open Time in Status in Jira
-
In Jira, go to the Apps section on the left sidebar.
-
Select Time in Status from the list of installed apps.
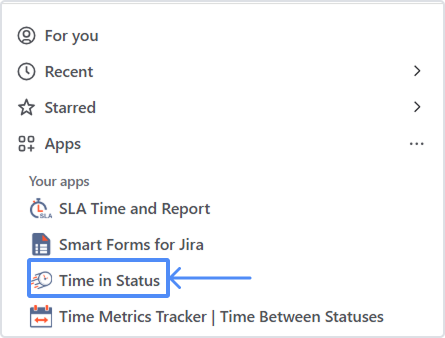
You’ll land on the main reporting screen.
3. Create your first report
3.1 Choose what you want to analyze
-
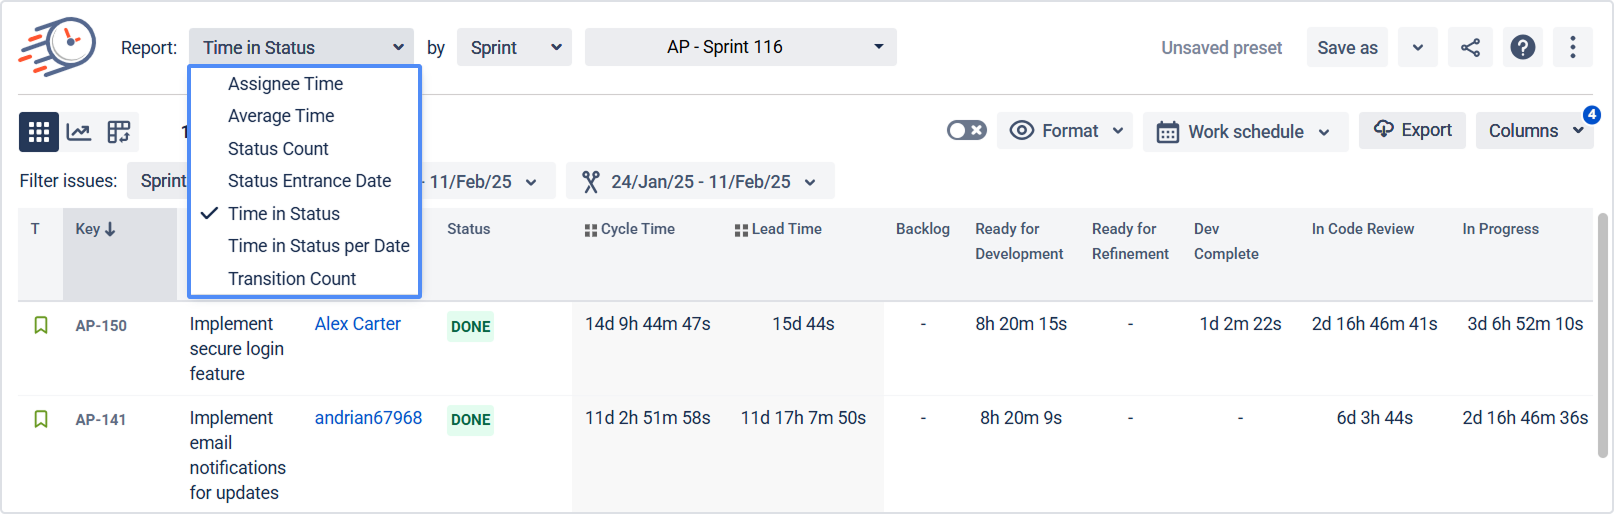
Click Report type and choose the report you want to generate
(e.g., time in status, assignee time, average time, etc.).
Tip: Make sure work items have correct resolution set so resolved issues appear in reports correctly.
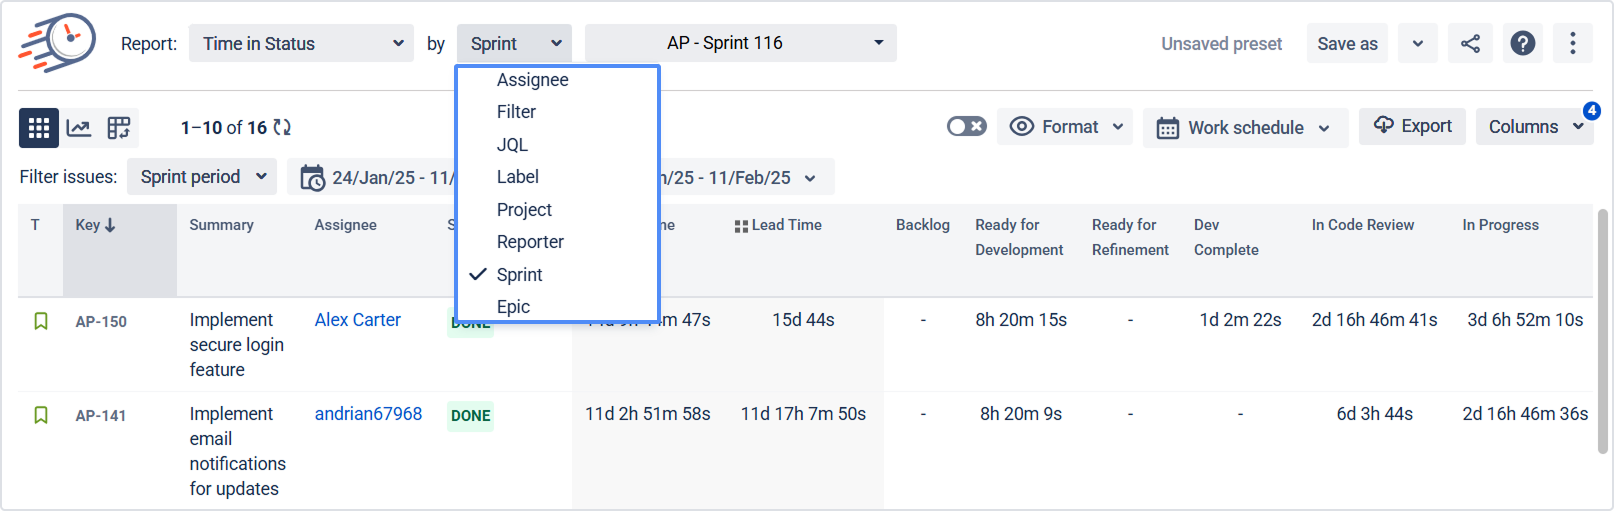
3.2 Filter the work items
Use filters at the top of the report to narrow down the data set. You can filter by:
-
Assignee
-
Filter (saved Jira filter)
-
Label
-
Project
-
Reporter
-
Sprint
-
JQL
-
Epic
This defines which issues will be used in your report.
3.3 Set the date ranges
Use Date ranges to control when work is selected and for which period time is calculated.
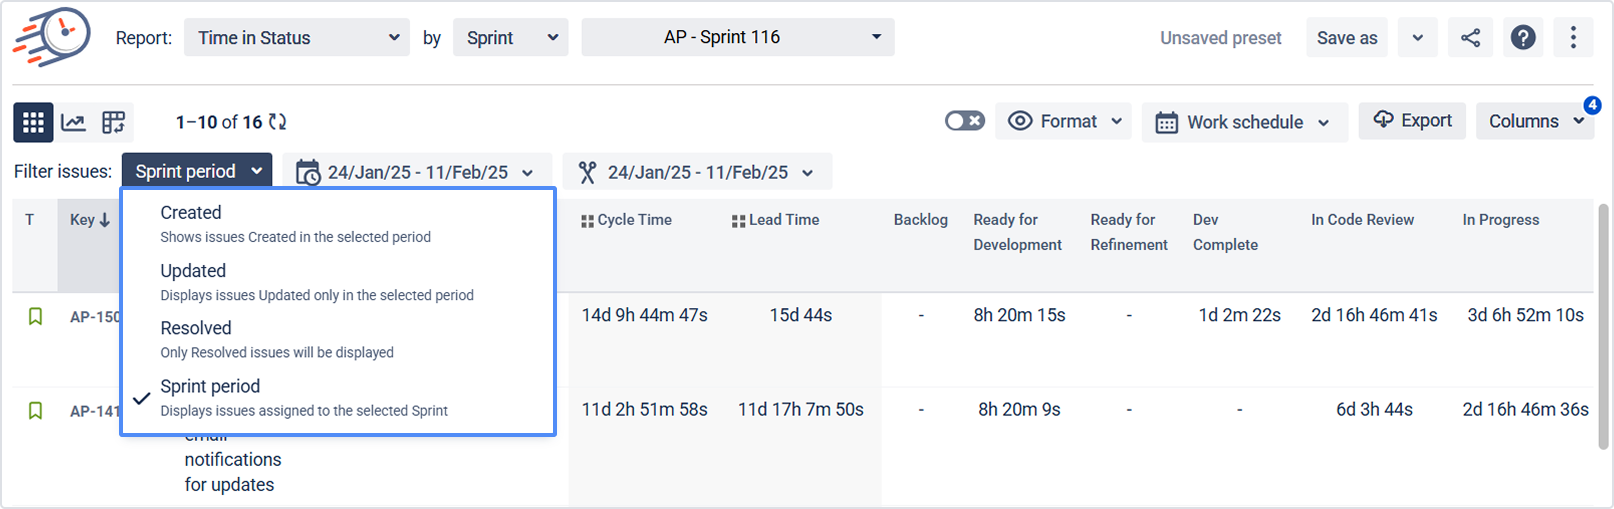
You can configure two types of dates:
-
Work items period – selects the list of issues.
-
Example: “Tasks resolved last week.”
-
-
Report period – defines the time window for calculations.
-
Example: “Calculate time spent only during last week for those tasks.”
-
If you don’t limit the report period, Time in Status will calculate time for the whole history (Any date – default).
Learn more: Work Items and Report Periods
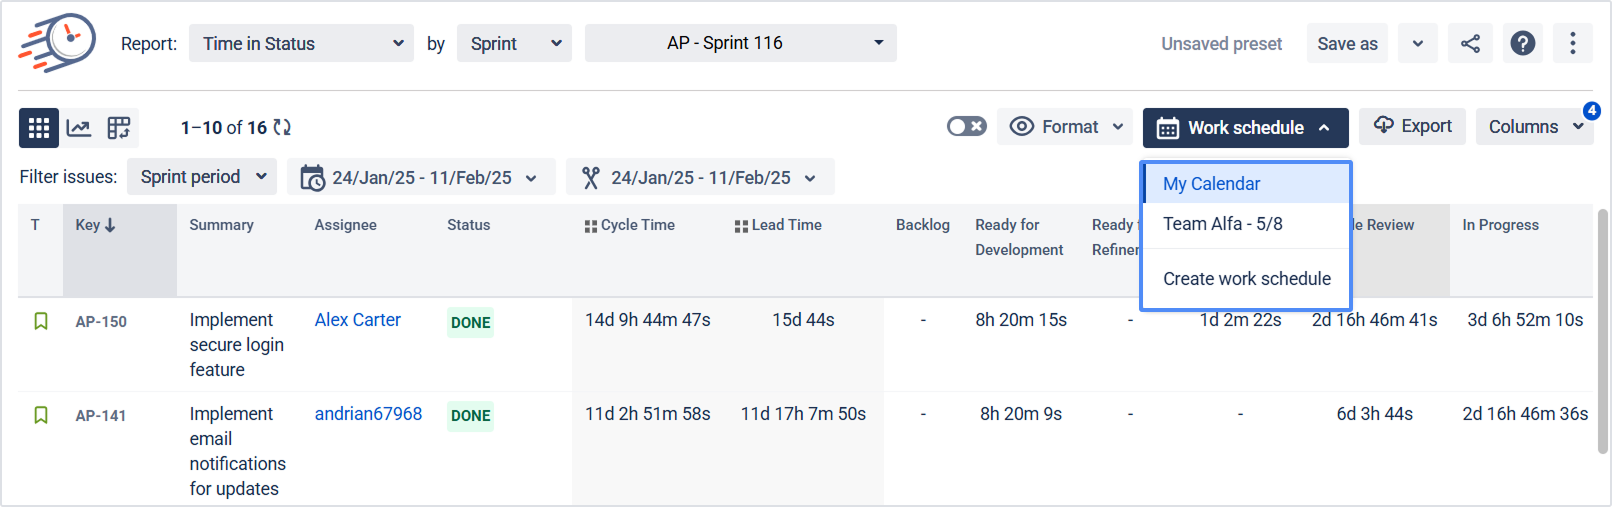
3.4 Choose Work Schedule
Select which calendar to use when calculating time:
-
Custom work schedules you have configured earlier
-
24/7 calendar (default)
This helps distinguish business hours from nights/weekends where relevant.
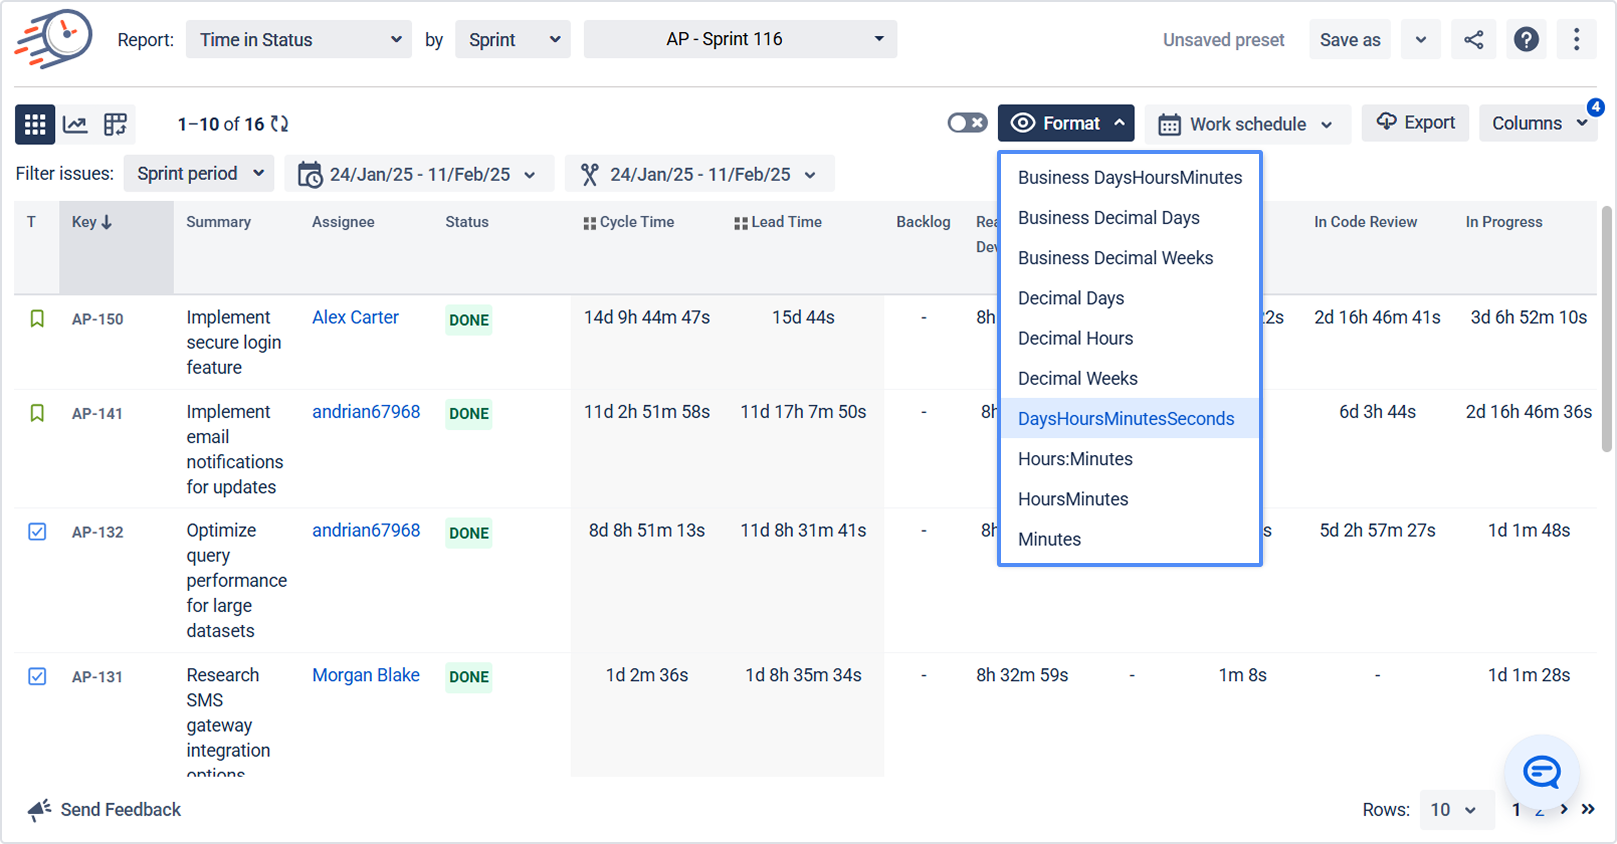
3.5 Set Time Format
Use the Format option to choose how durations are displayed, for example:
-
Minutes
-
HoursMinutes
-
Hours:Minutes
-
DaysHoursMinutes
-
Decimal Weeks / Hours / Days
-
Business Days / Business Decimal Days, etc.
Learn more: Time format
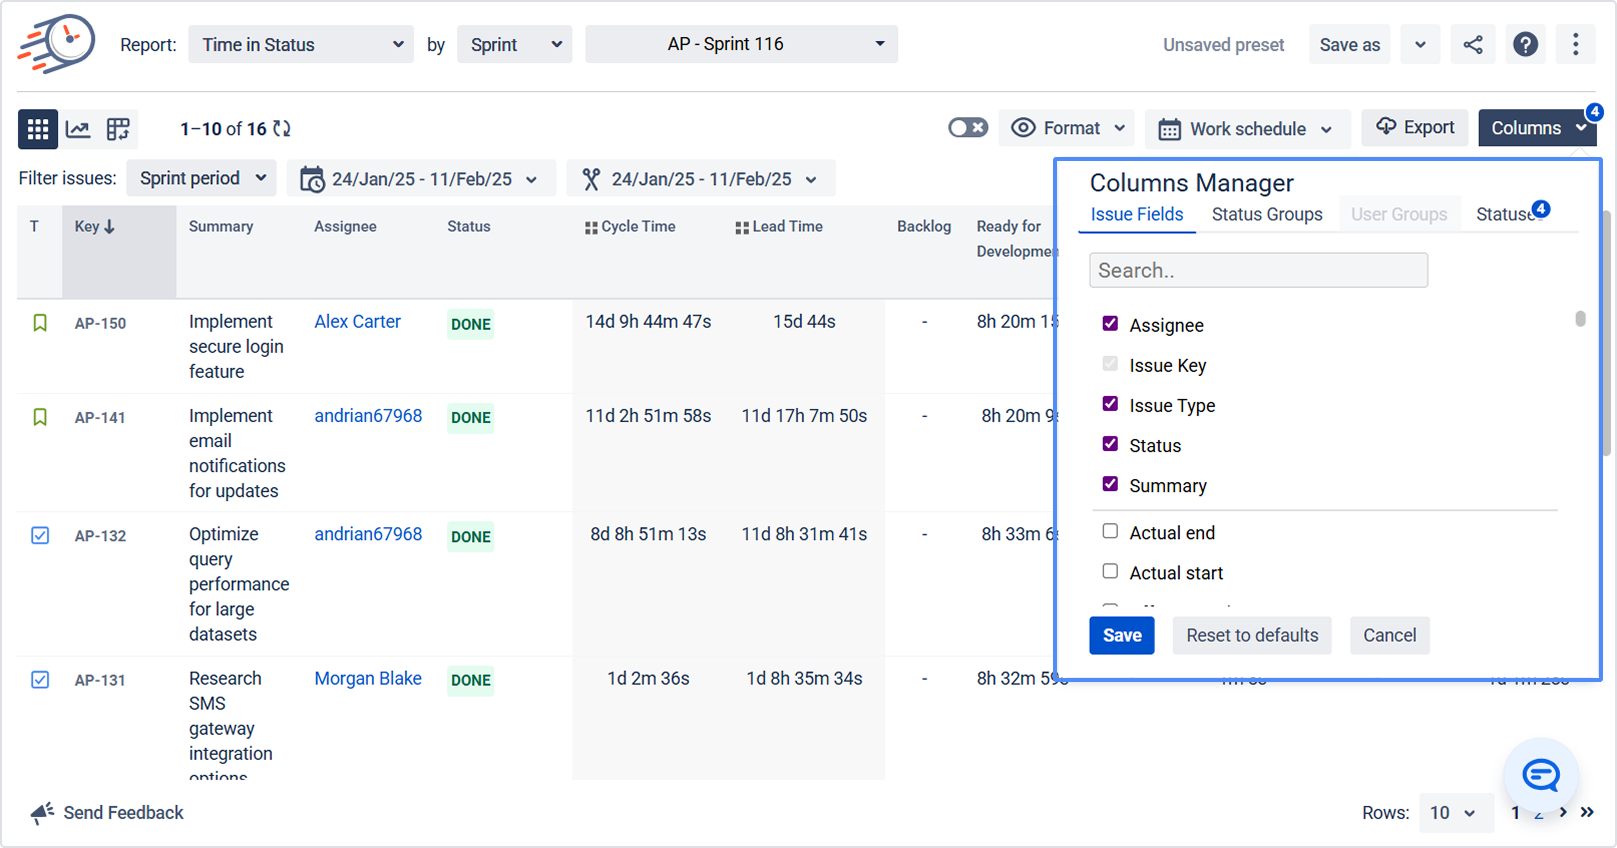
3.6 Configure columns & groupings (Columns Manager)
Open Columns Manager to define how data appears on the grid:
-
Work Item Fields – choose issue fields to display.
-
Status Groups – group multiple Jira statuses into one logical group (e.g., In Progress, Waiting for Customer).
-
User Groups – group users (e.g., by team or location).
-
Statuses – control which statuses appear in the grid.
This is your main tool for tailoring reports to your process.
3.7 Choose how to present the data
Each report can be viewed in several ways:
-
Table view – detailed grid with issues and metrics.
-
Chart view – visual trends and comparisons.
-
Pivot table view – slice-and-dice by assignee, status, project, etc.
4. Analyze sprints with Sprint Report
The Sprint Report page offers a visual breakdown of key sprint metrics in easy-to-read charts. It helps you understand:
-
How much work was completed
-
Team velocity and workload
-
Scope changes during the sprint
-
Overall sprint performance
Data can be measured in Story Points, Original Time Estimate, or issue Count, depending on the board’s estimation method.
.png?cb=4fafd3d12612051f2c11e9712e18771c)
5. Advanced configuration
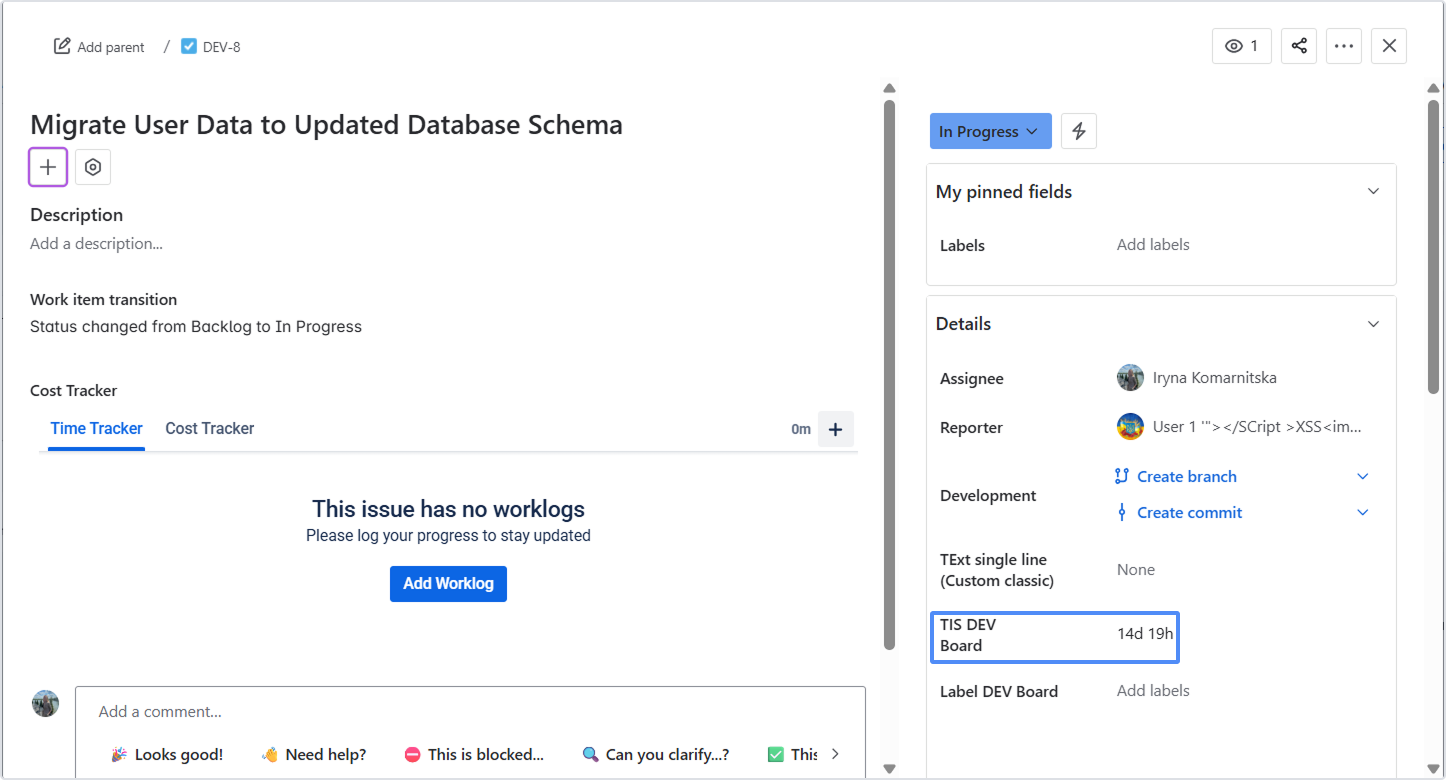
5.1 Custom Fields – Time in Status on the board
Create Time in Status custom fields to see how long an issue has been in the current status directly on Jira boards and in issue view.
Learn more: Custom Fields
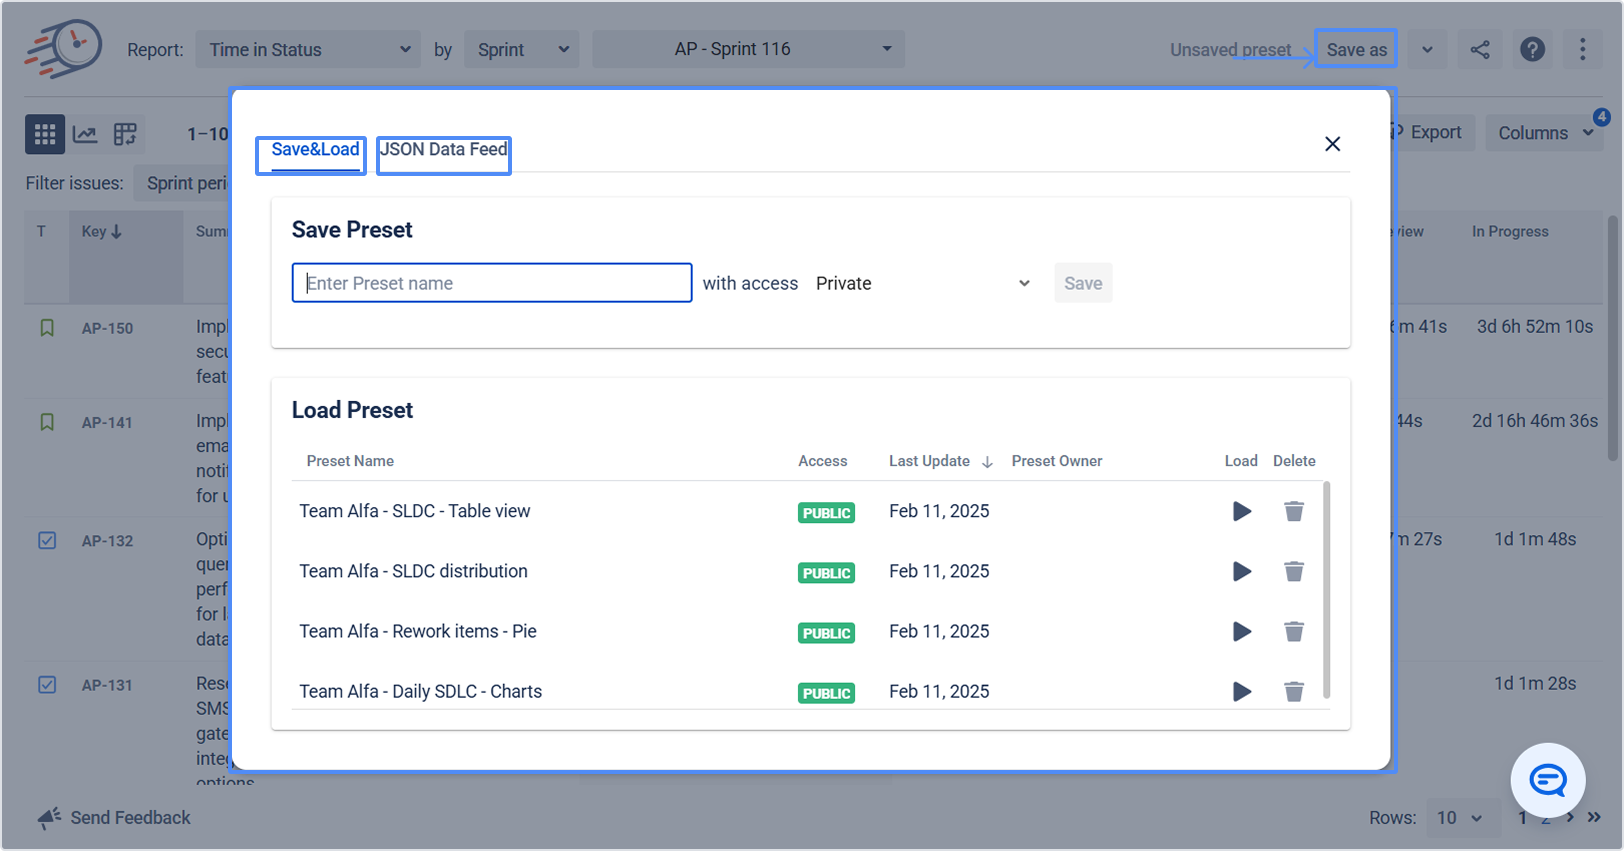
5.2 Save & Load presets and JSON data feed
To reuse configurations and connect to other systems:
-
Save & Load – save frequently used report settings for different teams (Support, Development, etc.).
-
JSON Data Feed link – generate a link to share report data with third-party tools.
Learn more: Save & Load Presets of Frequently Used Reports
Learn more: JSON Data Feed link
5.3 Export & BI integrations
You can export Time in Status data to:
-
(Time in Status macros)
-
, Qlik, via documented integrations
This allows you to combine Jira metrics with other business data.
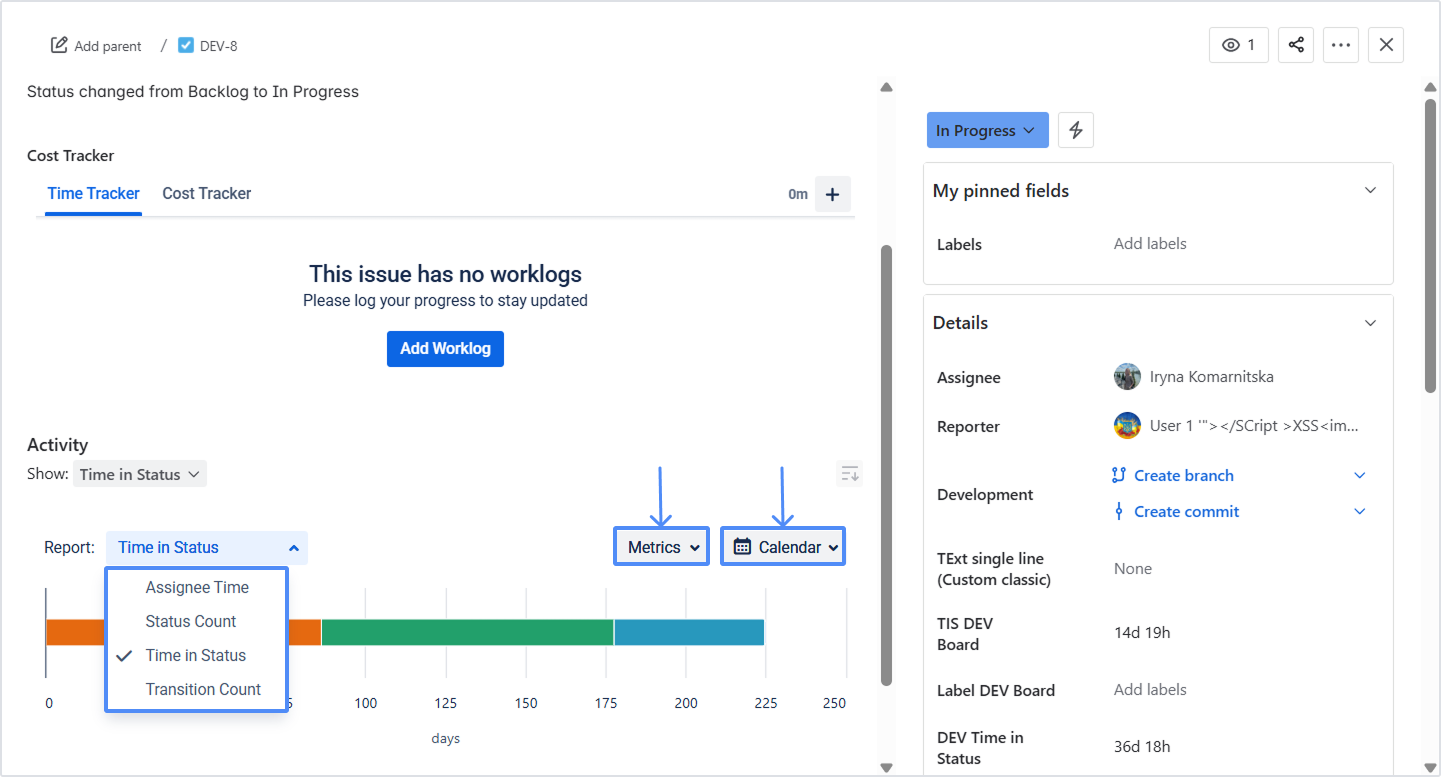
5.4 Work Item Activity tab
Inside a single issue view, open Activity → Time in Status to see:
-
Graphical and numerical data for that issue
-
Different report types
-
Metrics and Calendar options
Perfect for deep-diving into specific tickets.
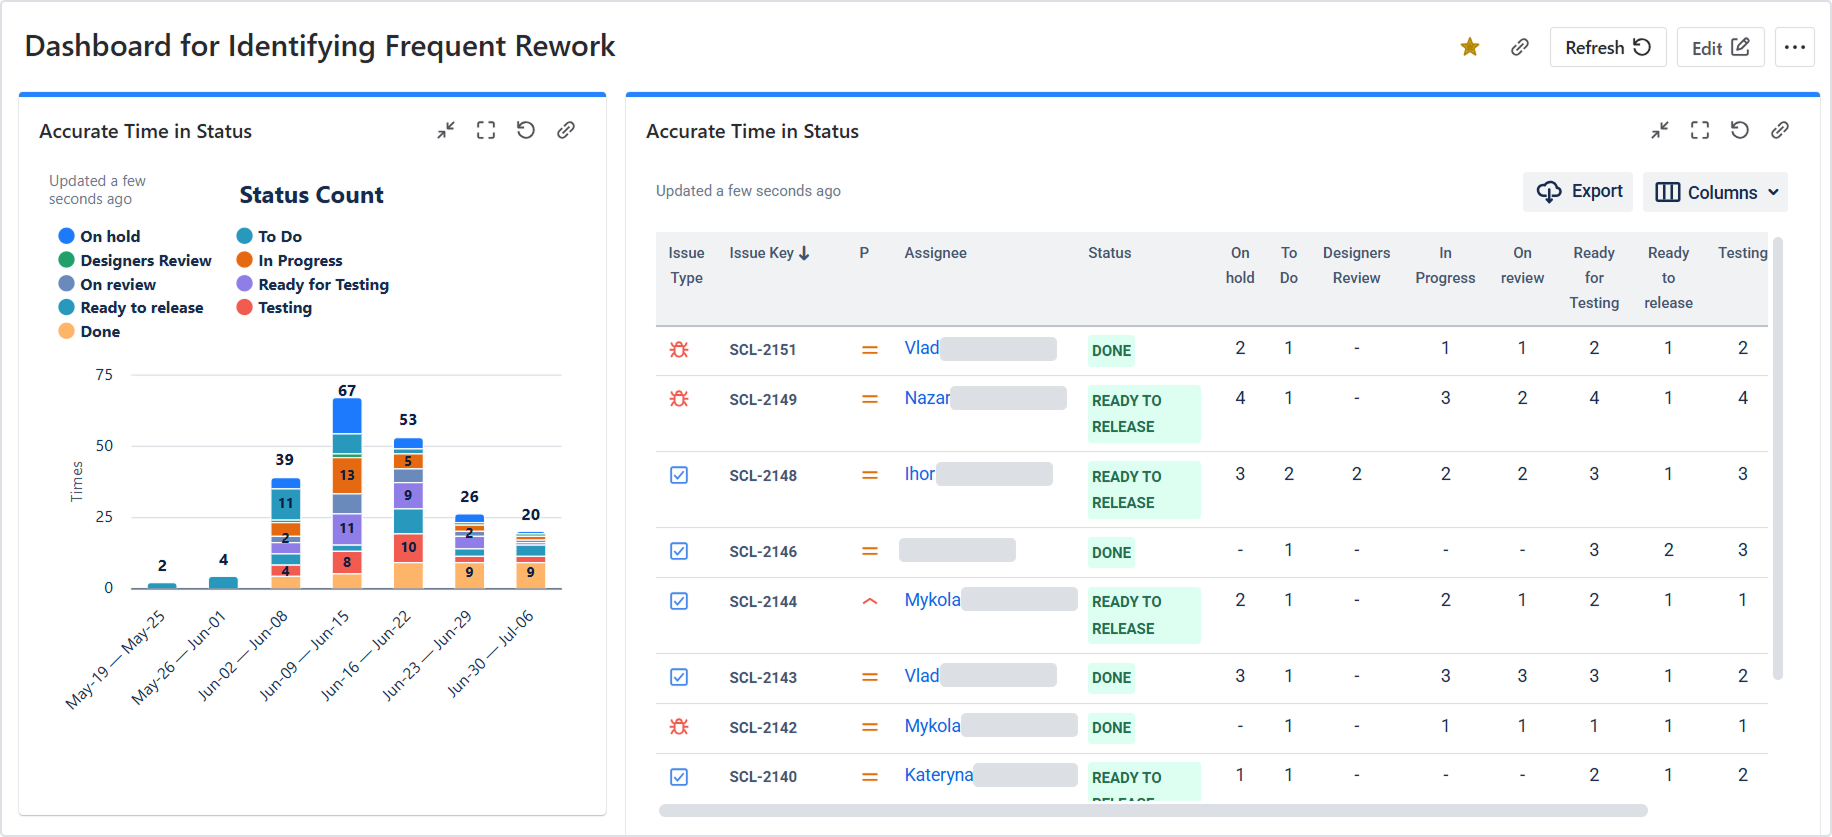
5.5 Dashboard gadget
Add the Time in Status dashboard gadget to Jira dashboards to monitor:
-
Any of the app’s reports
-
Data in Work Item List or Chart View
Use gadgets to share key metrics with stakeholders.
6. 2-week implementation playbook
Use this plan to go from installation to a working, data-driven process in two sprints.
Week 1 – Set up and establish a baseline
-
Strengthen data quality
Ensure Jira workflows match reality (clear entry/exit criteria, no “catch-all” statuses) and fields are used consistently. -
Set calendars and estimation method
Configure working calendars and time zones. Confirm each board’s estimation method (Story Points / Time / Count). -
Define status groups for key metrics
Create status groups for Lead time, Cycle time, Time to Resolution, etc. -
Set up custom fields
Configure custom fields to track time in the current status (especially for Kanban boards). -
Configure and save presets
Create presets for frequently used reports (Support, Development, HR, etc.). -
Create dashboards
Add Time in Status gadgets and key reports to dashboards for ongoing monitoring. -
Visualize trends and capture insights
Run baseline reports, plot trends, and note observations, decisions, and hypotheses in a shared space (with owners and due dates). -
Use Sprint Report to capture baseline sprint metrics
Record committed vs. completed work, scope changes, and velocity for the latest sprint.
Week 2 – Experiment, iterate, and standardize
-
Run a data-informed retrospective
Use recorded metrics (Time in Status, cycle time, throughput, WIP) with a simple format like Start/Stop/Continue or What? / So What? / Now What?. -
Implement targeted process experiments
Choose 1–2 high-leverage changes (e.g., limit WIP, tighten review SLAs).-
Define SMART success criteria (e.g., “Reduce average ‘In Review’ time by 15% next sprint”).
-
Assign a directly responsible individual (DRI).
-
Update working agreements / Definition of Done.
-
-
Re-measure after one iteration
After the next sprint, compare the same metrics before vs. after. Use Sprint Report + Time in Status reports to separate signal from noise and discuss qualitative feedback. -
Standardize or pivot
If the changes improved outcomes and team experience, standardize them (document process, update workflows).
If not, refine the hypothesis and plan the next experiment.
7. Success metrics: how to know Time in Status is working
Track improvements over the first 1–2 sprints:
-
Cycle time down by 10–25% within 1–2 sprints.
-
Waiting time % down (higher share of active work) across value streams.
-
Reopen loops decrease after fixing criteria/process gaps.
-
SLA breaches decrease; calendars adopted by global teams.
-
Forecast accuracy up; carryover between sprints down.
Use these as north-star metrics for your rollout.
For more details about canceling and uninstalling an app, please visit the App Subscriptions: Cancellation, Uninstalls, Refund & Renewal FAQ page.
If you need any help or have questions, please contact us via SaaSJet Support or email support@saasjet.atlassian.net
Haven’t worked with the add-on yet? Give it a try