Visualizing the Workflow Funnel: Why Busy Teams Can Be Unproductive
📝 Context: The paradox of a busy but unproductive team is a common problem in project management. Despite being constantly busy, the team doesn't seem to be making much progress toward its goals. This can frustrate team members and project managers and significantly impact project success. This article examines how visualizing the workflow funnel with the Time in Status app can help identify and solve this problem. |
|---|
🤔 User Problem: Teams and project managers struggle to understand why their team is busy but not productive. They need a way to visualize and analyze the workflow to identify bottlenecks, monitor individual performance, and optimize resource allocation. |
|---|
Identifying Time-Consuming Tasks
If you find that the team is spending a lot of time on tasks that are not directly contributing to project goals, it could be a sign that they are busy but not productive. By identifying these time-consuming tasks, you can take steps to streamline your workflow and improve team productivity.

Monitoring Individual Performance
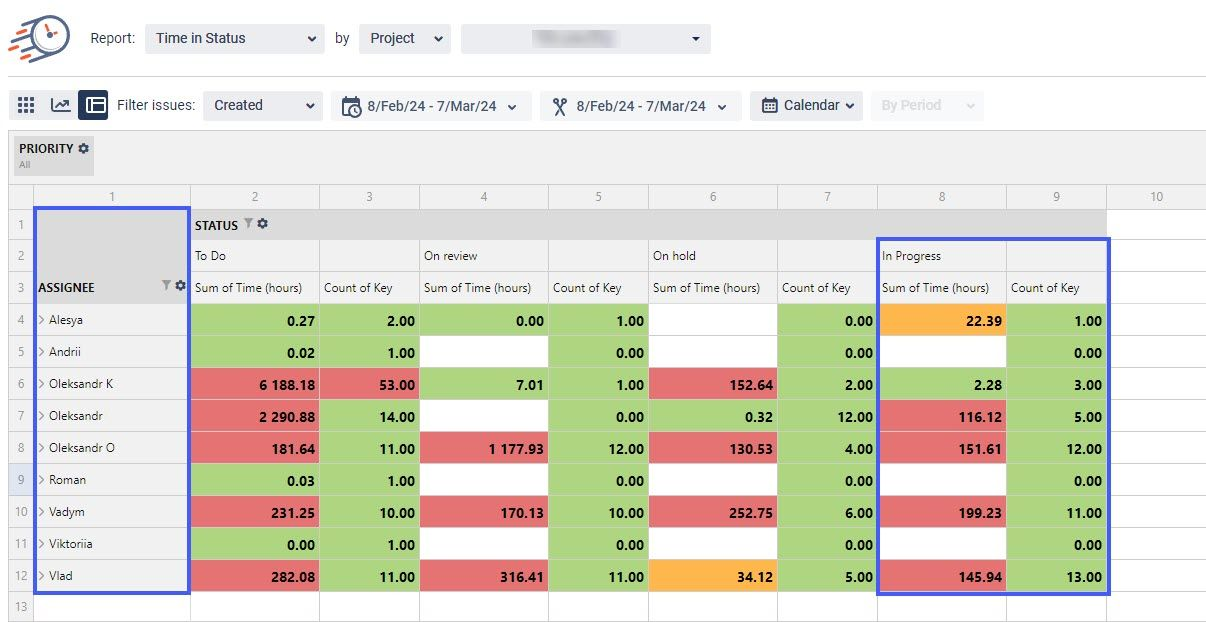
Using the Pivot table view, you can generate a report for each Assignee with the sum of hours in status and the number of tasks for a certain period of time (you can add other calculations - average, median, etc.). It allows you to monitor the performance of individual team members. If some team members are spending a lot of time on tasks but not making much progress, this suggests they are struggling with their workload or need additional support. By monitoring individual performance, you can identify areas where team members may require additional training or support.

Analyzing Workflow Efficiency
The Average Time report provides insights into the average duration spent in different statuses. It calculates the average time spent in each status category, allowing users to identify patterns, bottlenecks, or areas for improvement in their workflow.

Tracking Progress Over Time
The Status Entrance Date report shows when a Jira issue changed its status. The report will give you insight and illustrate the lifecycle of an individual issue. This information can help track your work's progress and identify any delays or bottlenecks in your workflow. You'll be able to see when the issue moved through different stages and understand whether the team is working dynamically and smoothly. Completing one task determines when the next task will go live or the project will be released. Therefore, having insights not only into Time in Status calculation is beneficial. It is also essential to understand the dates when the statuses change and to model the funnel workflow for yourself on a smaller time scale, for example, every week.

The Time in Status per Date report shows you the amount of time spent in different statuses over a certain period (daily, weekly, quarterly, etc.). You can assess how time spent in different statuses changes by performing a comparative analysis for several periods. If you see significant differences, you can analyze the scope of tasks for such an abnormal period and get insights into the correctness of resource allocation, whether the task estimate was correct, etc.

📈 Outcomes:
|
|---|
If you need help or want to ask questions, please contact SaaSJet Support or email us at support@saasjet.atlassian.net
Haven't used this add-on yet? Try it now!