
Work Schedules and Time Formats
Setting up work schedules allows you to choose the length of the working day that you need. The values on the report will be calculated according to them.
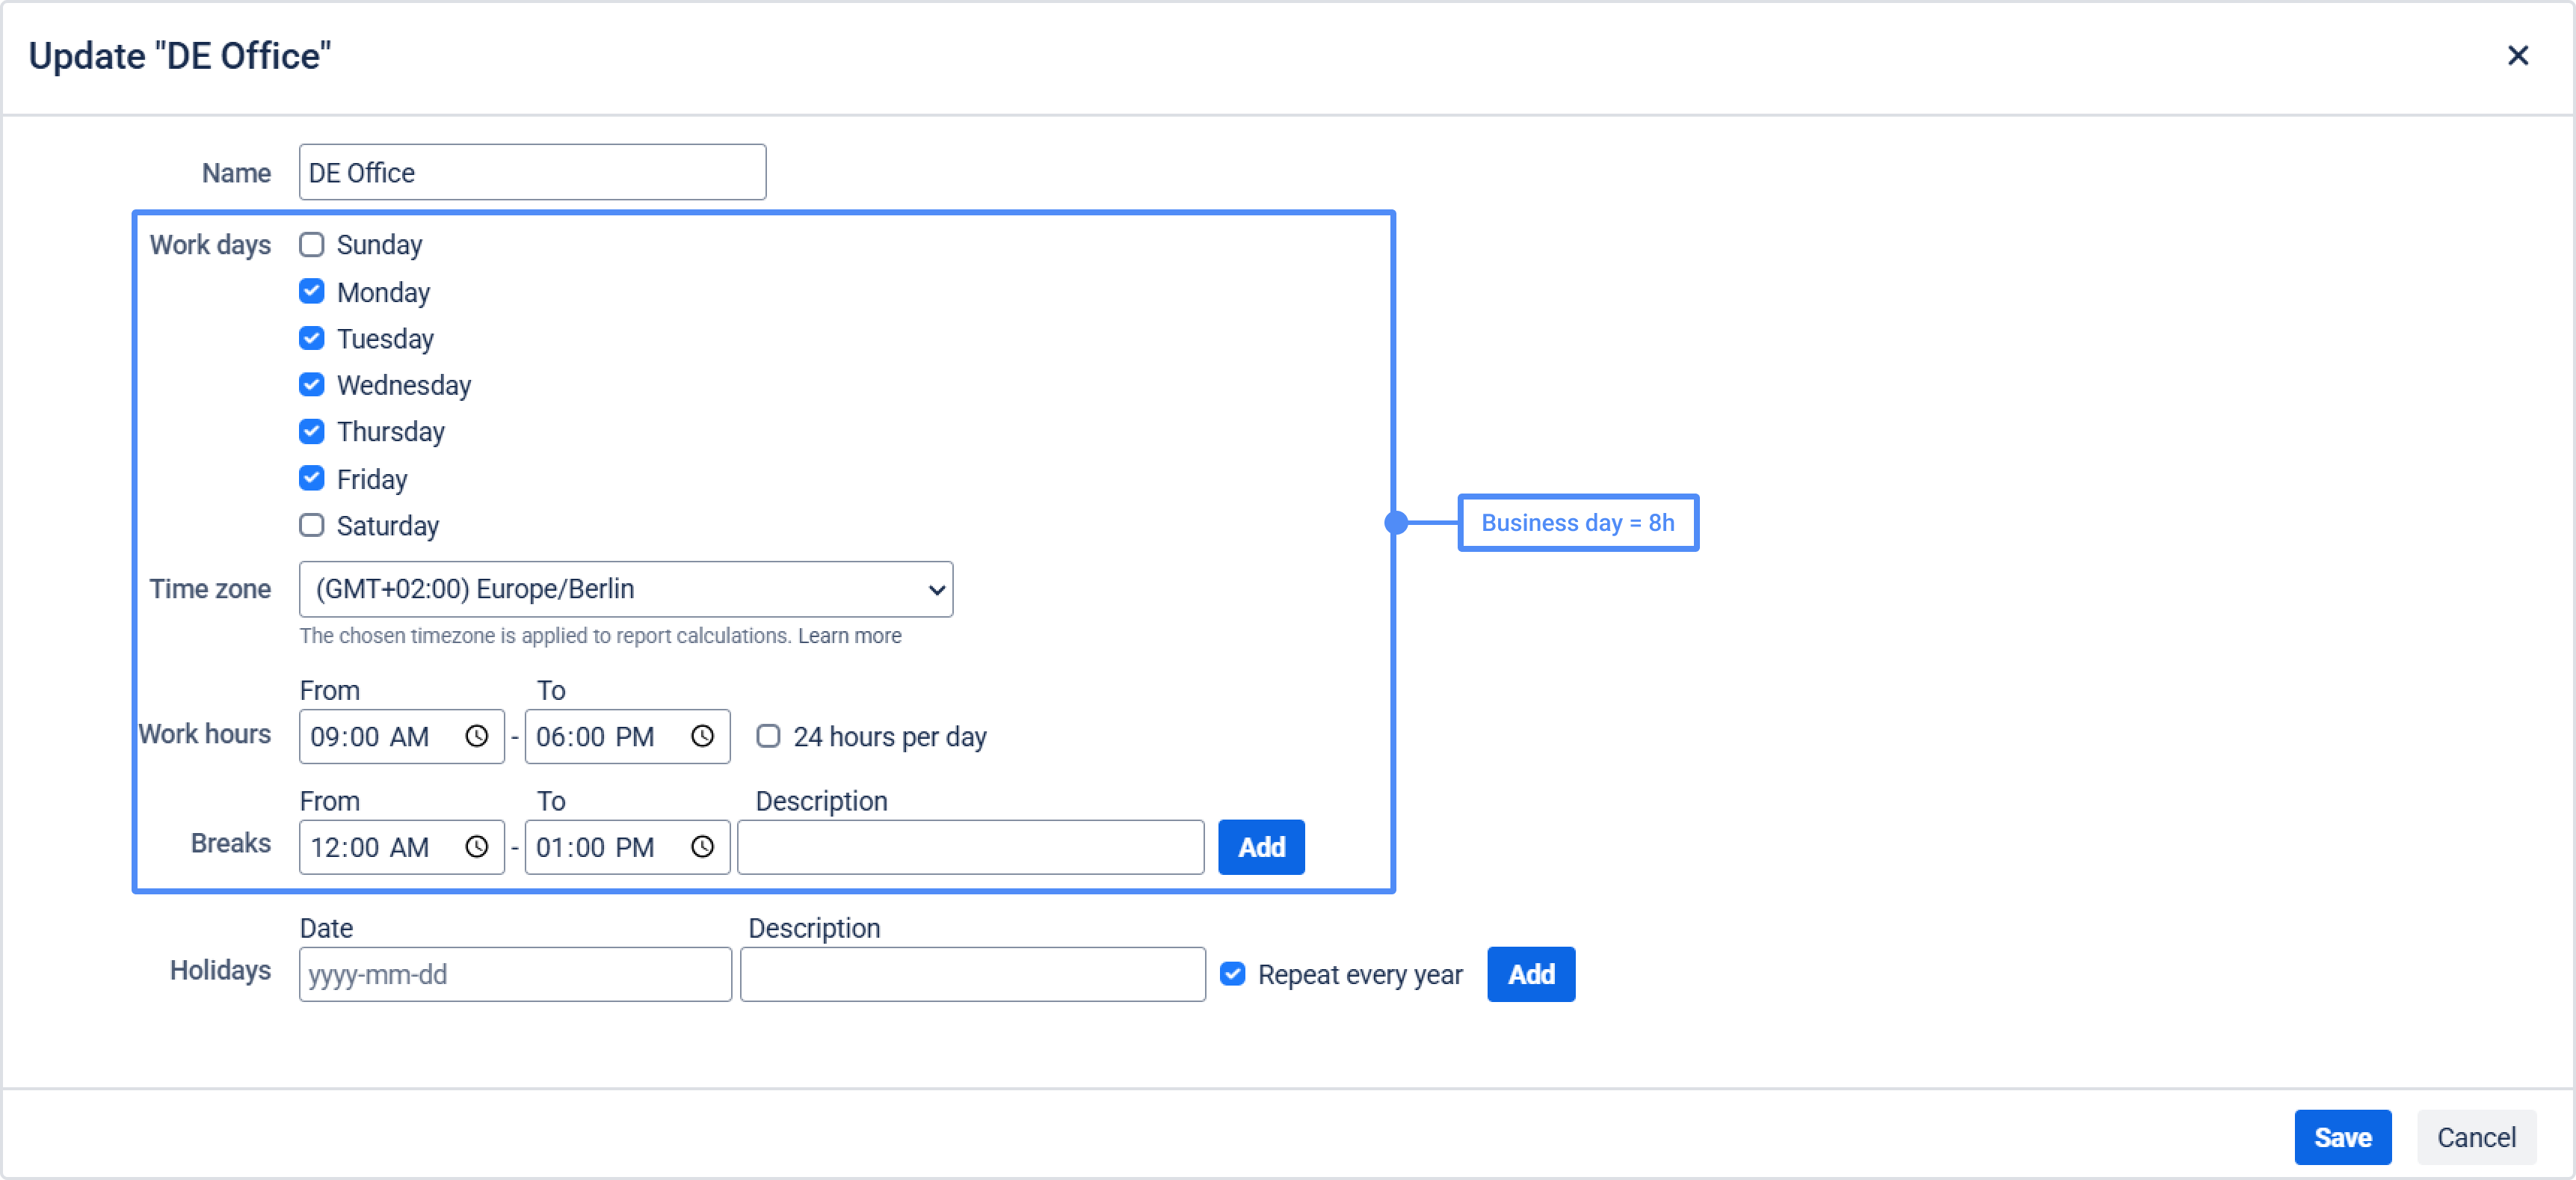
Business (working) days in reports are calculated based on the configured work calendar.
For example, if one calendar day = 24 hours and the work calendar defines one business day as 8 hours, then:
|
Decimal Hours |
Decimal Days |
Business Decimal days |
|
8.00 |
0.33 |
1.00 |
|
16.00 |
0.66 |
2.00 |
|
24.00 |
1.00 |
3.00 |
Table of examples of time display in different formats
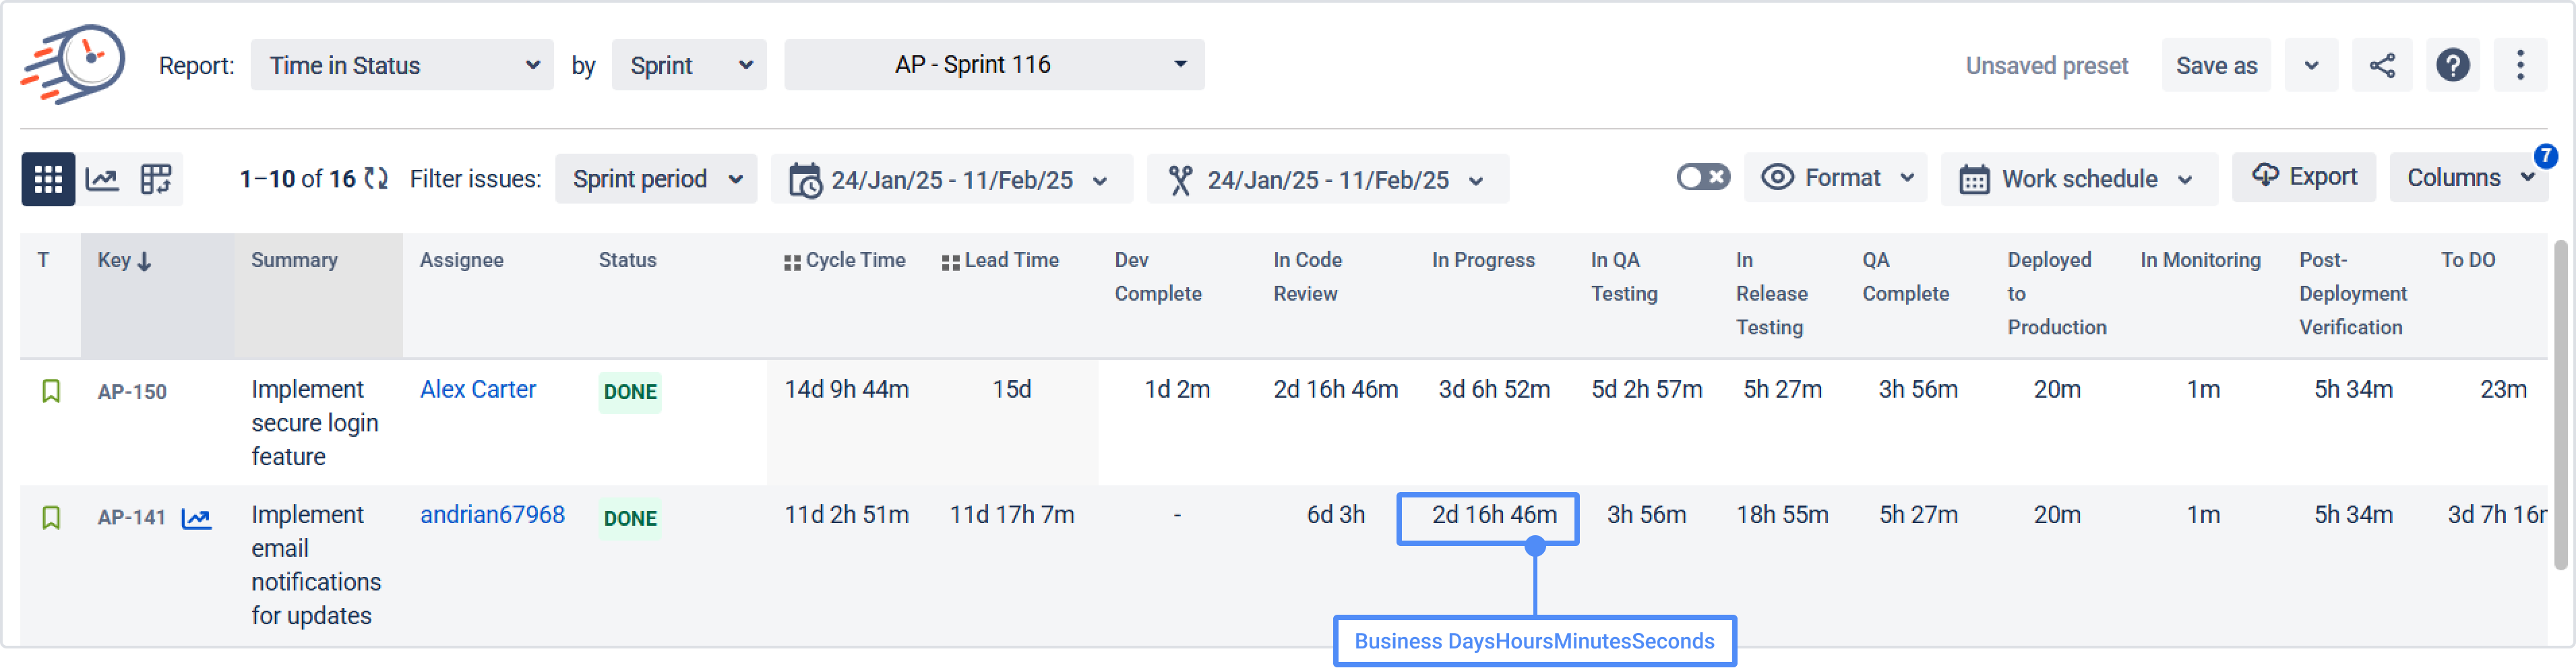
When using a Business Time format, the calculation follows the defined working hours per calendar day, ensuring accurate time tracking based on the work schedule.
Learn more: Work Schedules
Difference between zeros and dashes in table view
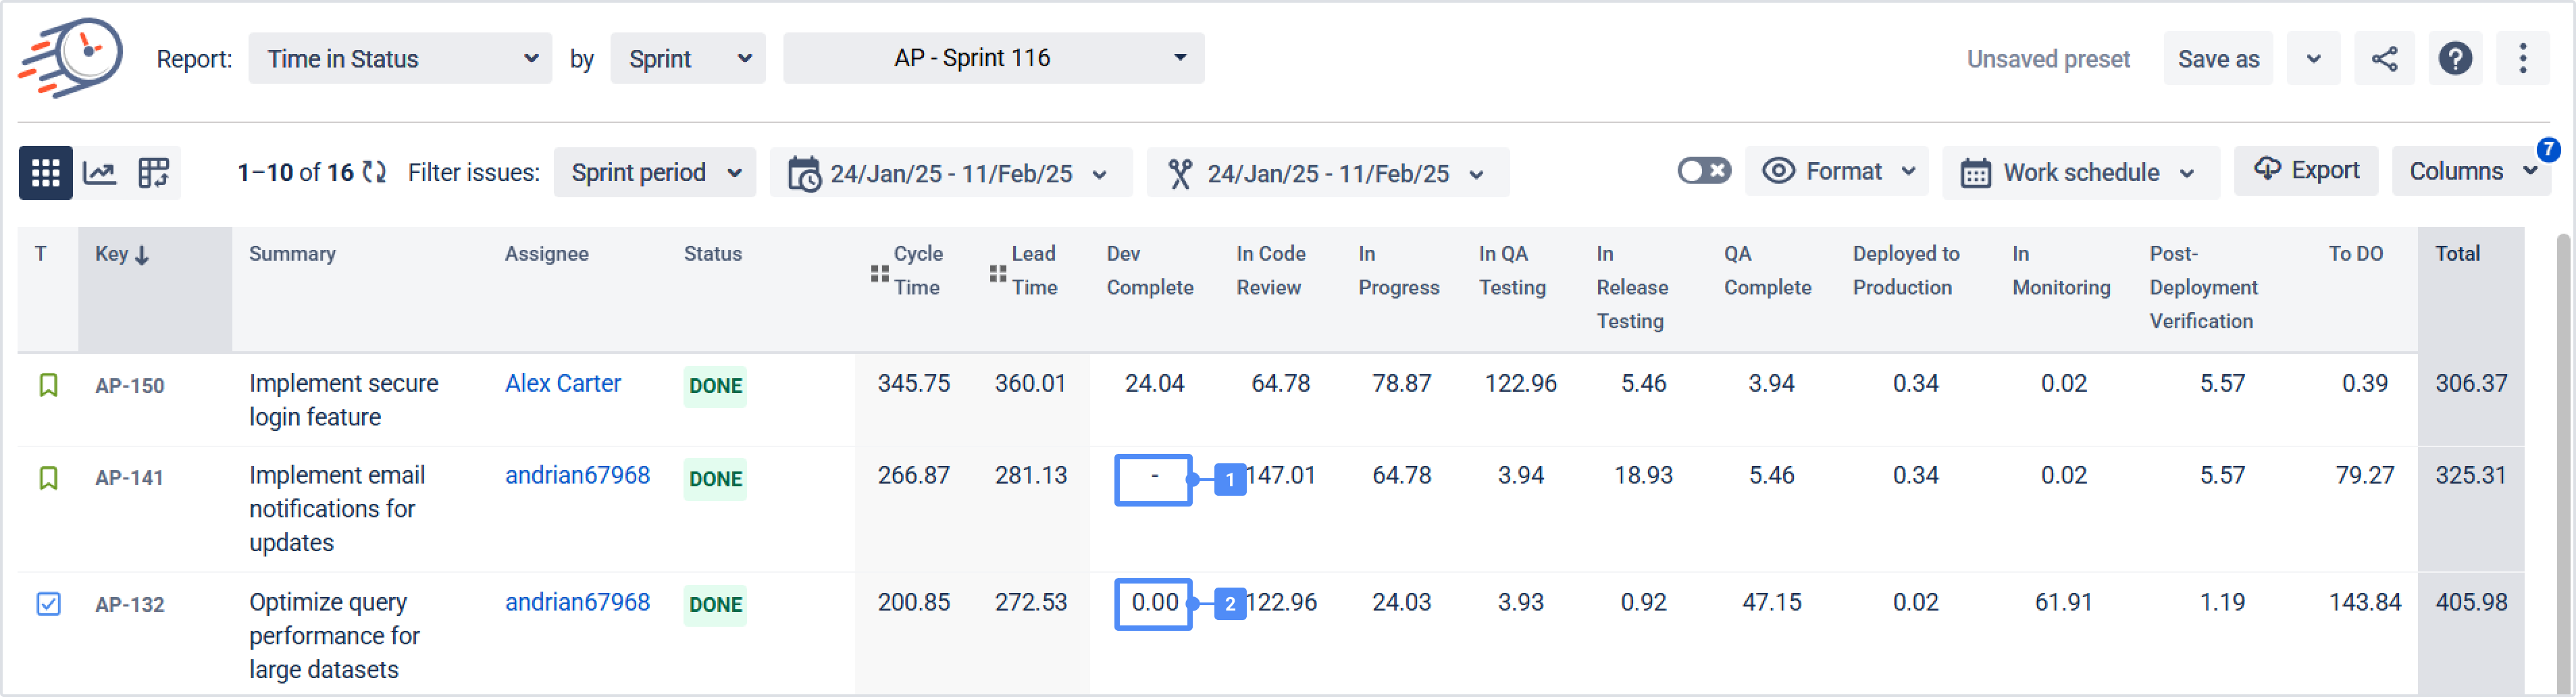
Zeros may appear in the display of any time format due to rounding. Very small values may round down to zero, while slightly larger ones round up. This means that if a task was in status for only a brief moment, the time may be too small to display and will appear as 0. If there is no recorded time, a “-” is shown.
Time in Status Report
Your workflow consists of a specific set of statuses. This report calculates the total time a task spends in each status throughout its lifecycle. For example, if a task stays in the "To Do" status for 2 hours before moving to "In Progress," and later returns to "To Do" for another 2 hours, the total time recorded for "To Do" will be 4 hours.
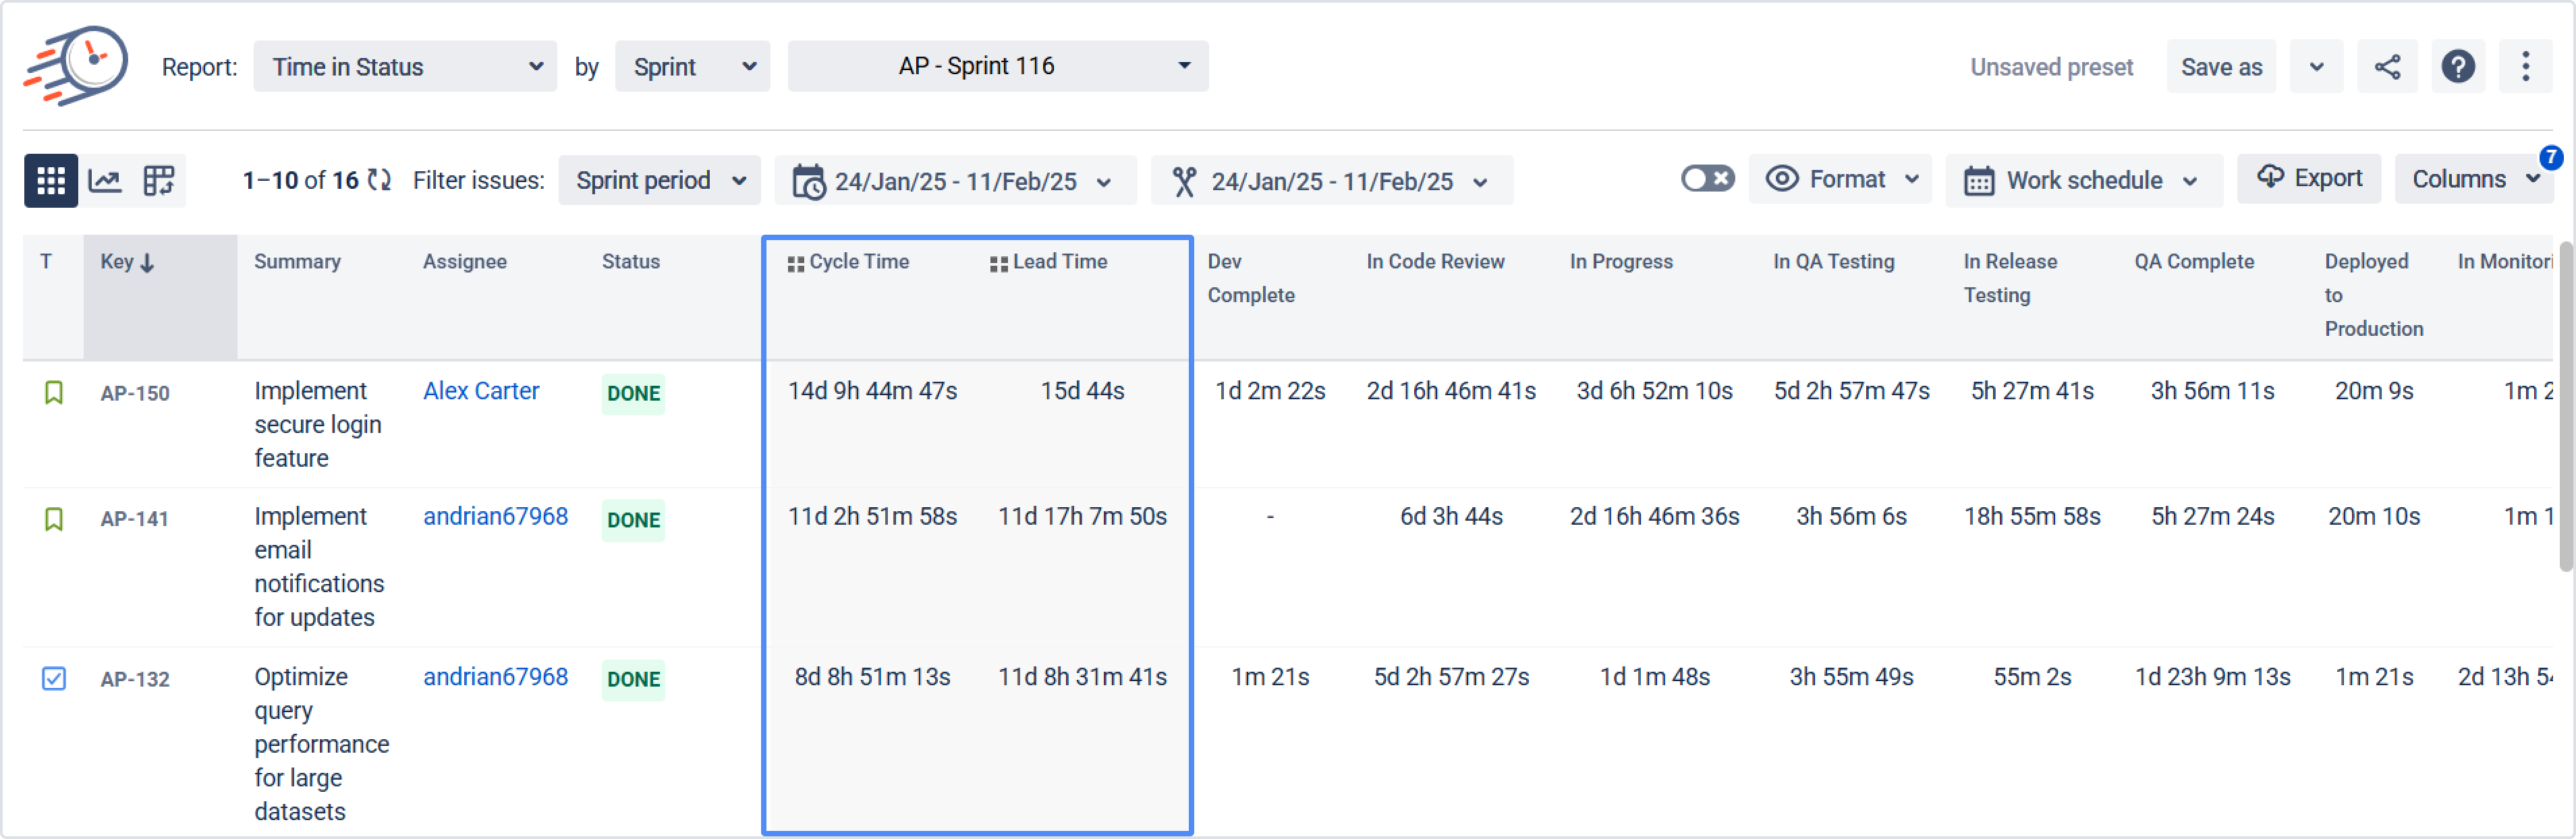
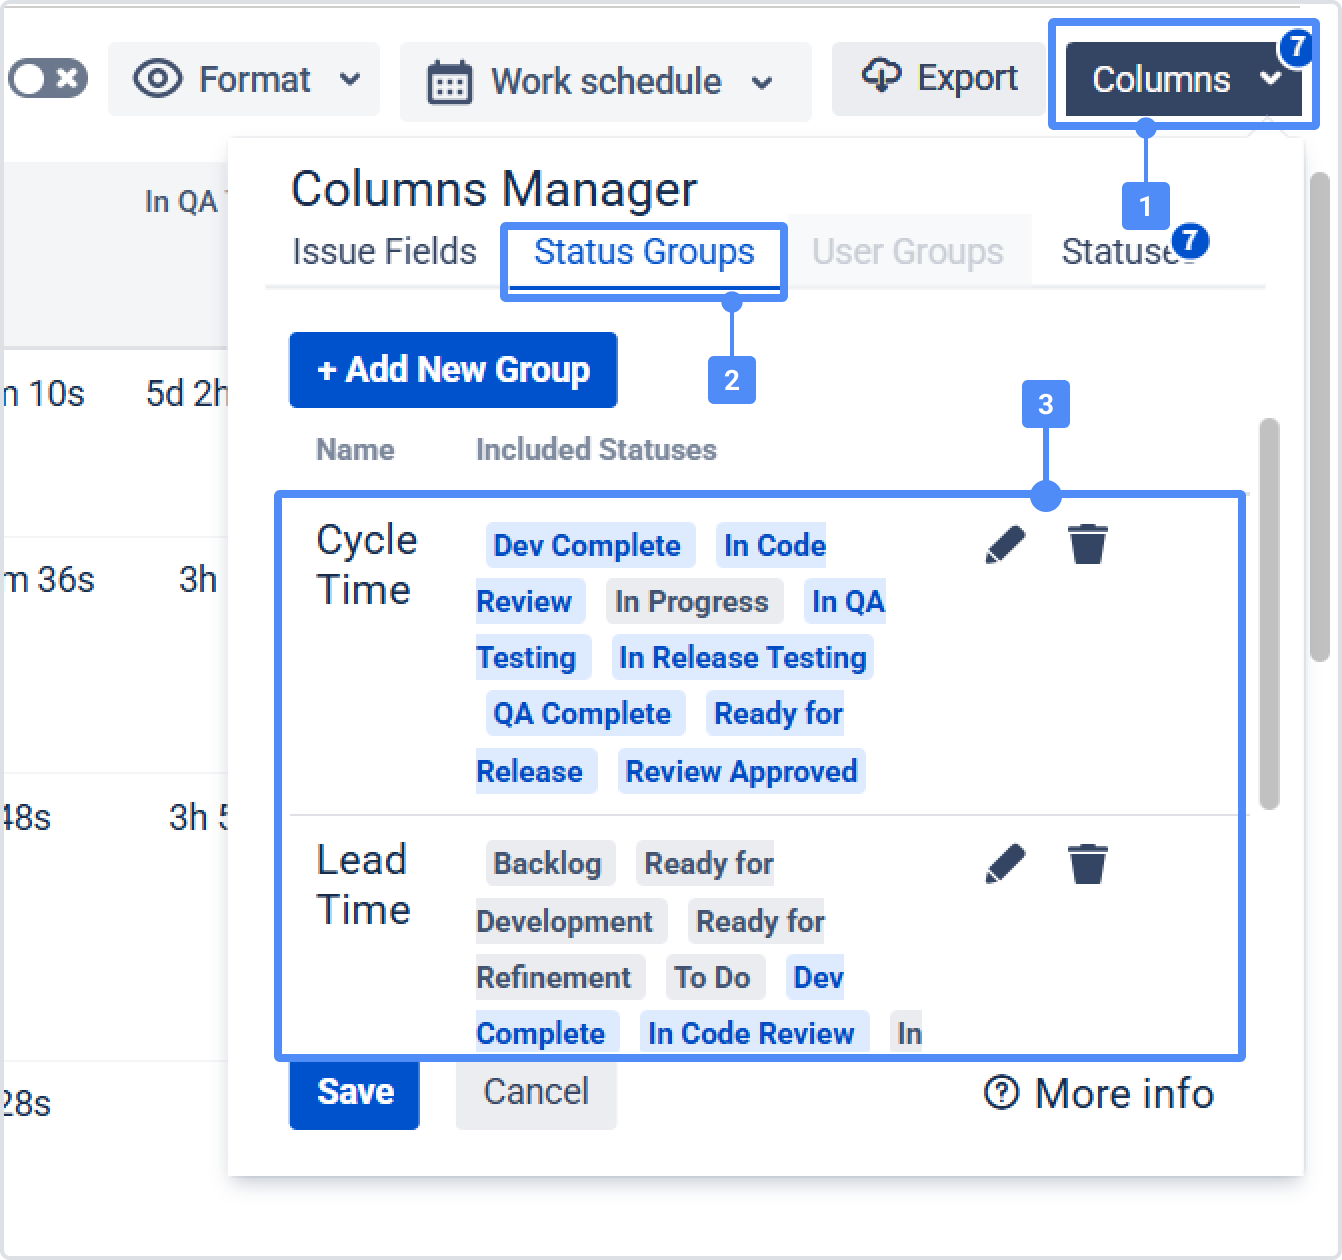
Status Groups, which are used to calculate metrics like Cycle Time and Lead Time, are defined by the set of statuses included in them, as specified in the Columns Manager settings. The total time is then calculated by summing the durations of these statuses.
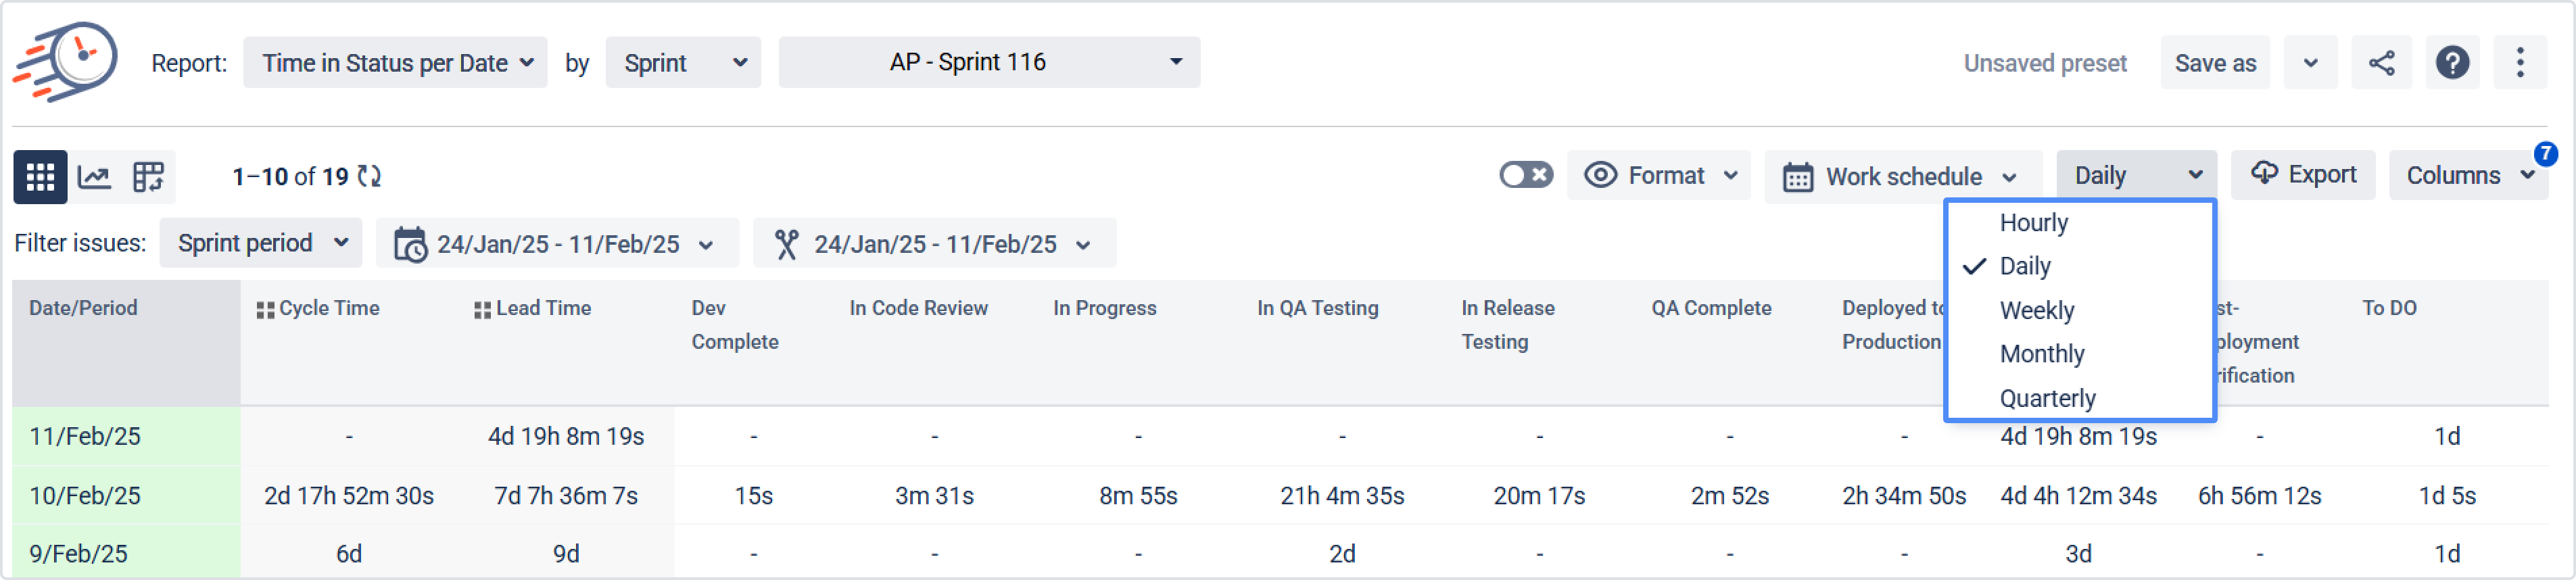
Time in Status per Date Report
The report calculates how much time the tasks in your specific selection spent in each status according to the chosen time period (Daily, Weekly, Monthly, Quarterly). The calculation of the Status groups is similar to this logic.
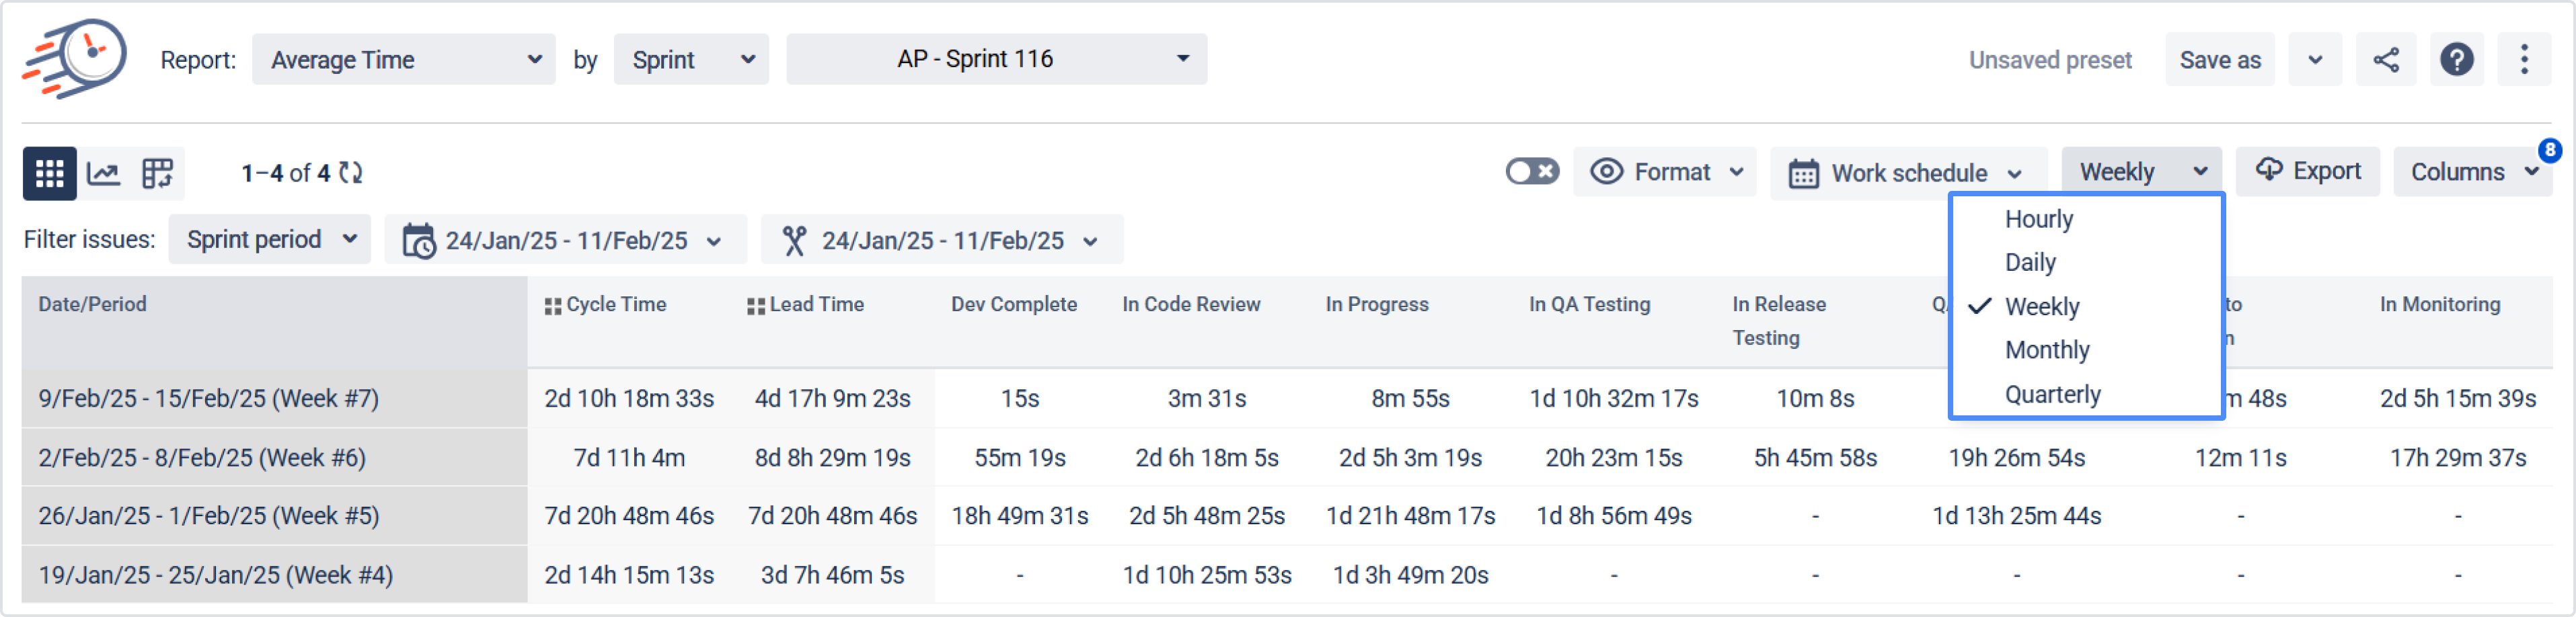
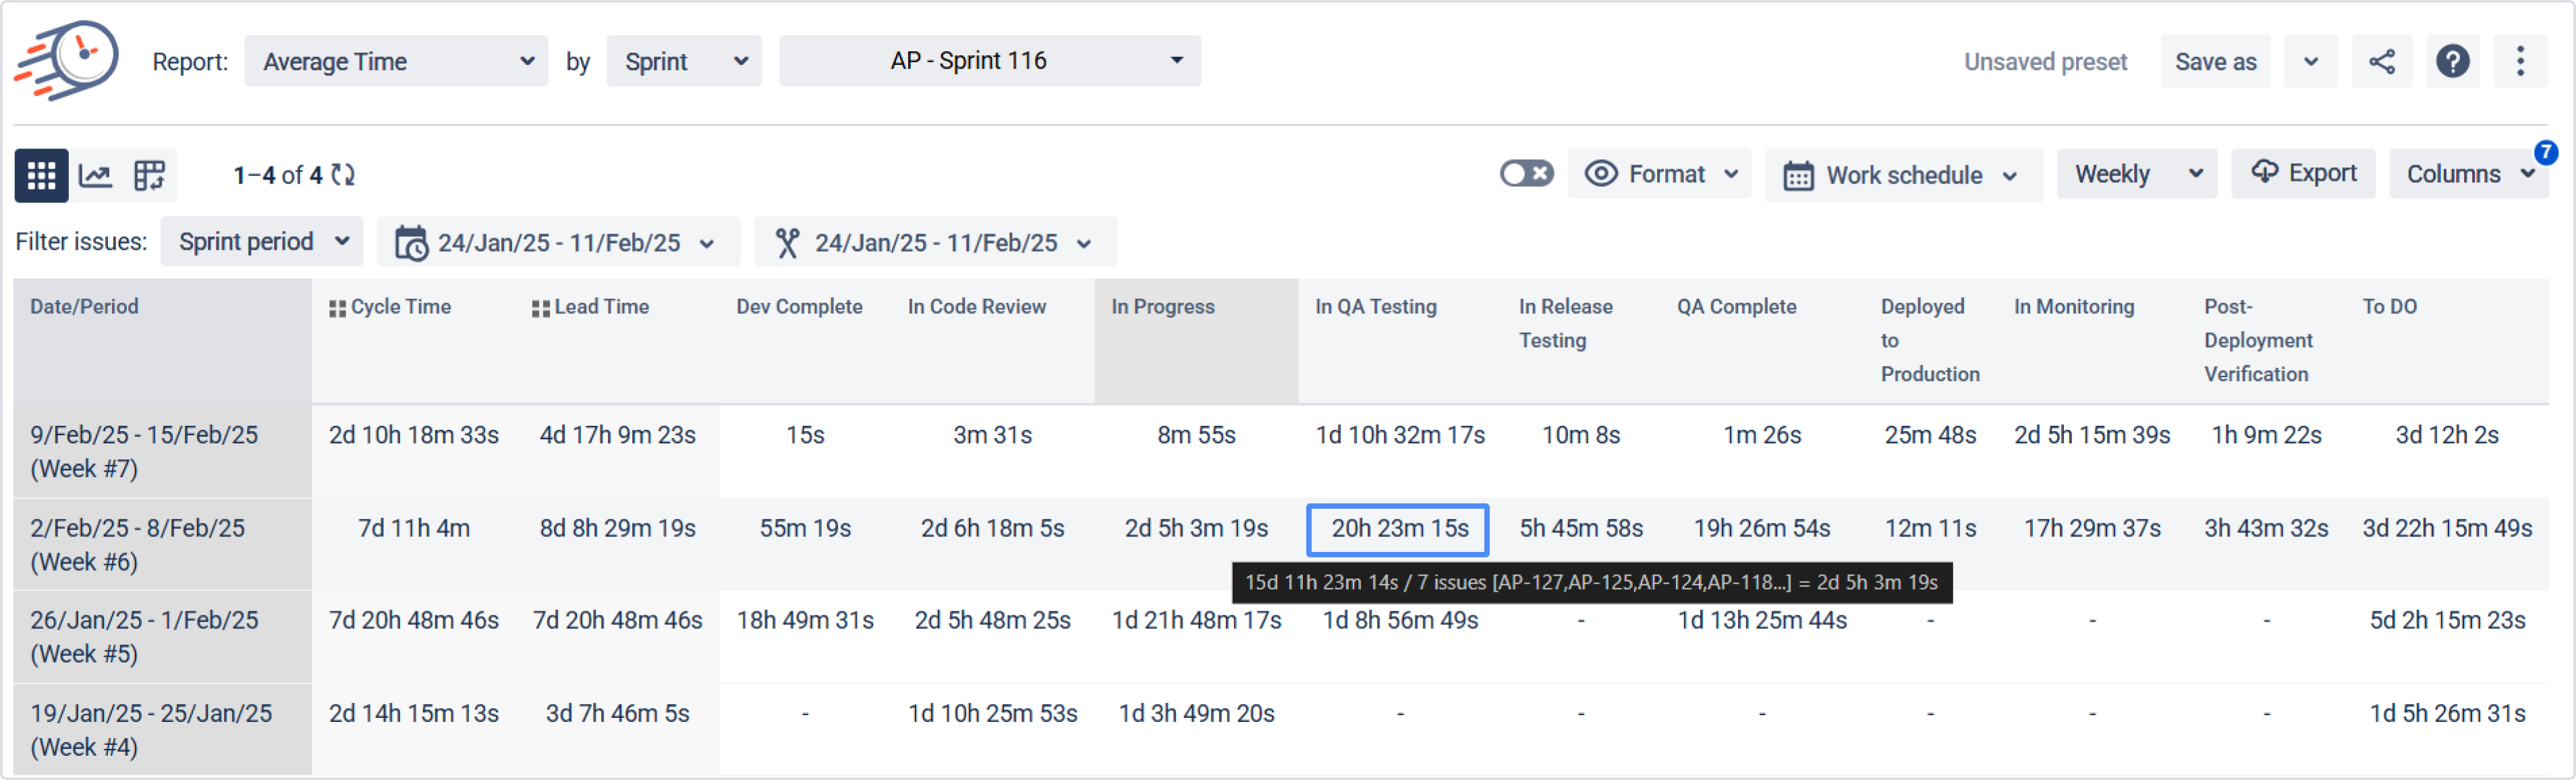
Average Time Report
The calculation is based on the average time in status value according to the chosen time period (Daily, Weekly, Monthly, Quarterly).
-
The app counts the number of tasks that have been or are currently in a specific status for a certain period.
-
It sums up the total time spent in status on these tasks.
-
It calculates the average time using the formula:
Average Time in Status = Total Spent Time in Status / Number of Tasks
The same logic applies when calculating the average value of Status Groups. All values within a specific Status Groups for a given period are summed and divided by the number of records, excluding any zero values.
Assignee Time Report
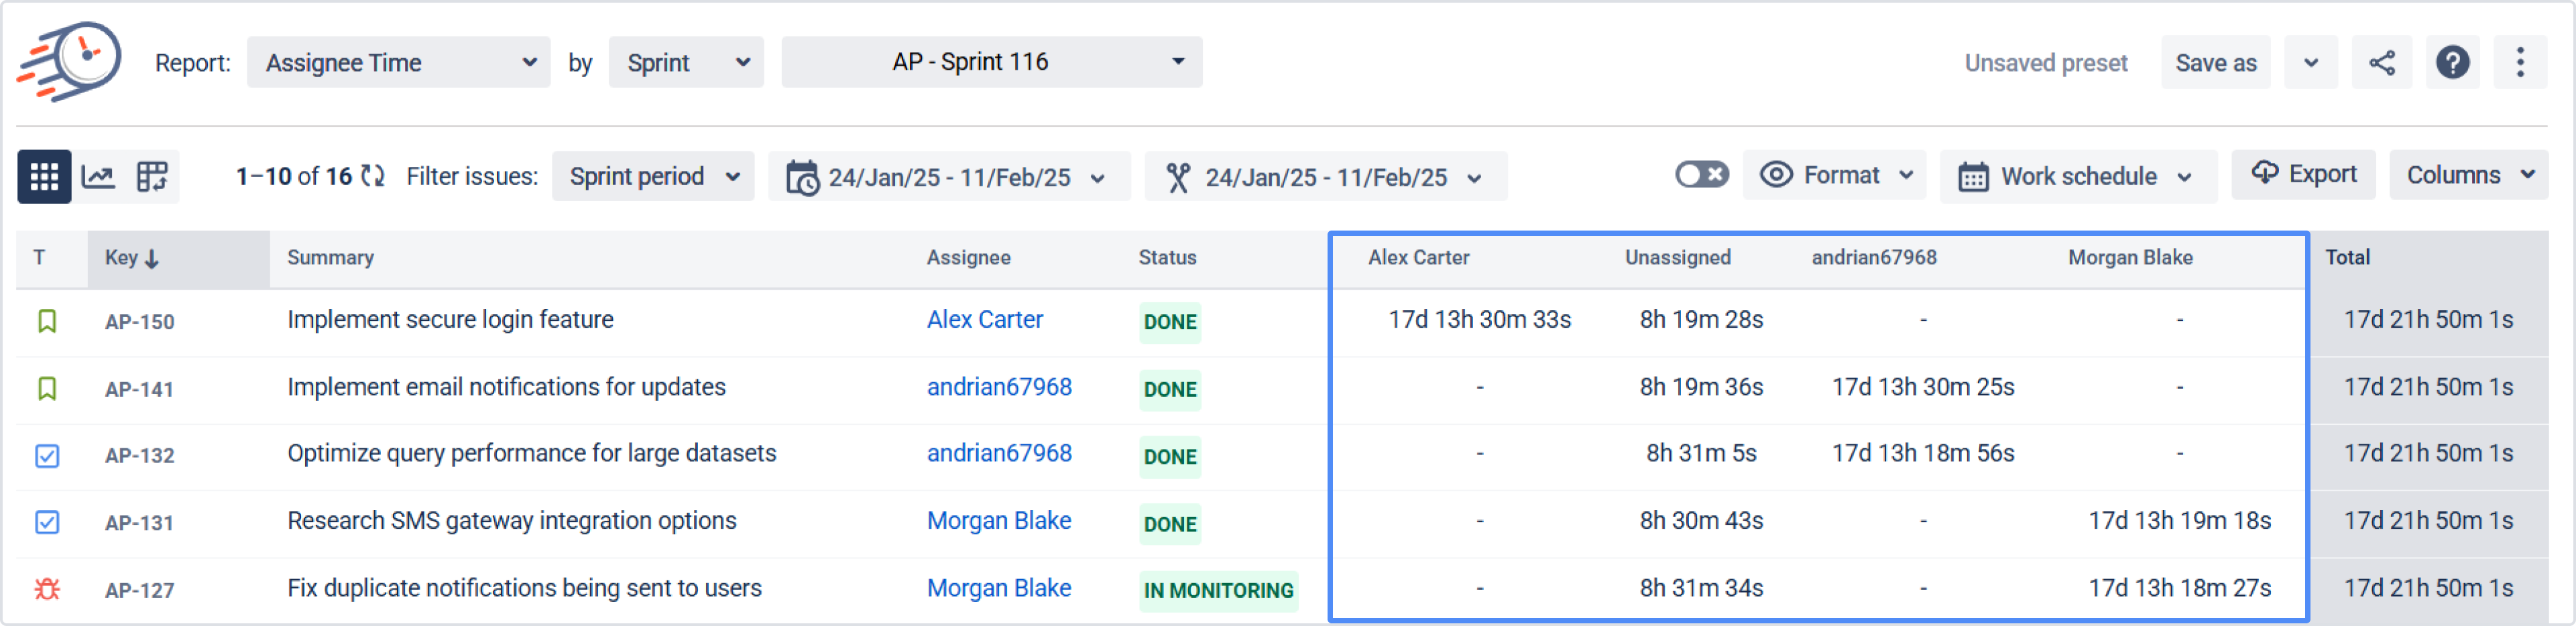
This report tracks how long a task has been assigned to a specific team member. The column displays the Assignees involved in the task over a given period, while the Total column shows the combined time for all Assignees who worked on the work item at any point.
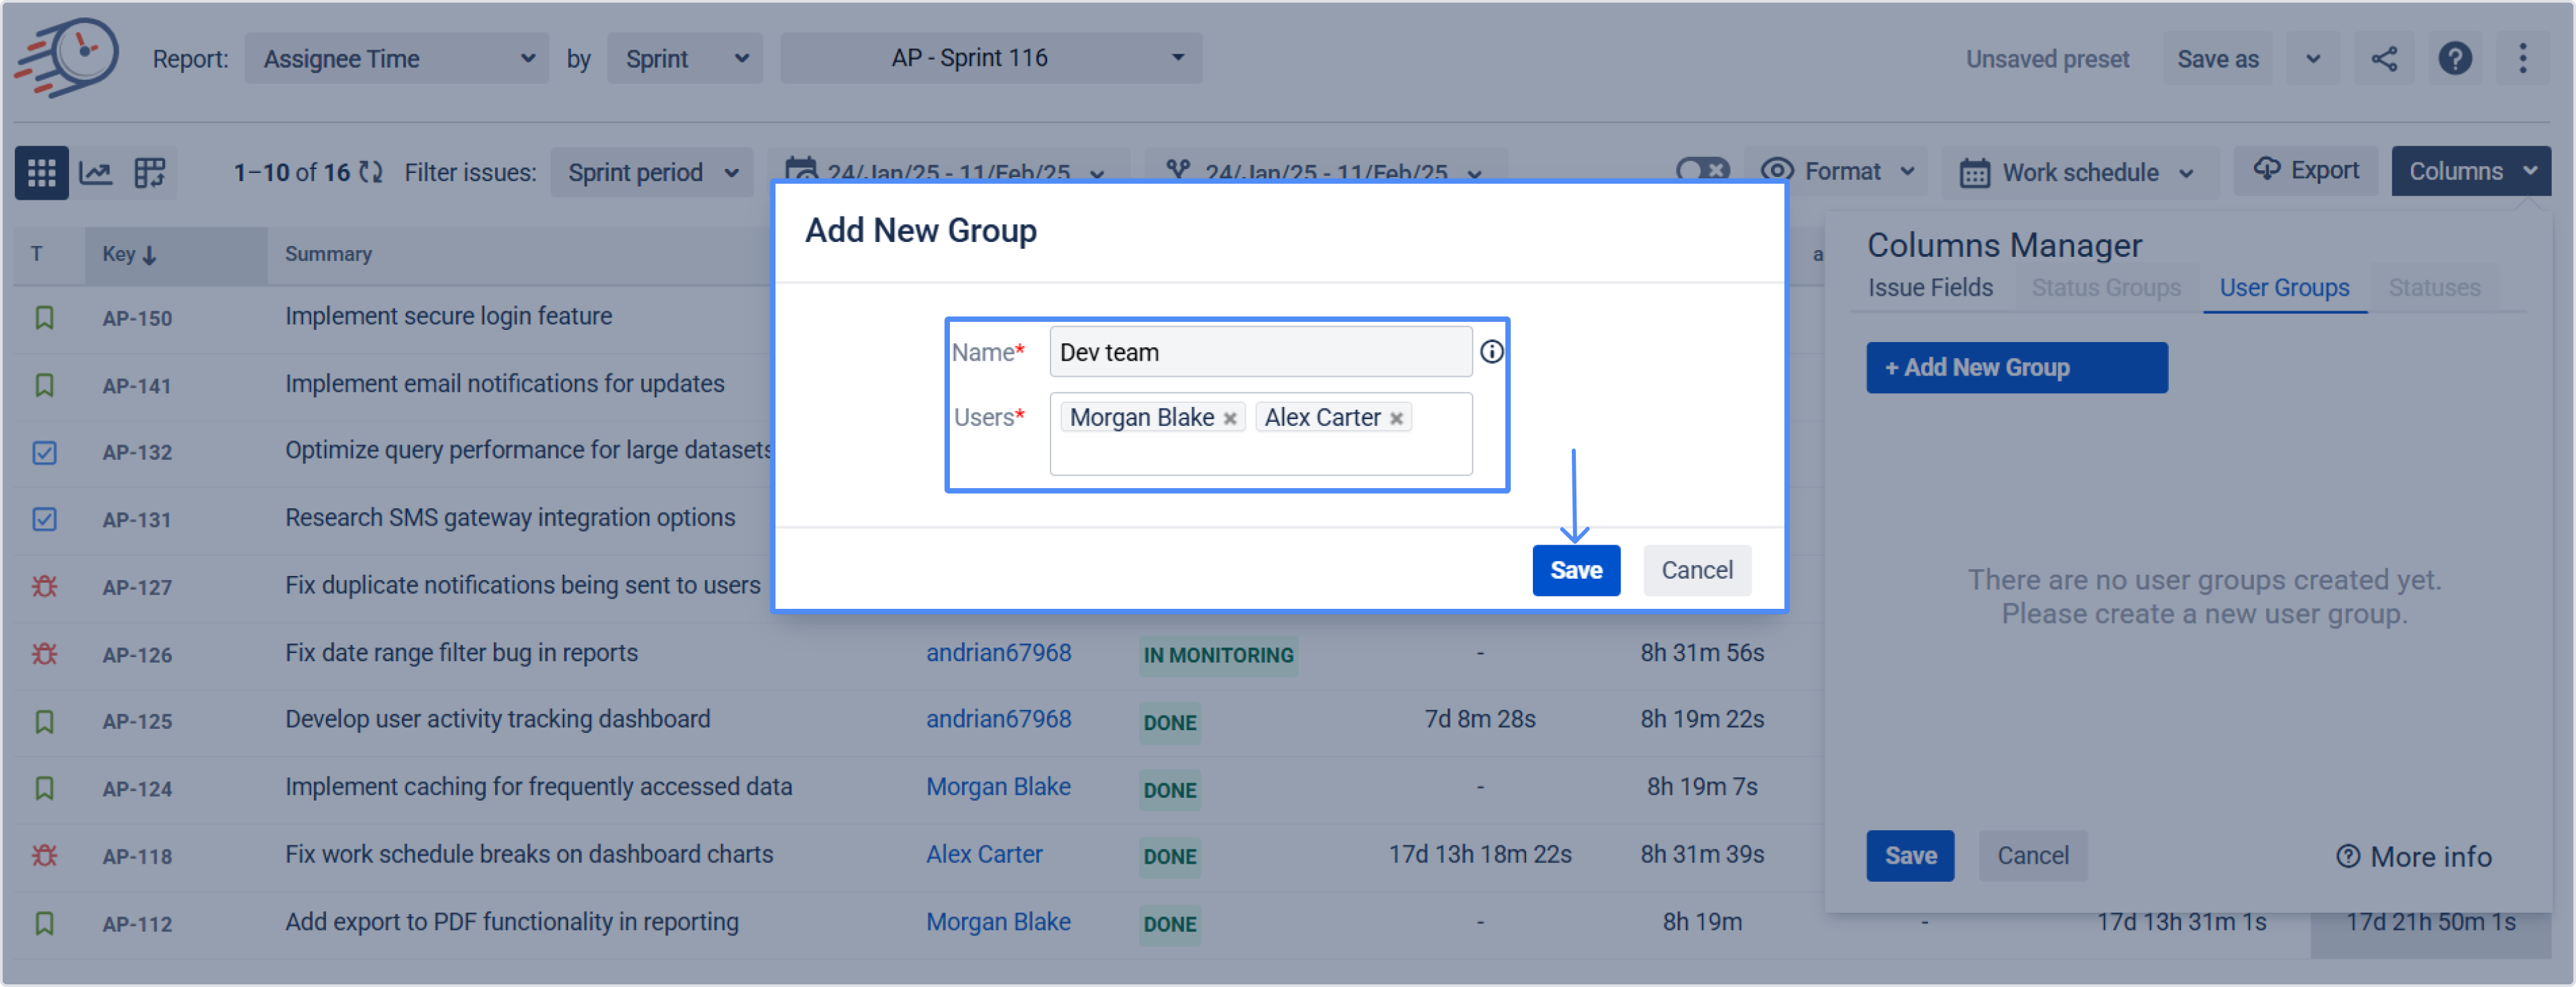
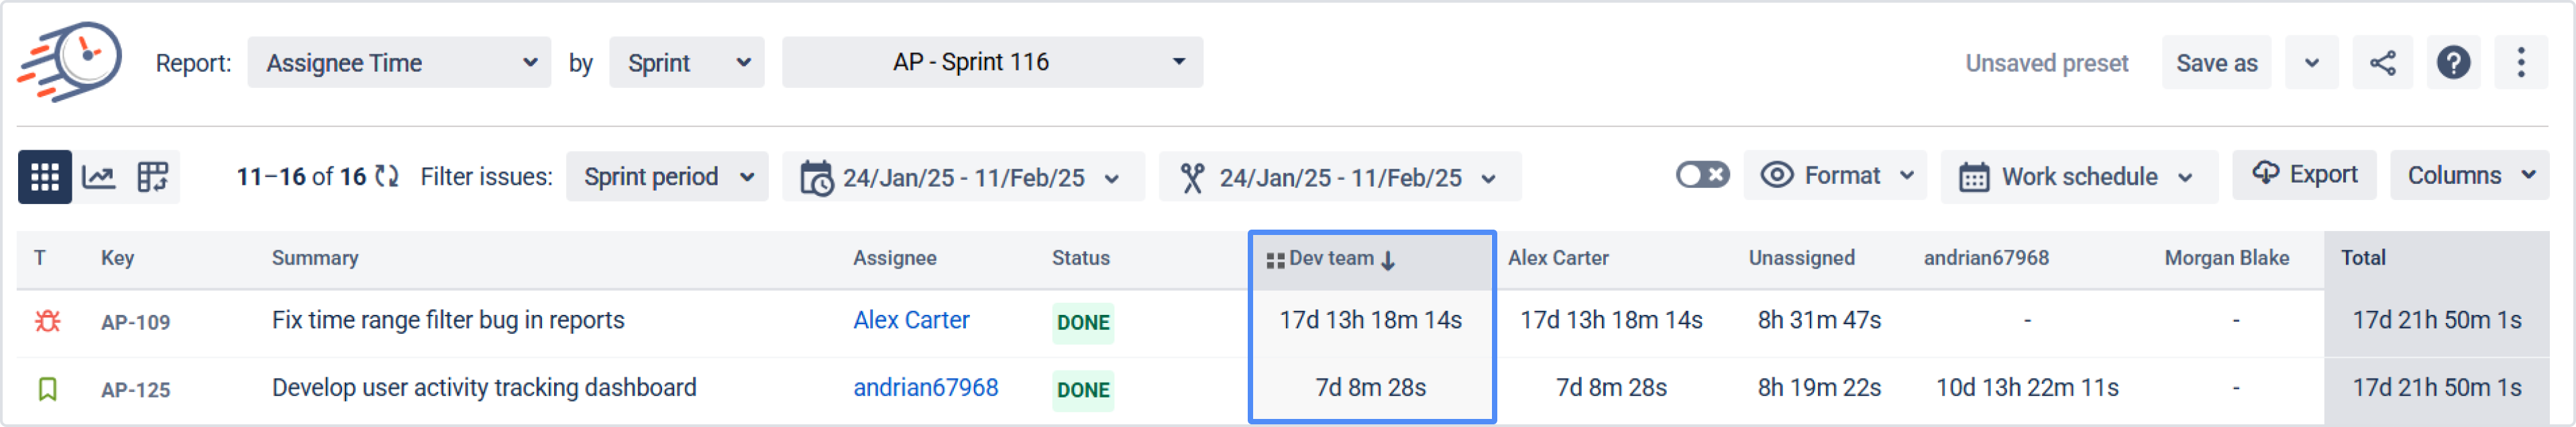
Get the total time in Assignee field for a user group in a single column. In the Assignee Time Report, you can manage User Groups through the Columns Manager in the Assignee Time Report.
Here, you can add a new group or edit/delete existing ones. When creating a new group, enter a name for your User group and add the necessary users. This will generate a single column that sums the data from your selected Assignees.
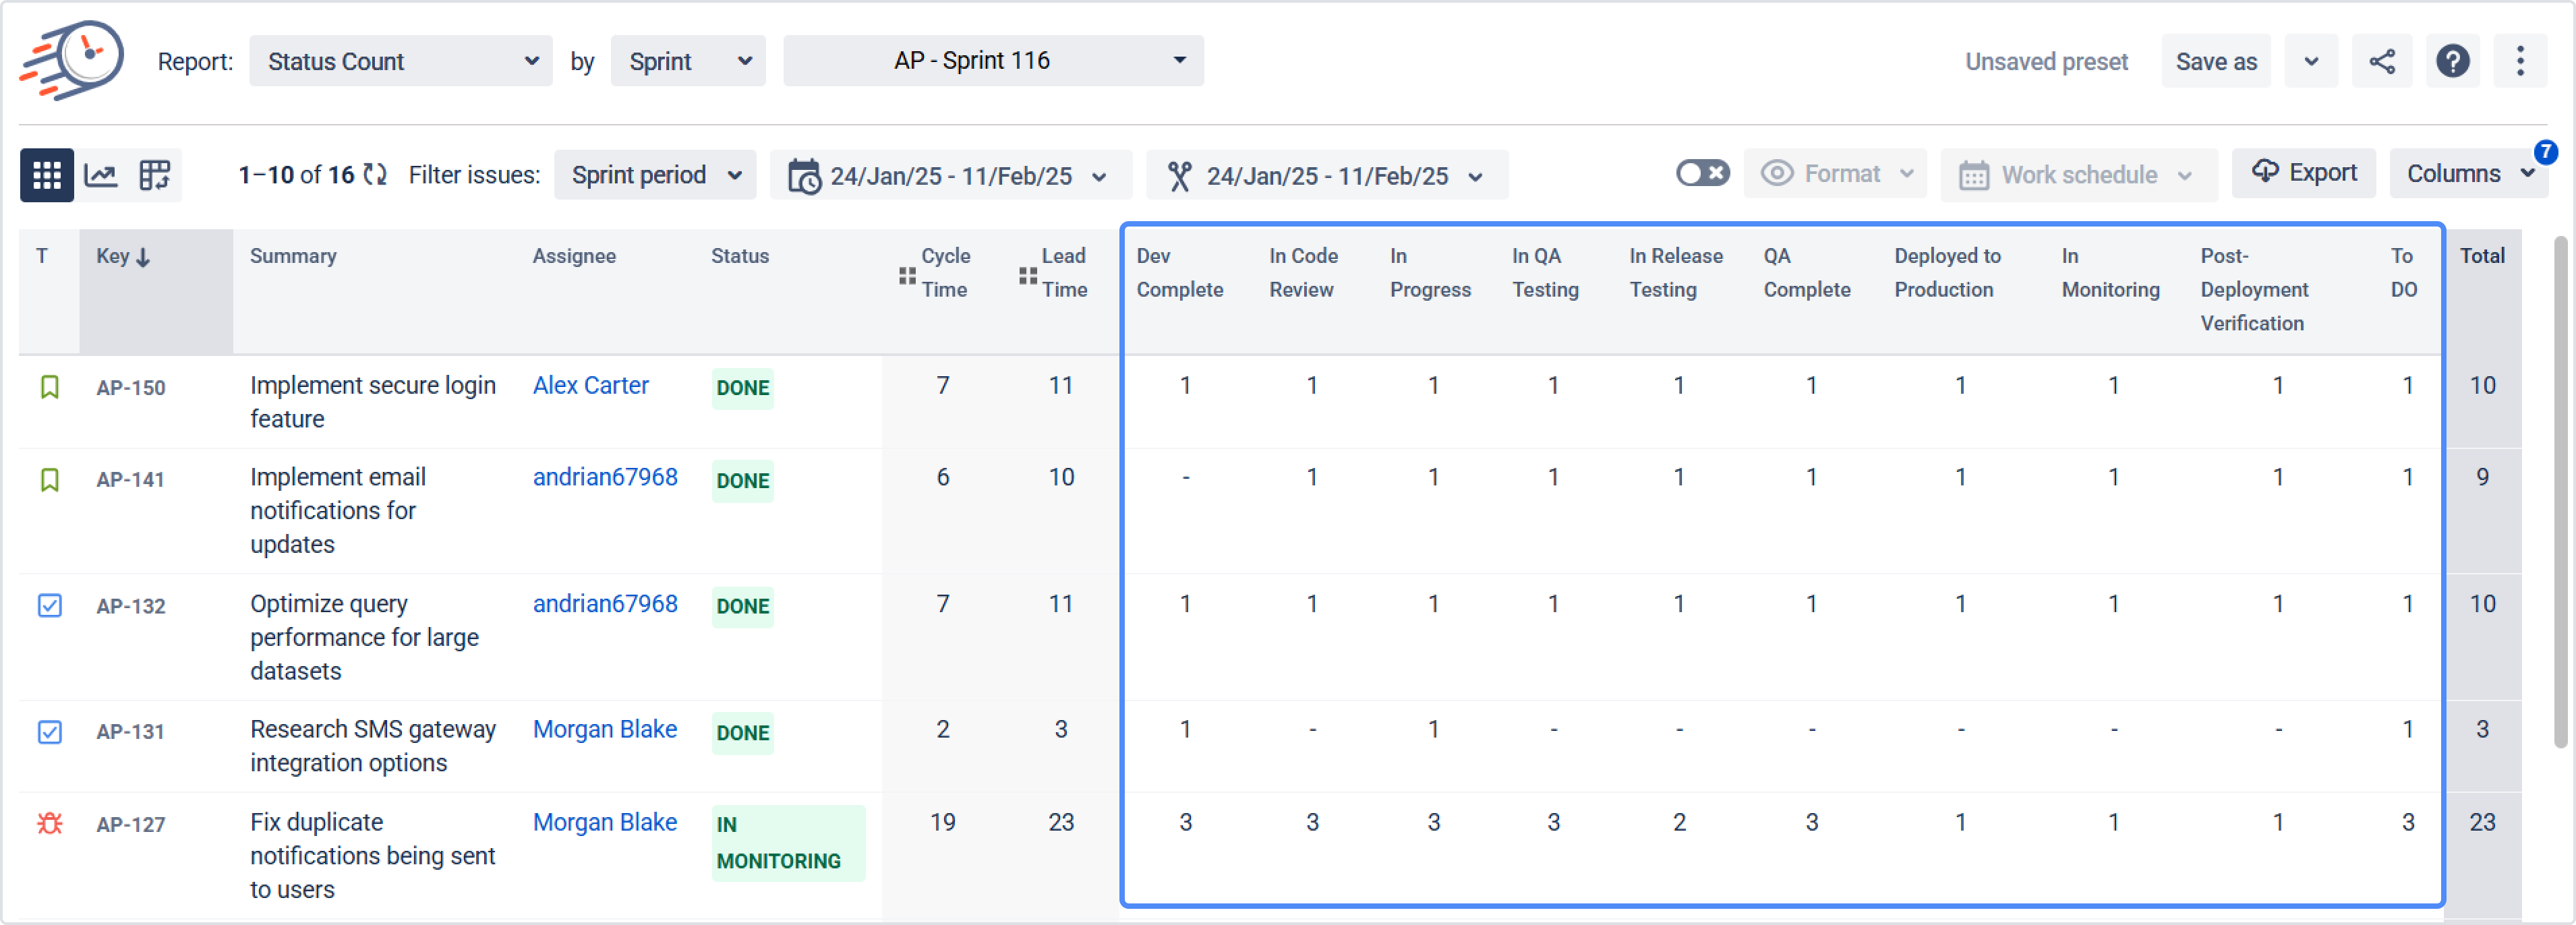
Status Count Report
The report calculates how many times a task has been in different statuses.
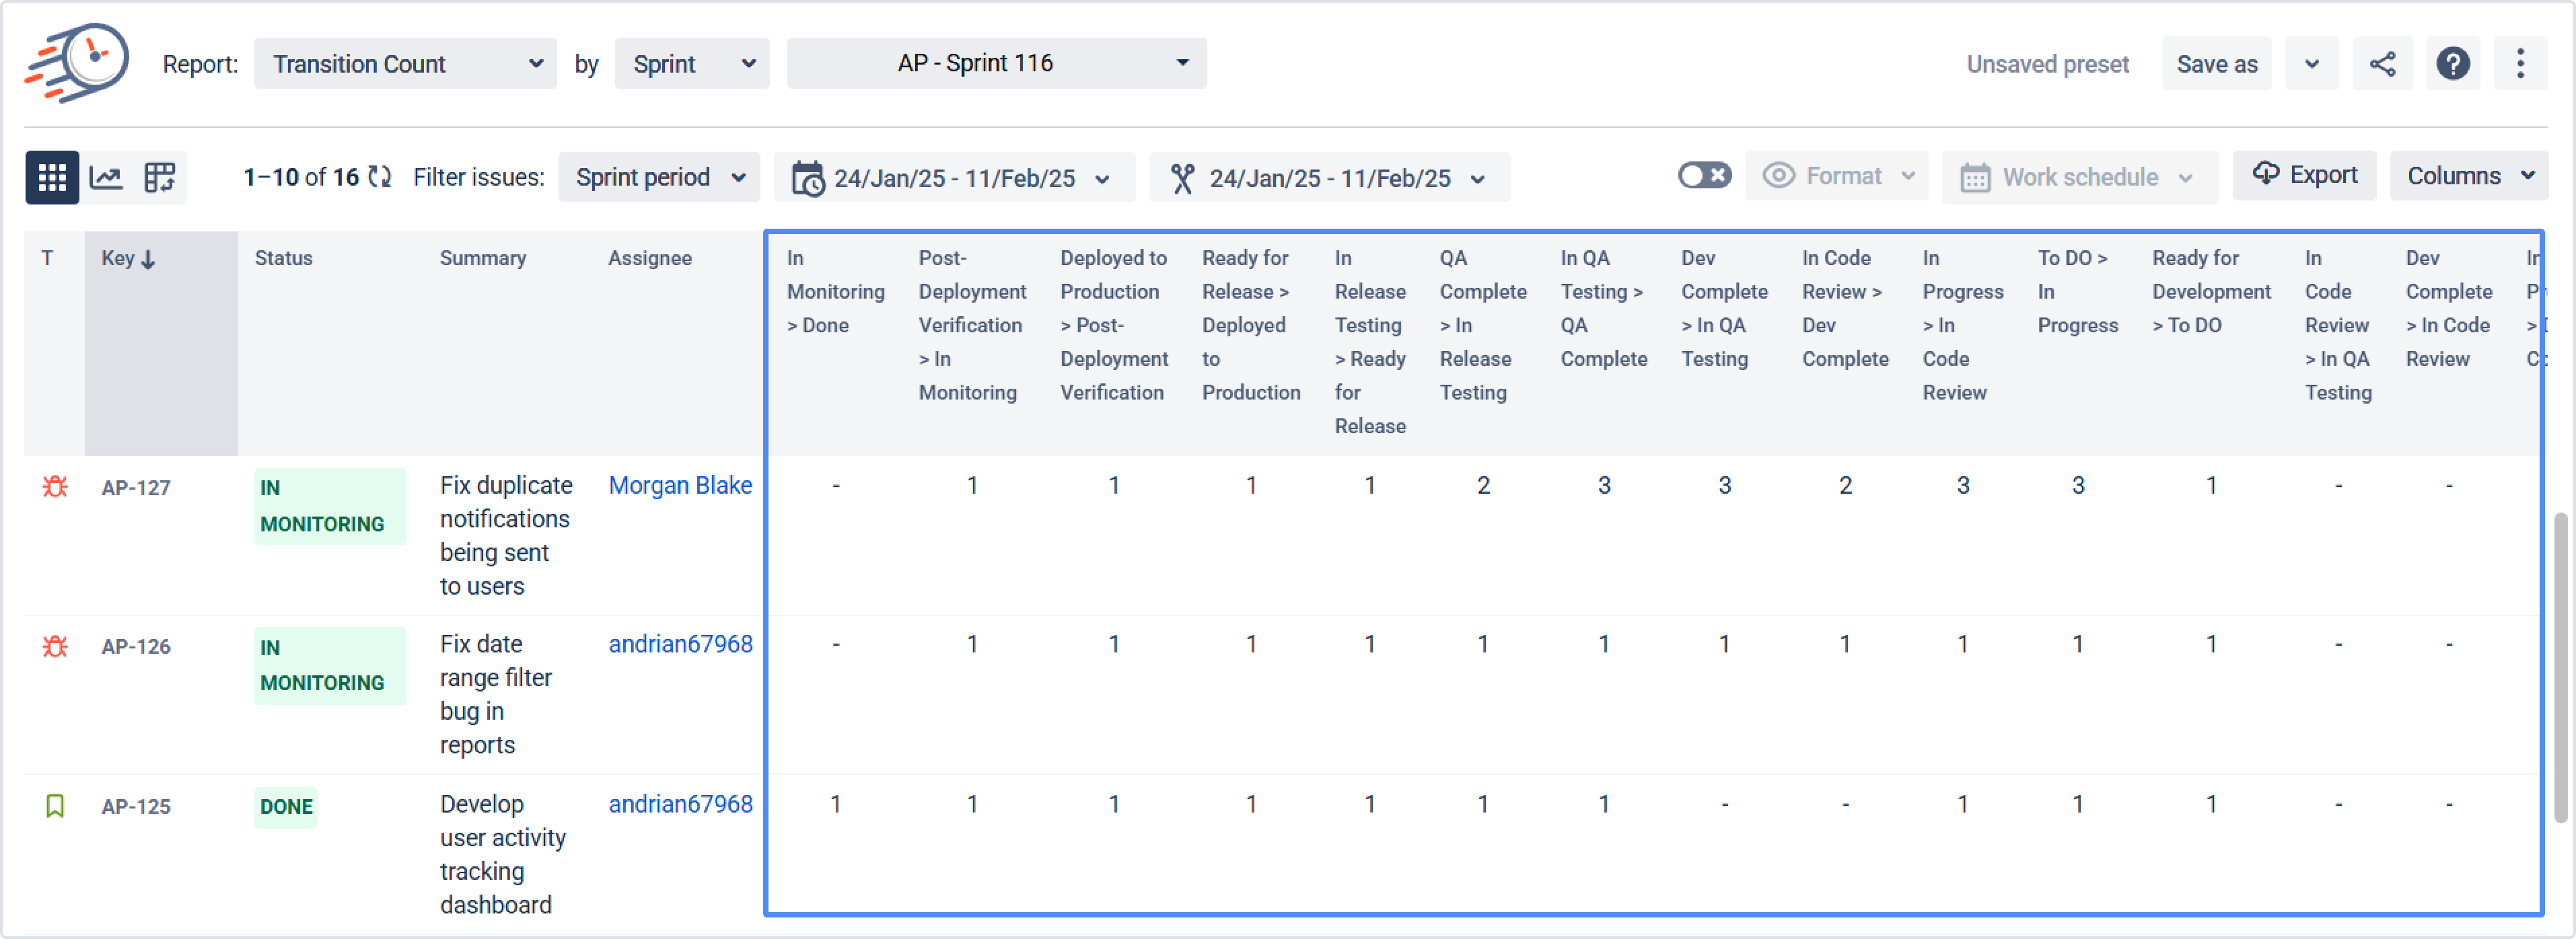
Transition Count Report
It is calculated the number of times it has transitioned between different statuses. The column names indicate the statuses between which the transition occurred.
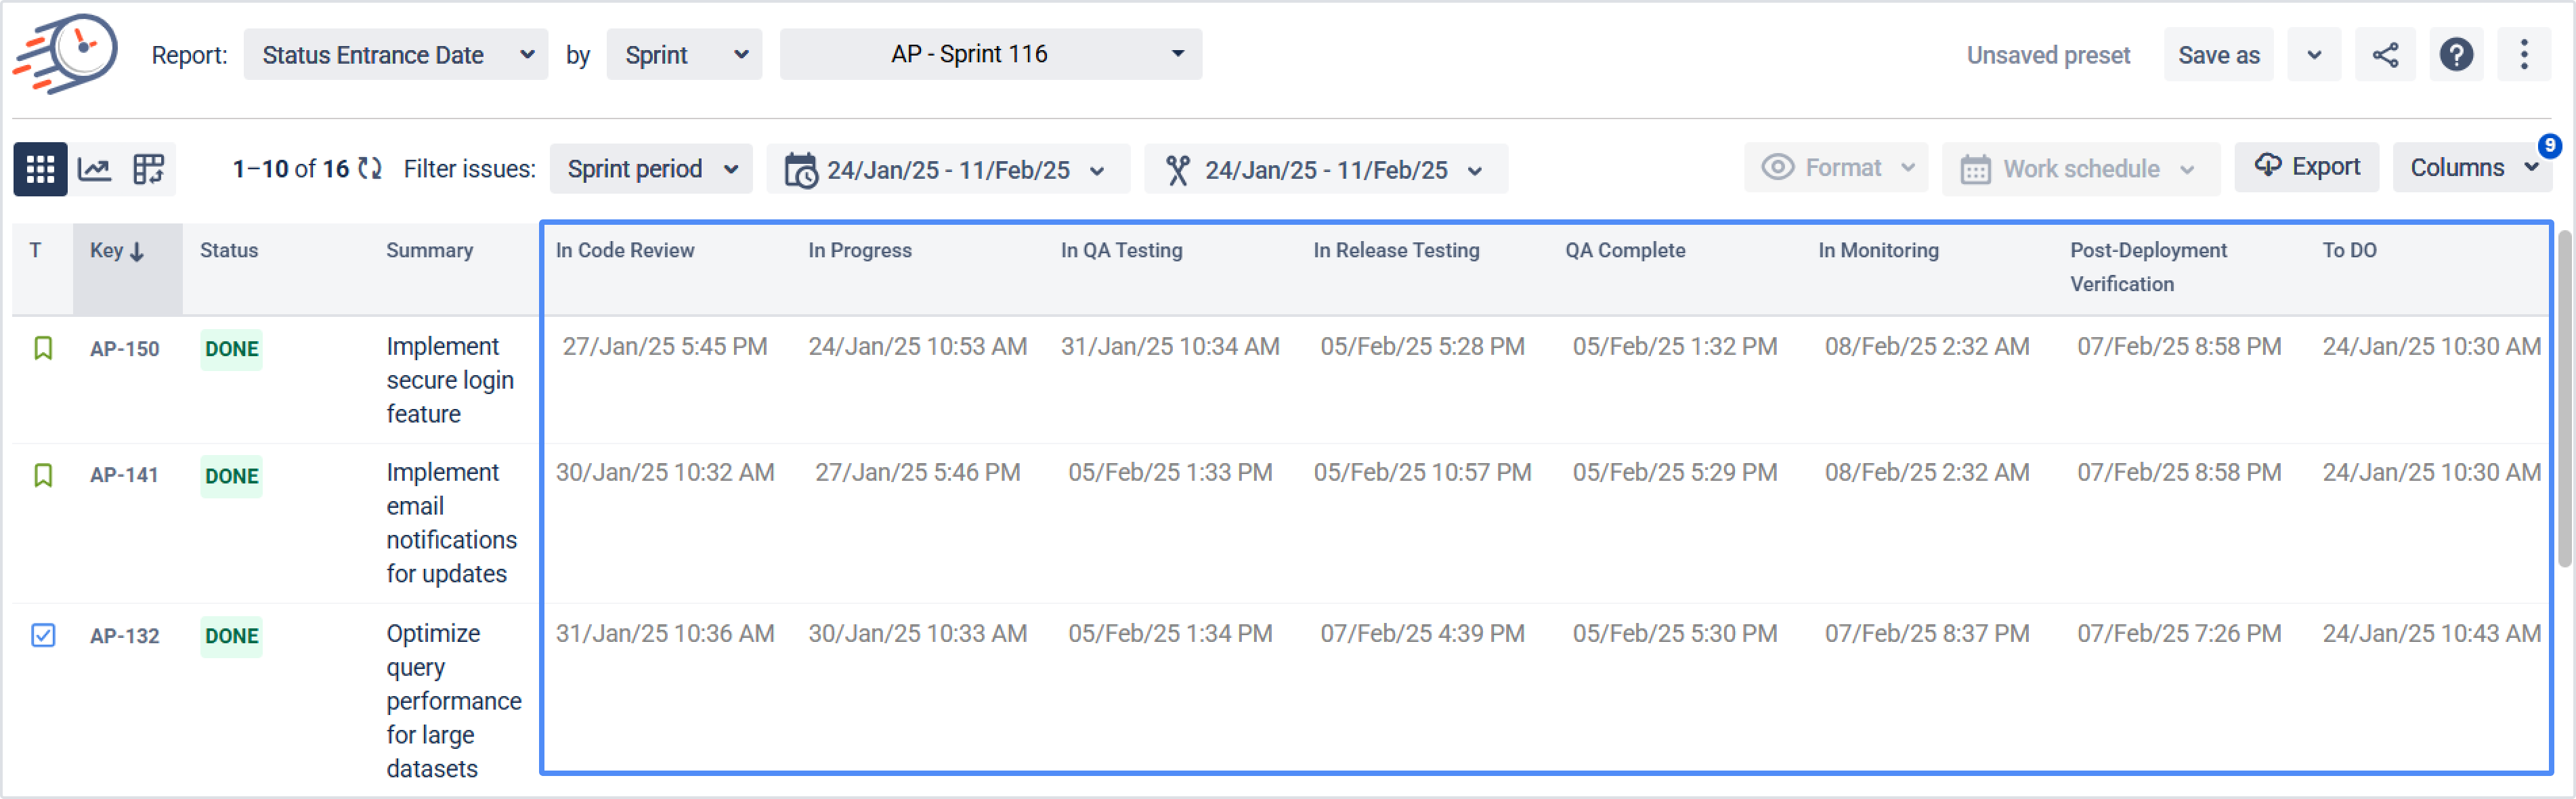
Status Entrance Date Report
The Status Entrance Date report displays the first date a work item transitioned into a specific status.
Time in Status Custom Fields
The Time in Status values in custom fields are calculated per task and reflect only the time spent in the current status.
-
Accumulated Time in Status. If a task returns to the same status multiple times, the time spent in that status is summed up:
Total Time in Status= SUM of (Time Spent in Each Entry)
-
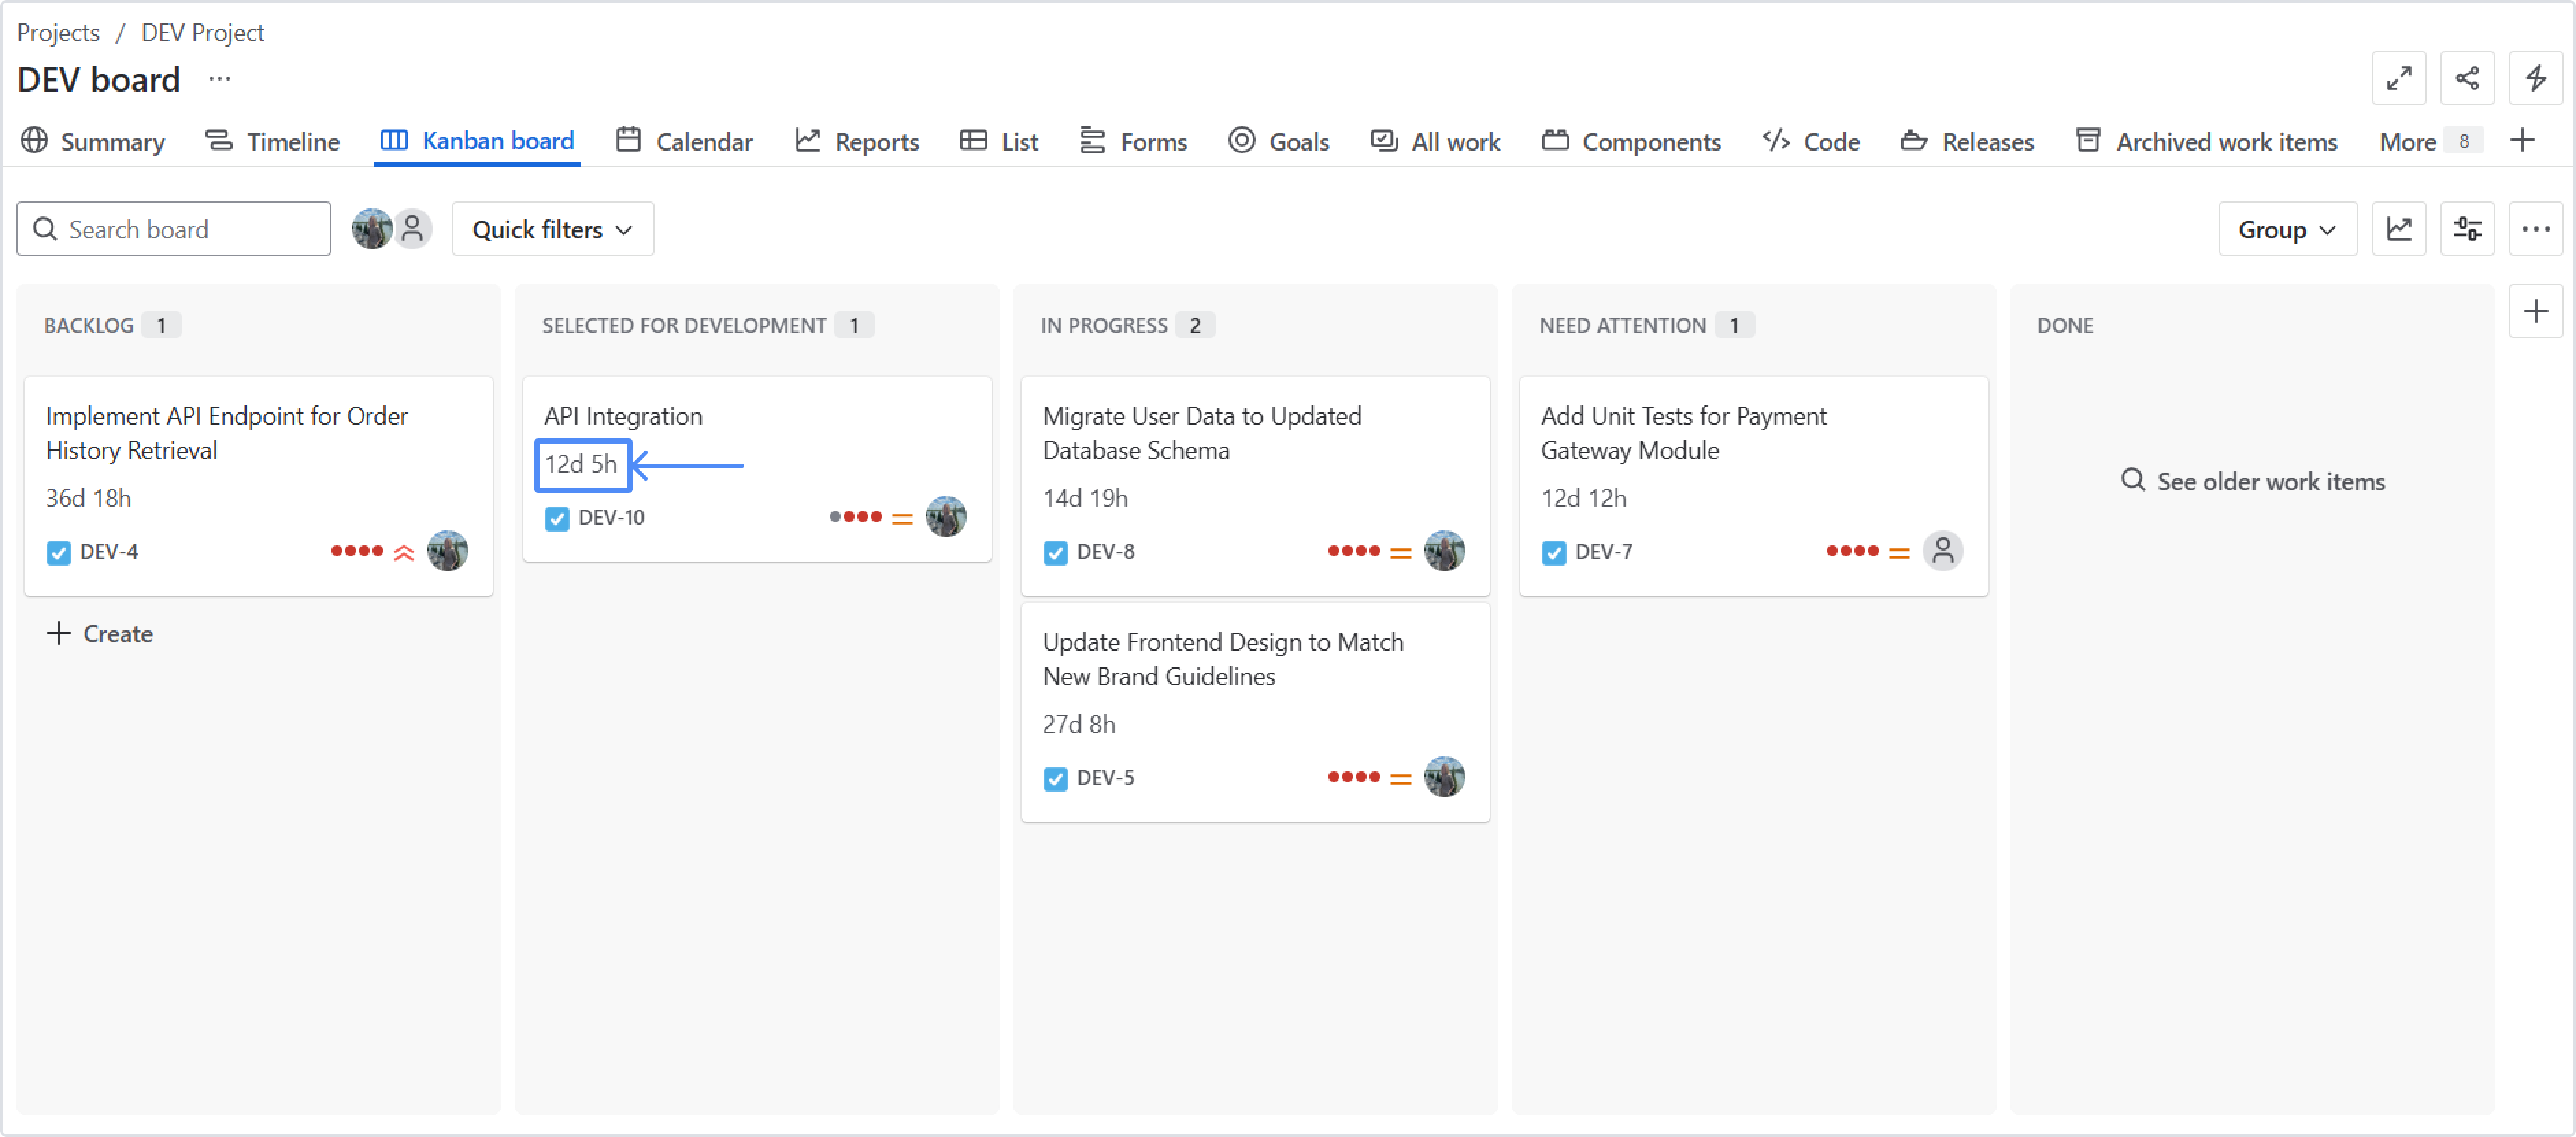
Example Scenario
-
A task stays in Backlog for 8 days and 5 hours before moving to Selected for Development.
-
The recorded time for Backlog remains 8d 5h. If the task returns to Backlog status, the calculation will start from the value 8d 5h.
-
The time for Selected for Development starts at 0 hours and begins accumulating.
-
-
Custom Field Updates
-
The custom field values are updated every hour to reflect the latest accumulated time.
-
The time in the status in the rightmost column is not calculated. This is especially important for Kanban teams, as the constant updating of the field prevents a closed task from “disappearing” from the board.
Sprint Report
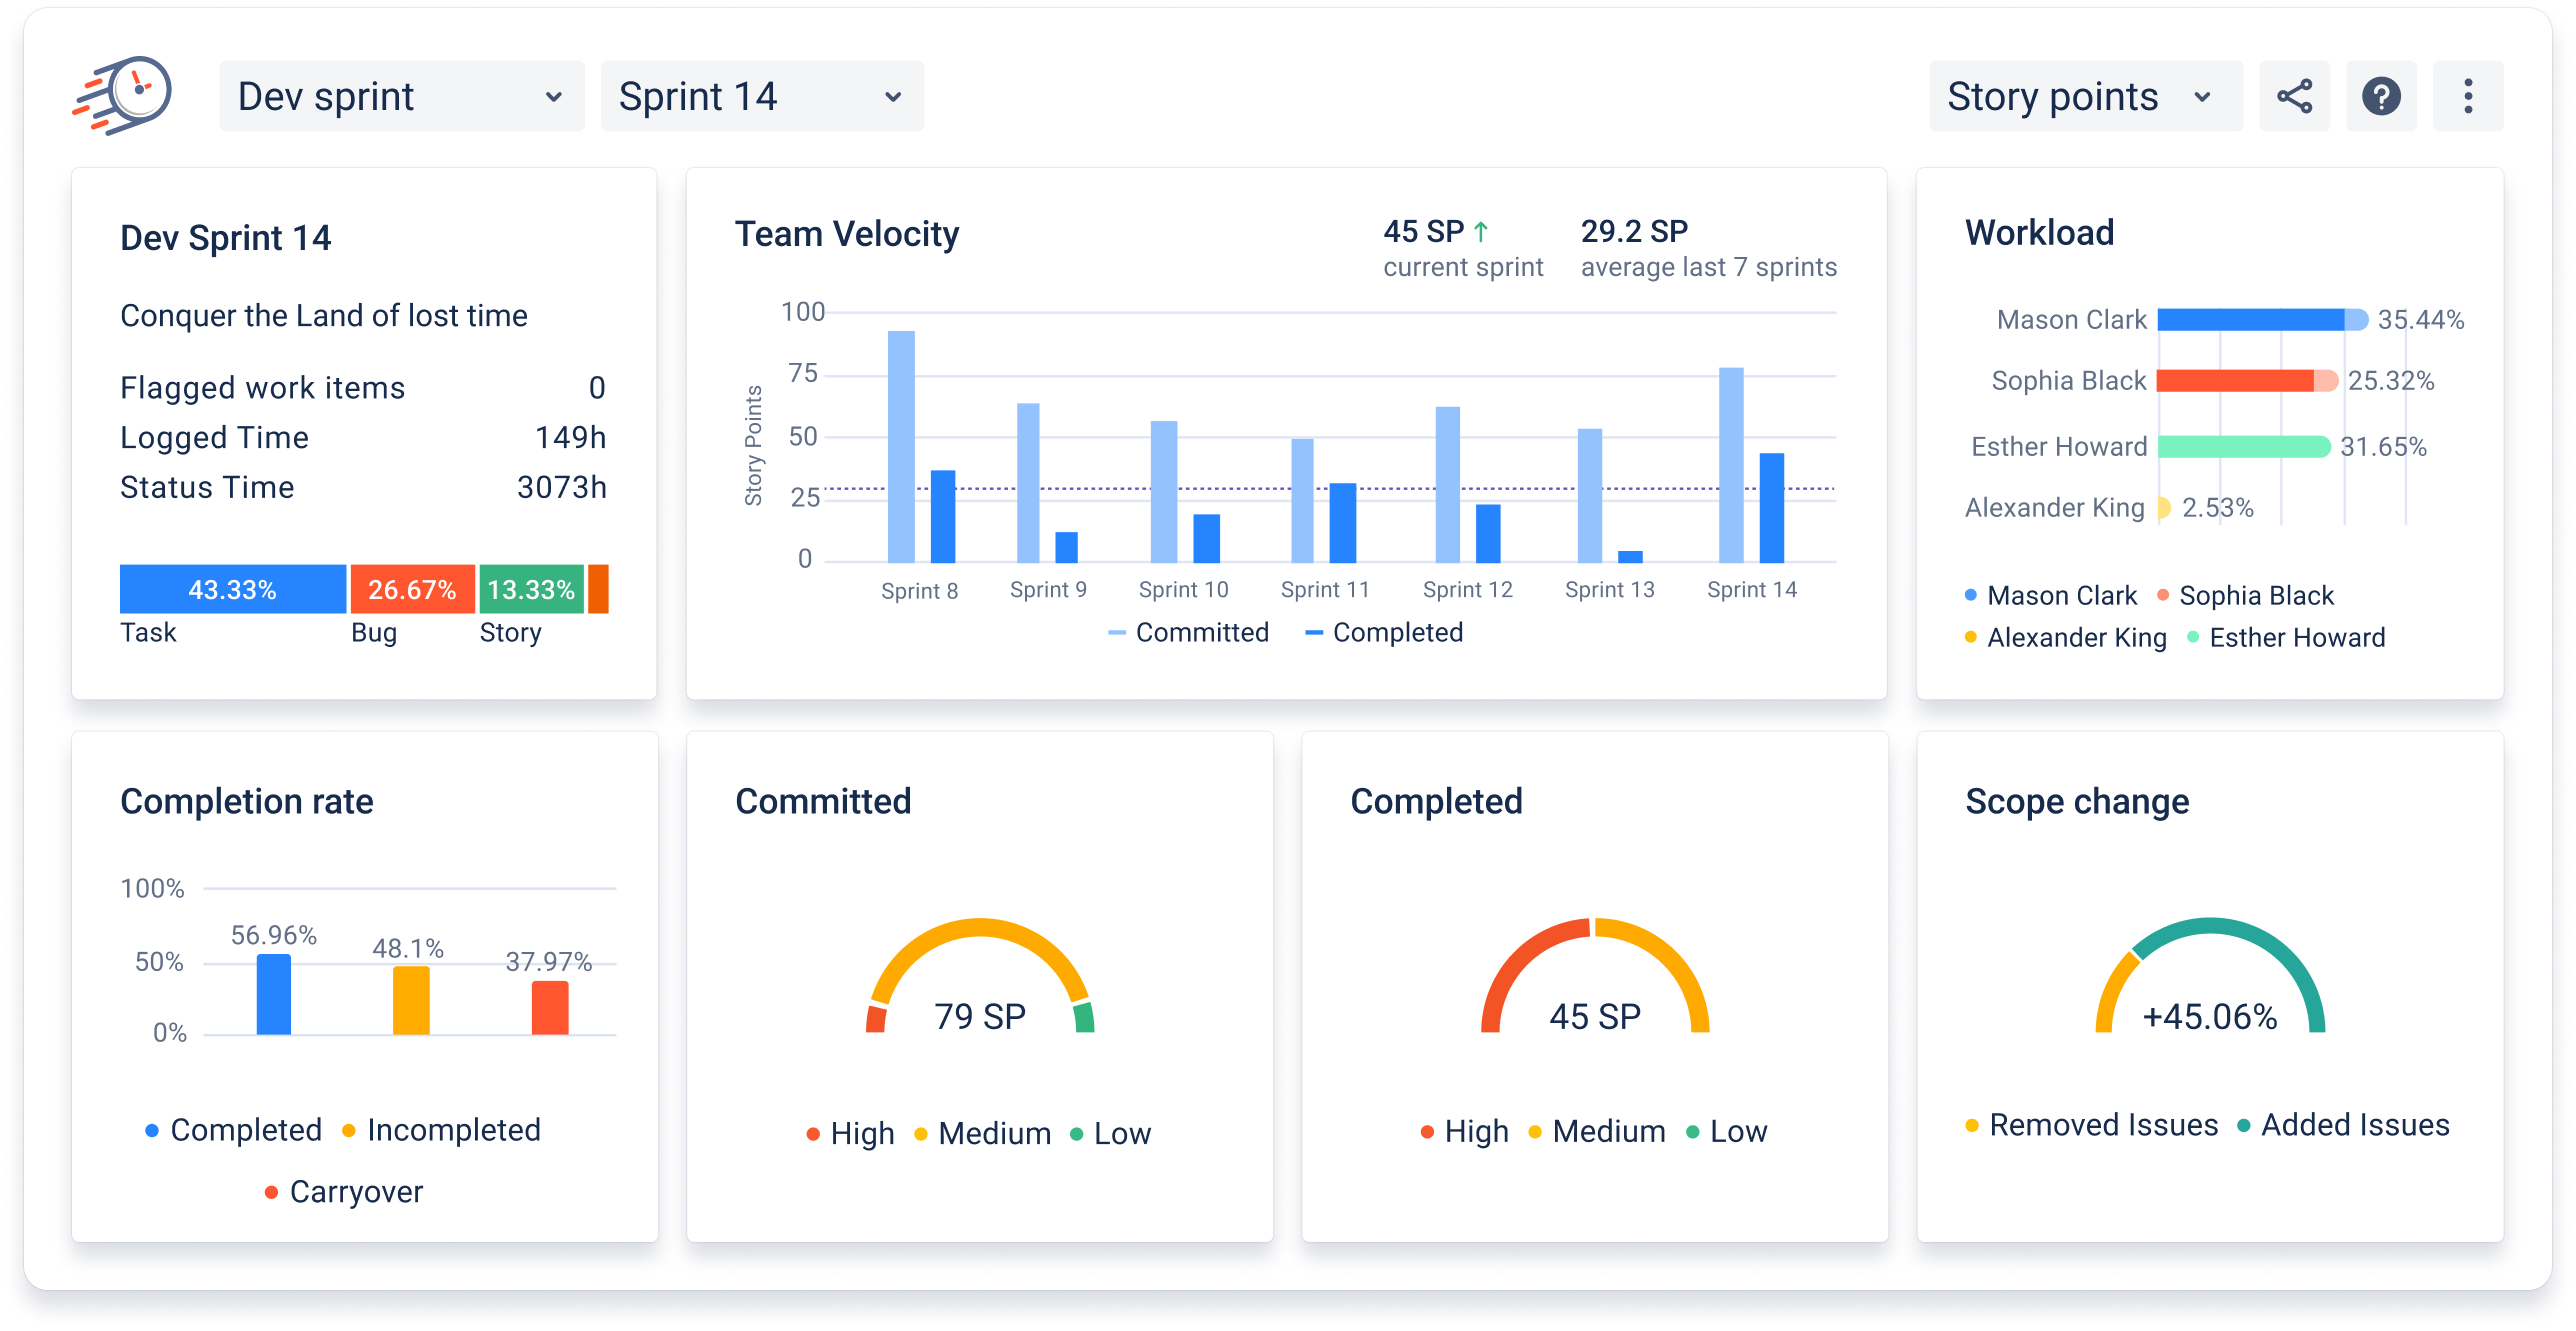
A sprint report includes seven charts with different metrics.
Sprint information
The report calculates the number of flagged work items, the total worklog hours, and the total time each work item has spent in workflow statuses, excluding the first and last statuses, based on a 24/7 calendar.
Also, the sprint structure chart visually represents how the sprint workload is distributed among tasks, stories, sub-tasks, bugs, and technical work items.
Team Velocity
Shows the ratio of committed story points (original time, work item count - it depends on which estimation method is applied to your board) to the number of actually closed story points/work item count/original time. The average value for the last seven sprints is also displayed.
Workload
Committed: Initial workload each assignee commits to at sprint start.
Added: Work assigned during the sprint.
Removed: Work removed during the sprint.
Workload: Total planned tasks for the sprint.
Committed (a) + Added (a) - Removed (a) ) / Total Sprint Commitment * 100
Completion rate
Completed: Tasks finished within the Sprint, meeting the Definition of Done.
(Completed / Committed) × 100
Incompleted: Tasks not finished within the Sprint.
(Incompleted / Committed) × 100
Carryover: Unfinished tasks from the previous Sprint carried into the current one.
(Carryover / Committed) × 100
Committed vs. Completed
Committed: Tasks the team planned to complete within the sprint, excluding those already in the final status at the start. Displays priorities and serves as a reference for sprint goals.
Completed: Tasks successfully finished and marked as done by sprint end. Summarizes accomplishments and helps assess team performance. Displays priorities.
Scope change
Removed work items: work items was removed from the sprint after it started.
Added work items: work items was added to the sprint after it started.
Scope change : (Added - Removed) / Committed * 100
If you need help or want to ask questions, please contact SaaSJet Support or email us at support@saasjet.atlassian.net
Haven’t worked with the add-on yet? Give it a try