Generating a Status Count Report with the Pivot Table
📝 Context: Tracking the number of times an issue has been in specific statuses is crucial for understanding workflow efficiency and identifying bottlenecks. By using the Time in Status app, you can analyze this data to gain insights into your team's performance. |
|---|
🤔 User Problem: Teams need a way to track the number of times an issue has been in specific statuses to understand workflow efficiency, identify bottlenecks, and make data-driven decisions. |
|---|
Follow these steps:
Open the Time in Status app.
Select a Pivot Table view.

3. Then click the Fields button.

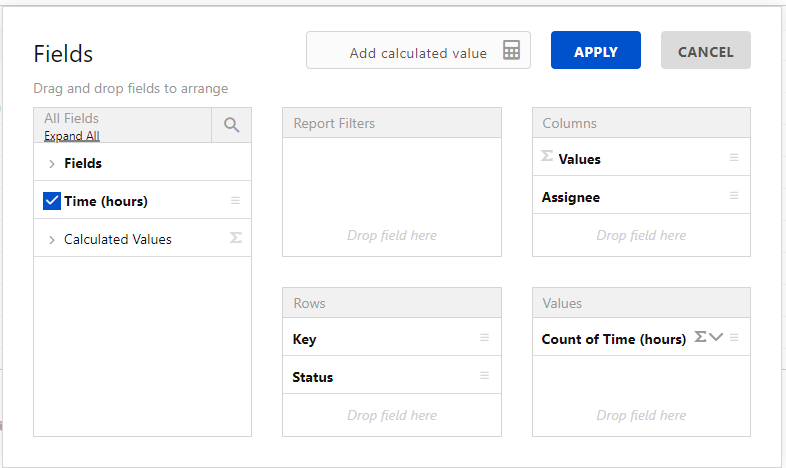
In the Field menu, you can customize data presentation by setting your custom fields for Rows, Columns, Values.
4. To get the time and story points, drag and drop such fields:
Issue Key and Status → Rows
Time (hours) → Values
Assignee → Columns
Choose the Count option in the Values.

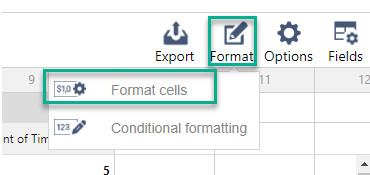
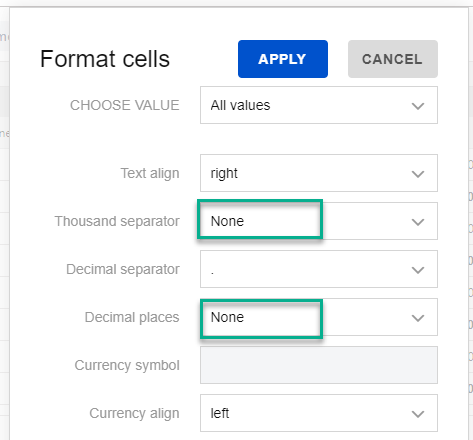
5. “Count of time” (hours) field shows a quantitative indicator (how many times), so set the appropriate format.


For further analysis, export the pivot table to Excel.

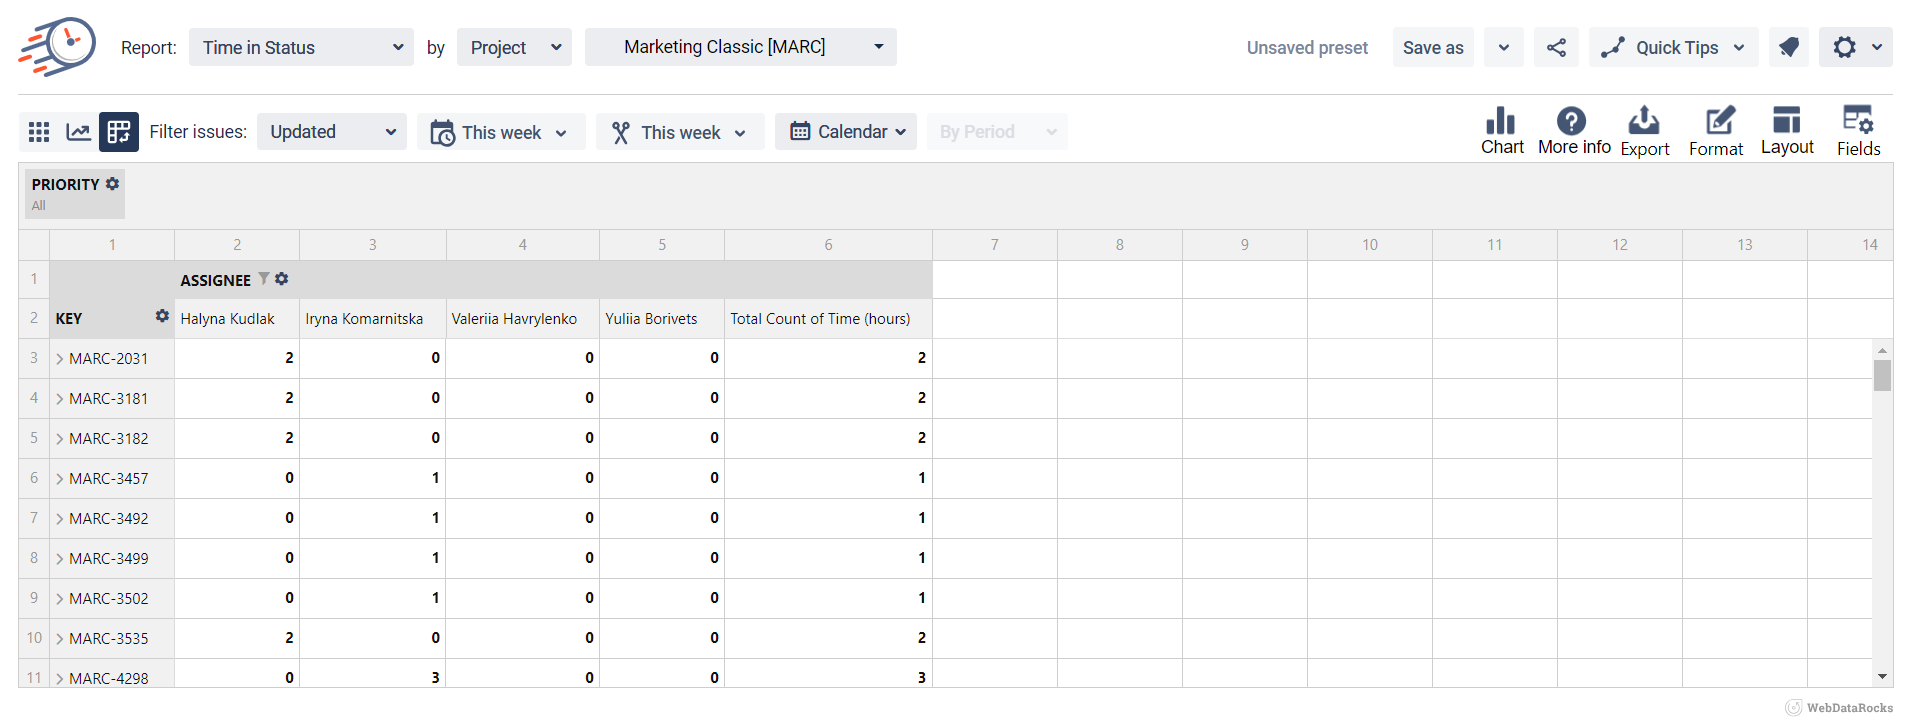
As a result, you’ll get the number of times an issue has been in every status for each assignee.

📈 Outcomes:
|
|---|
If you need help or want to ask questions, please contact SaaSJet Support or email us at support@saasjet.atlassian.net
Haven't used this add-on yet? Try it now!