Average vs. Median Time in Status: Enhancing Workflow
📝 Context: Time tracking is crucial in project management for understanding workflow efficiency and team productivity. This guide dives deeper into Average Time in Status and Median Time in Status, explaining how to use these metrics to improve your team's productivity and workflow efficiency in Jira. |
|---|
🤔 User Problem: Teams need a way to track and analyze the time spent on tasks in different statuses to identify bottlenecks, measure productivity, and optimize workflows. Understanding the differences between Average Time in Status and Median Time in Status can provide valuable insights into project execution and workflow efficiency. |
|---|
Average Time in Status
Average Time in Status is a metric in Jira that measures the average time that issues or tasks are spent in a particular status in your workflow. This metric helps teams understand the typical duration of tasks or issues at each stage and identify potential bottlenecks or inefficiencies.
Average time in status = (Total time spent in status by all tasks) / (Number of tasks)
Let's say you have five tasks in the In Progress status in your Jira workflow. The time each task spent in the In Progress status is as follows: 2 hours, 4 hours, 6 hours, 8 hours, and 10 hours.
To calculate the average time spent in a status:
Add up the time spent in In Progress for all tasks: 2 + 4 + 6 + 8 + 10 = 30 hours
Divide the total time by the number of tasks: 30 hours / 5 tasks = 6 hours
The average time spent in the In Progress status is 6 hours.
Median Time in Status
Median Time in Status is a metric in Jira that represents the middle value of the time spent by issues or tasks in a particular status within your workflow. This metric helps teams identify the typical duration of tasks or issues in each stage, providing a more accurate representation of workflow efficiency when there are outliers or skewed data.
To calculate the Median Time in Status, you need to follow these steps:
List the time spent by all issues in a specific status in ascending order.
If there is an odd number of issues, the median is the middle value.
If there is an even number of issues, the median is the average of the two middle values.
Let's say you have seven tasks that have gone through the "In Review" status in your Jira workflow. The time spent in the "In Review" status for each task is as follows: 1 hour, 2 hours, 3 hours, 4 hours, 5 hours, 9 hours, and 15 hours.
To calculate the Median Time in Status:
Arrange the time spent in the "In Review" status in ascending order: 1, 2, 3, 4, 5, 9, and 15 hours.
Since there are seven tasks (an odd number), the median is the middle value, and the 4th value in the sorted list is 4 hours.
So, the Median Time in Status for the "In Review" status is 4 hours.
Comparing Average Time in Status and Median Time in Status
As you can see, these metrics cannot exist without each other. Or rather, they can, but using both is the key to cleaner results.
Below is a comparison table between Average and Median based on different criteria, highlighting their strengths and weaknesses. Teams working in Jira can use this table to determine which metric is more appropriate for their specific context and data distribution. In many cases, using both metrics can provide additional insights into project execution and workflow efficiency.
Criteria | Average Time in Status | Median Time in Status |
Representation of dataset | It takes into account every value, providing a comprehensive view | Focuses on the middle value, providing a typical value representation |
Symmetrical distributions | A good representation of central tendency in normal or symmetrical distributions | Less relevant for symmetrical distributions |
Resistance to outliers | Sensitive to extreme values, which can distort the average | More robust against outliers, providing a more accurate typical value |
Ease of calculation and understanding | Requires summing and dividing, which may be less intuitive | It is simpler to calculate and understand; it only requires sorting and finding the middle value |
Skewed data | Less suitable for skewed distributions, as it can be pulled toward extreme values | Better representation of central tendency in skewed distributions |
Complementary insights | It can be used together with the median for a more comprehensive understanding of the dataset | It can be used together with the average for a more comprehensive understanding of the dataset |
Use Case for Average Time in Status Metric
The Average can be a helpful metric when measuring team productivity, especially if individual productivity is relatively similar. By summing up the productivity of each team member and dividing by the total number of team members, you get a complete picture of the overall team productivity.
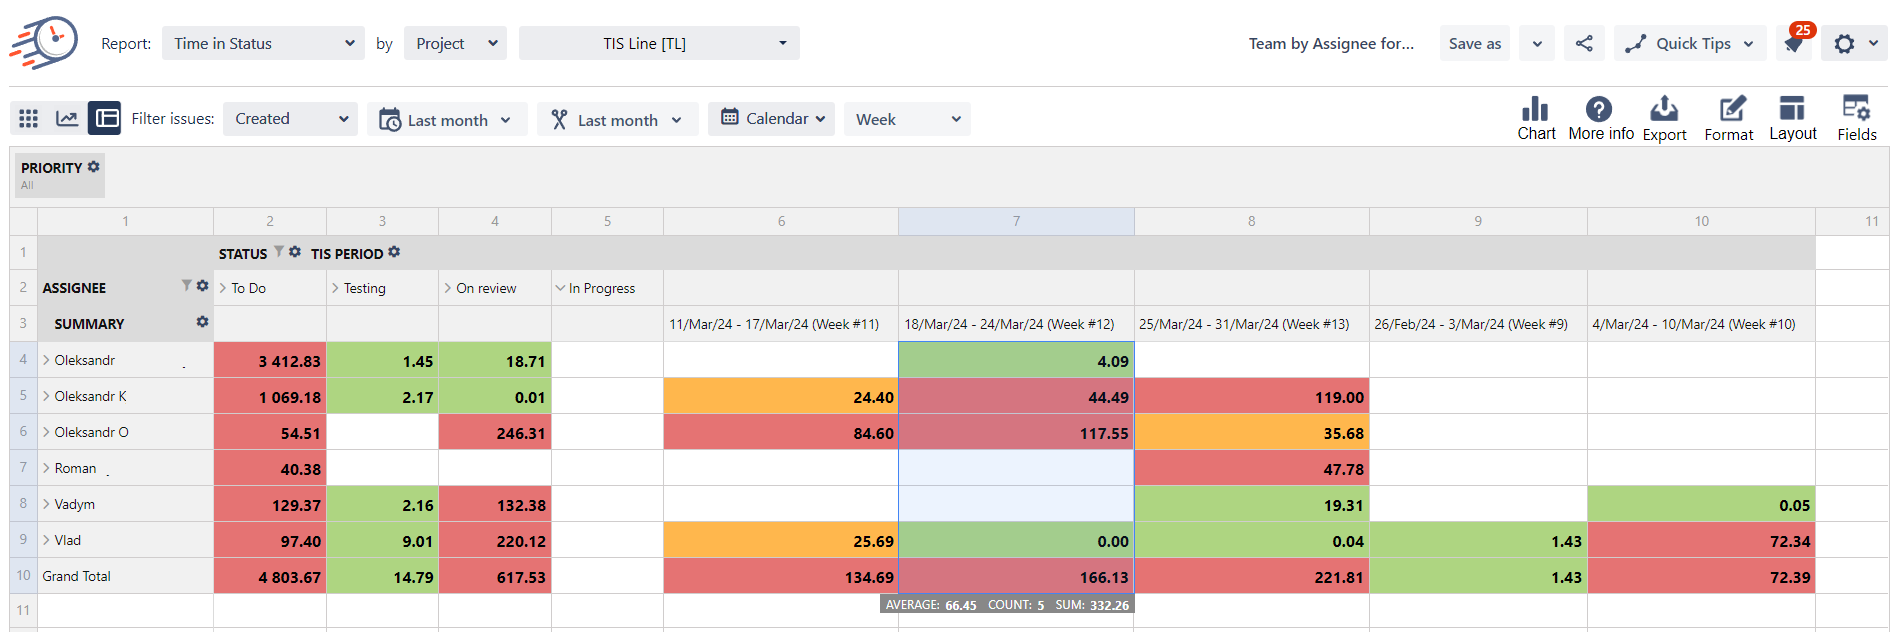
For example, using the Pivot view, you can estimate the average value of the In Progress status by period (week, month, day, etc.). Thus, you will see how the average time of tasks in the In Progress status changes by period for each team member and the whole team.

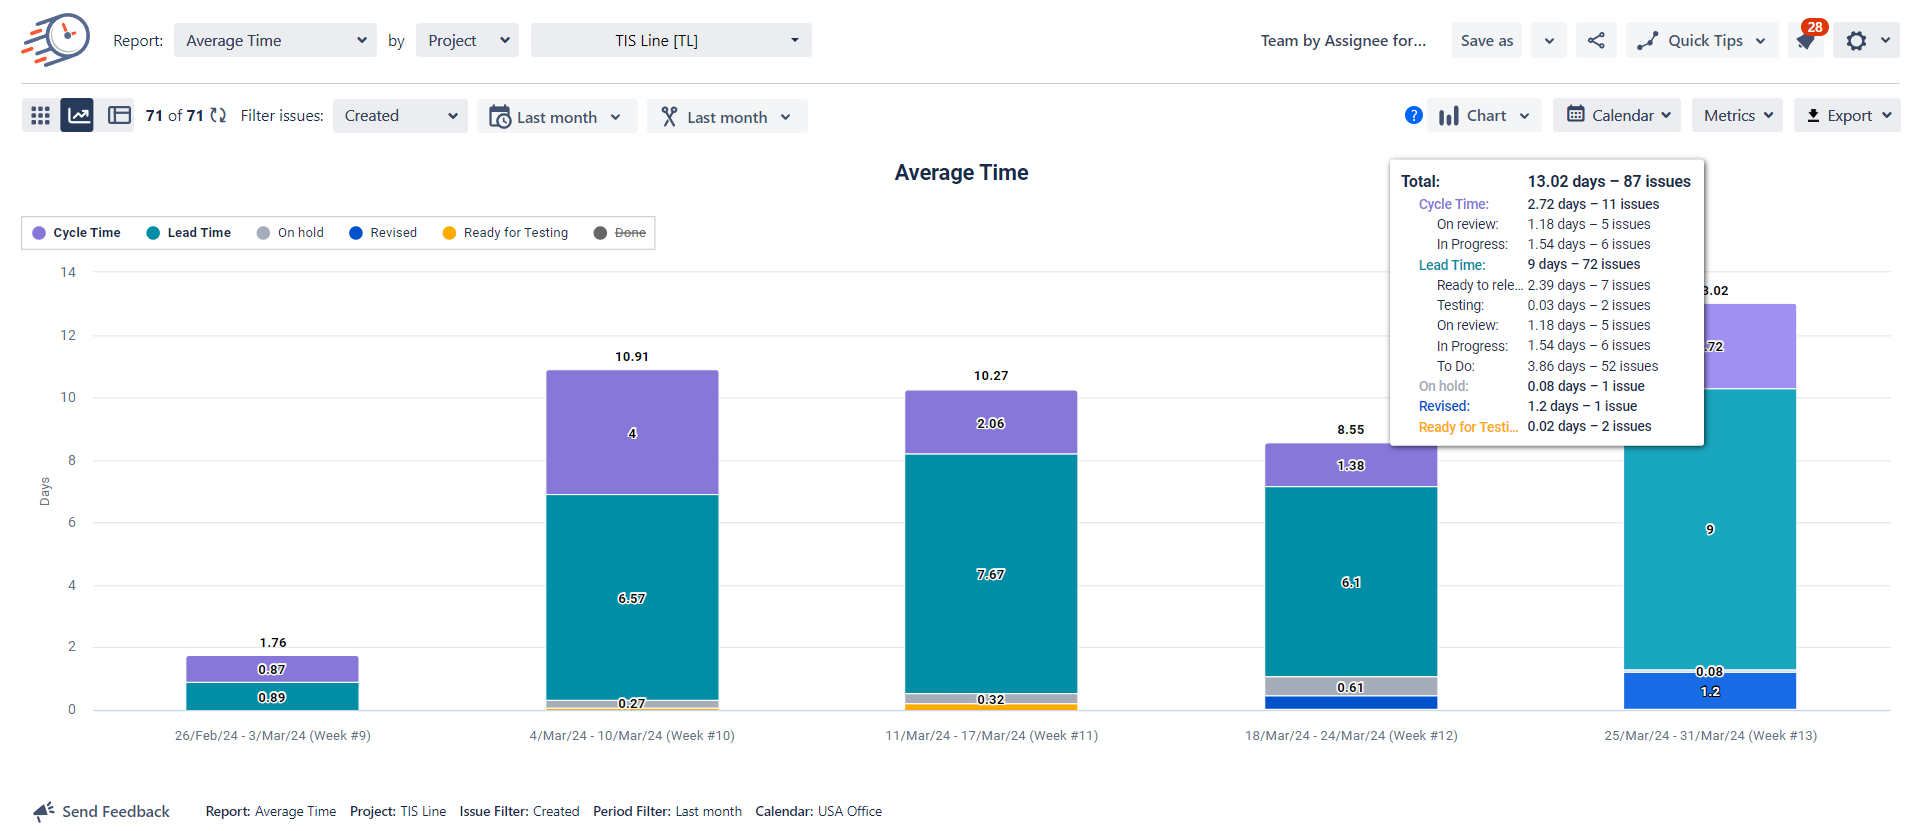
Or, using the Average Time in Status report in the grid view, you can see the average values for the team's statuses as a whole. And with the help of pre-created Status Groups, you can see how the indicators of various time metrics, such as Lead and Cycle time, have changed.

You can also visualize all these indicators using a chart to get a better picture and make informed decisions about improving workflow.

Use case for Median Time in Status Metric
Median Time in Status can be used to compare the performance of different teams or team members within a Jira project. By comparing the median time, managers can identify high-performing teams or individuals, share best practices, and identify areas where additional support or training may be needed.
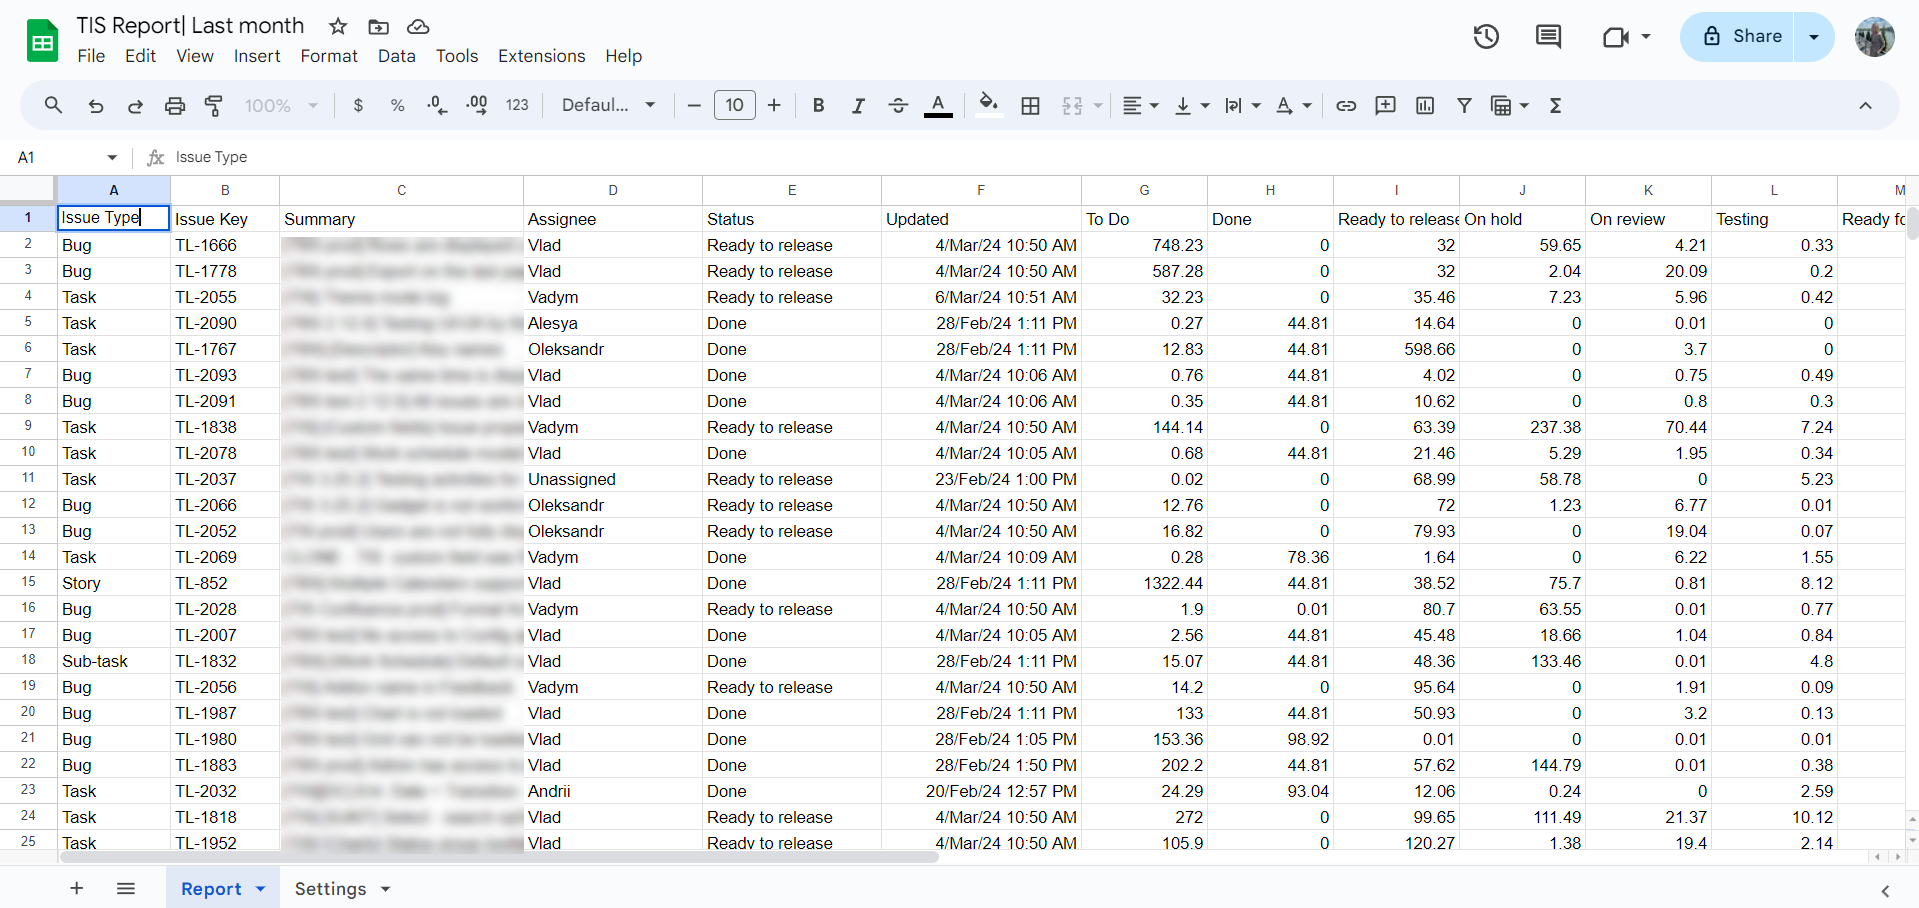
By uploading reports using Data Feed, you can distribute them to Google Spreadsheets and calculate the median using the built-in functions.
Exporting reports to Spreadsheets is a great way to share them with external users.

📈 Outcomes:
|
|---|
If you need help or want to ask questions, please contact SaaSJet Support or email us at support@saasjet.atlassian.net
Haven't used this add-on yet? Try it now!