
Time in Status Gadget is a Jira dashboard gadget that allows you to monitor customized app reports directly on your dashboard. All app reports are available in this gadget, and you can analyze Time in Status data using either the Work Item List or Chart View.
How to install gadget on dashboard
As part of the migration to Forge, you must update the app to the latest version. If your app was installed before the latest release, please follow the update instructions.
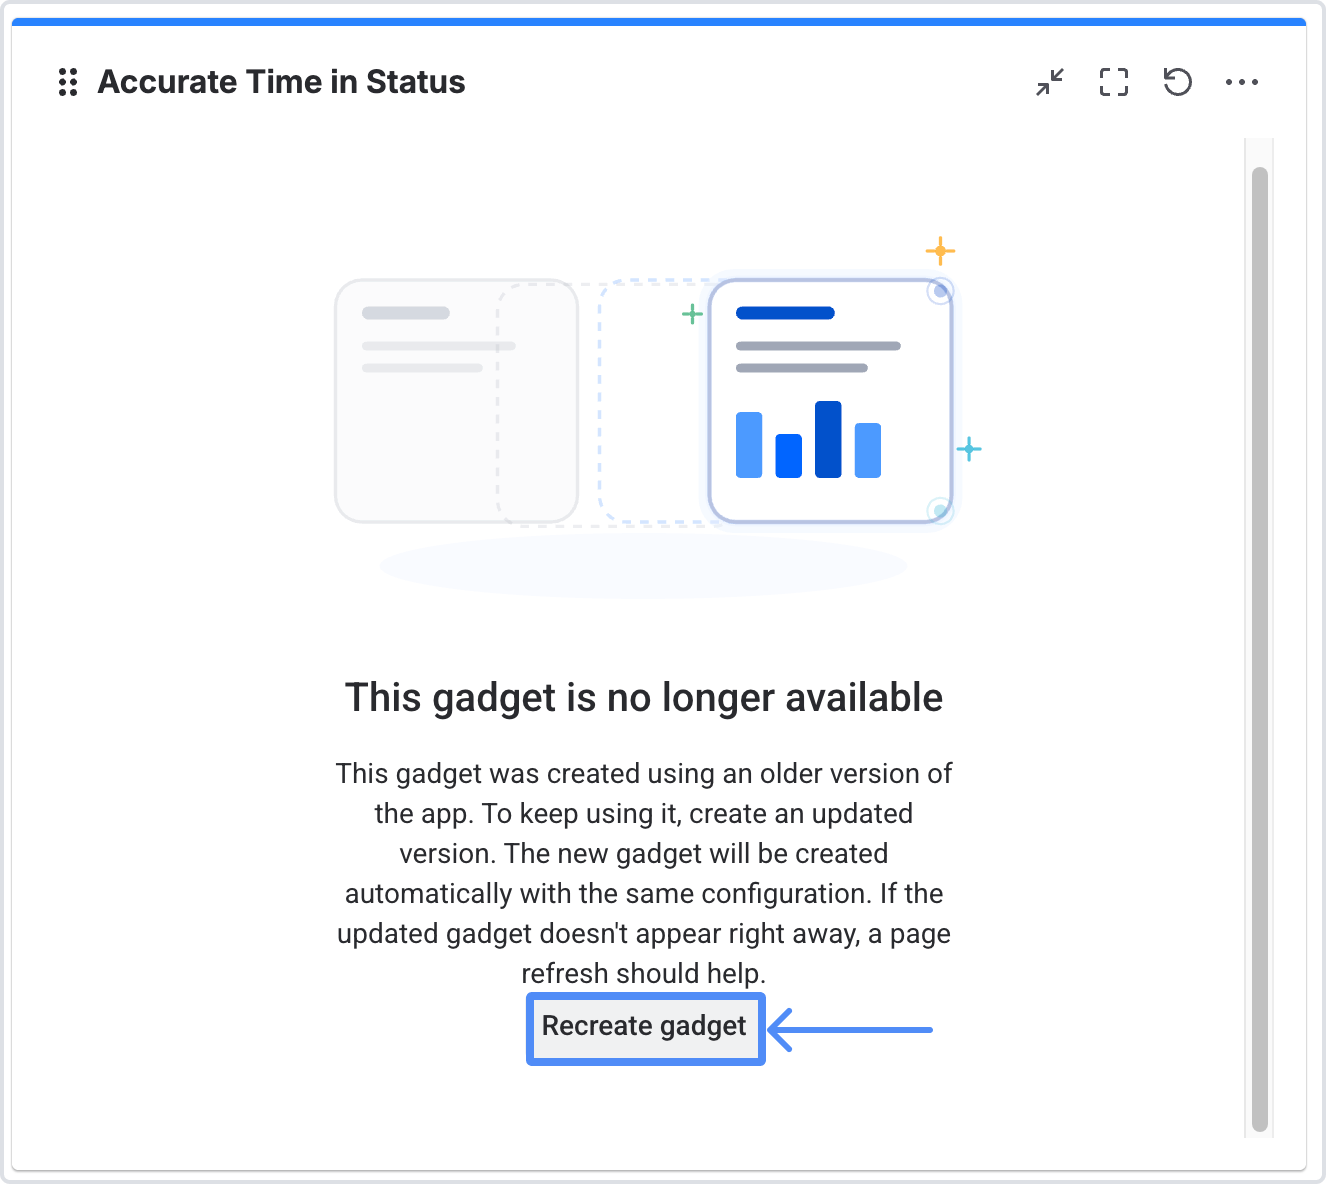
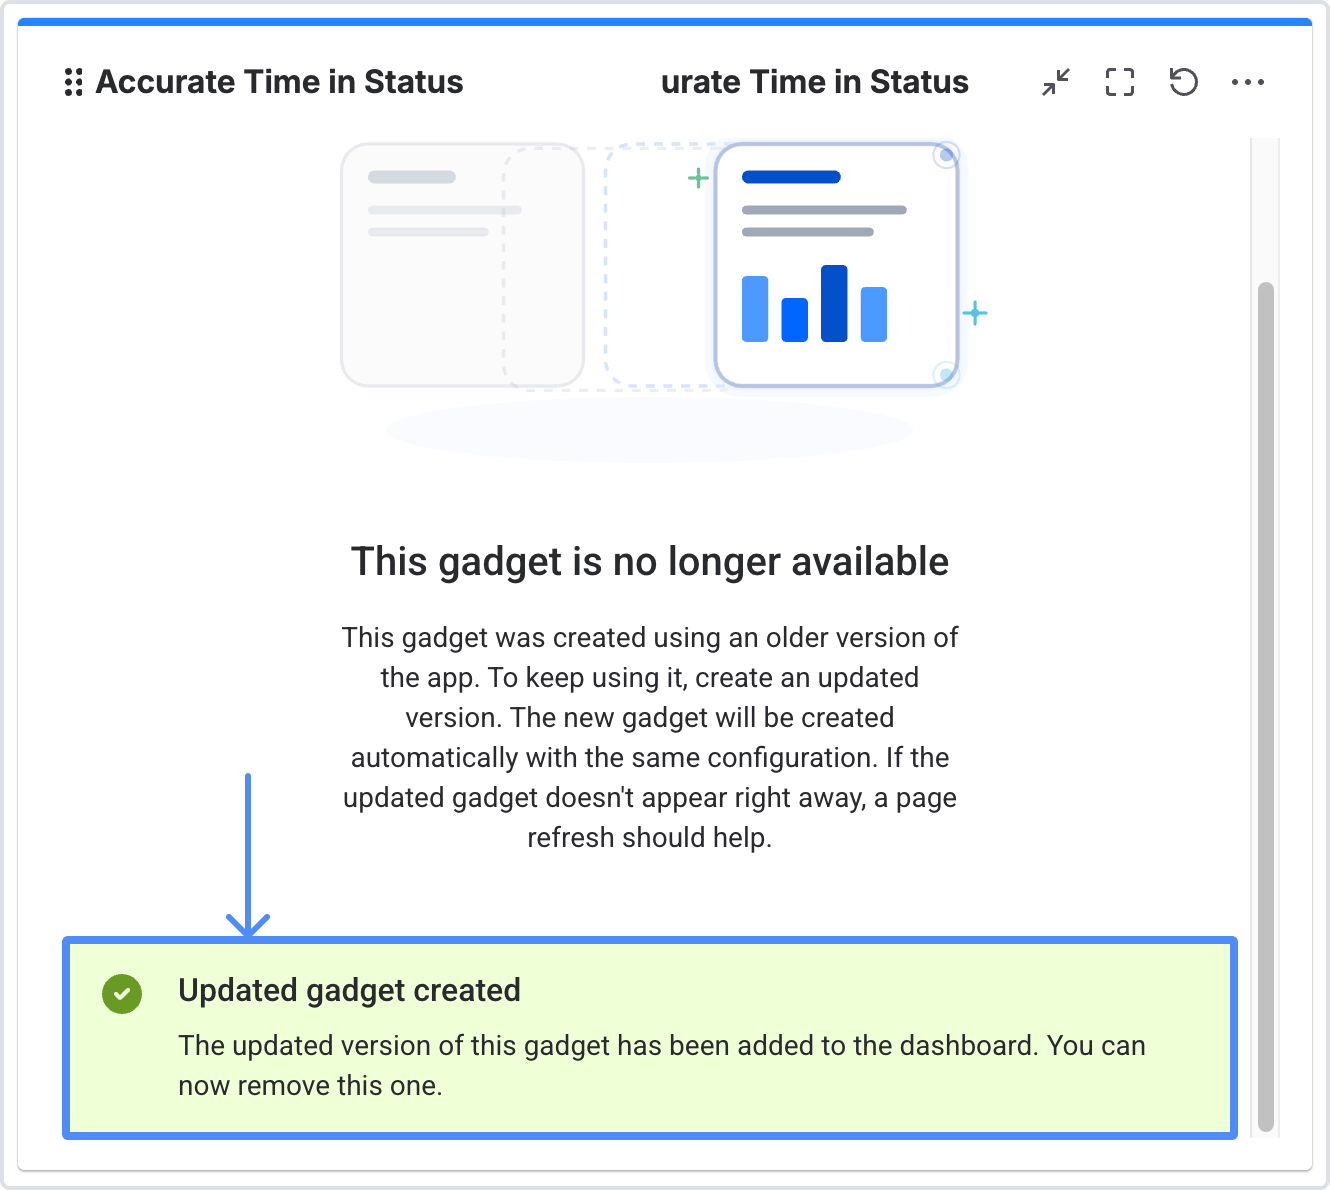
If you installed the app before March 18, 2026 and previously created gadgets, the older gadget versions will no longer be available. In this case, the app will offer to recreate them.
-
In Jira, go to Dashboards.
-
Create a new dashboard or select an existing one.
-
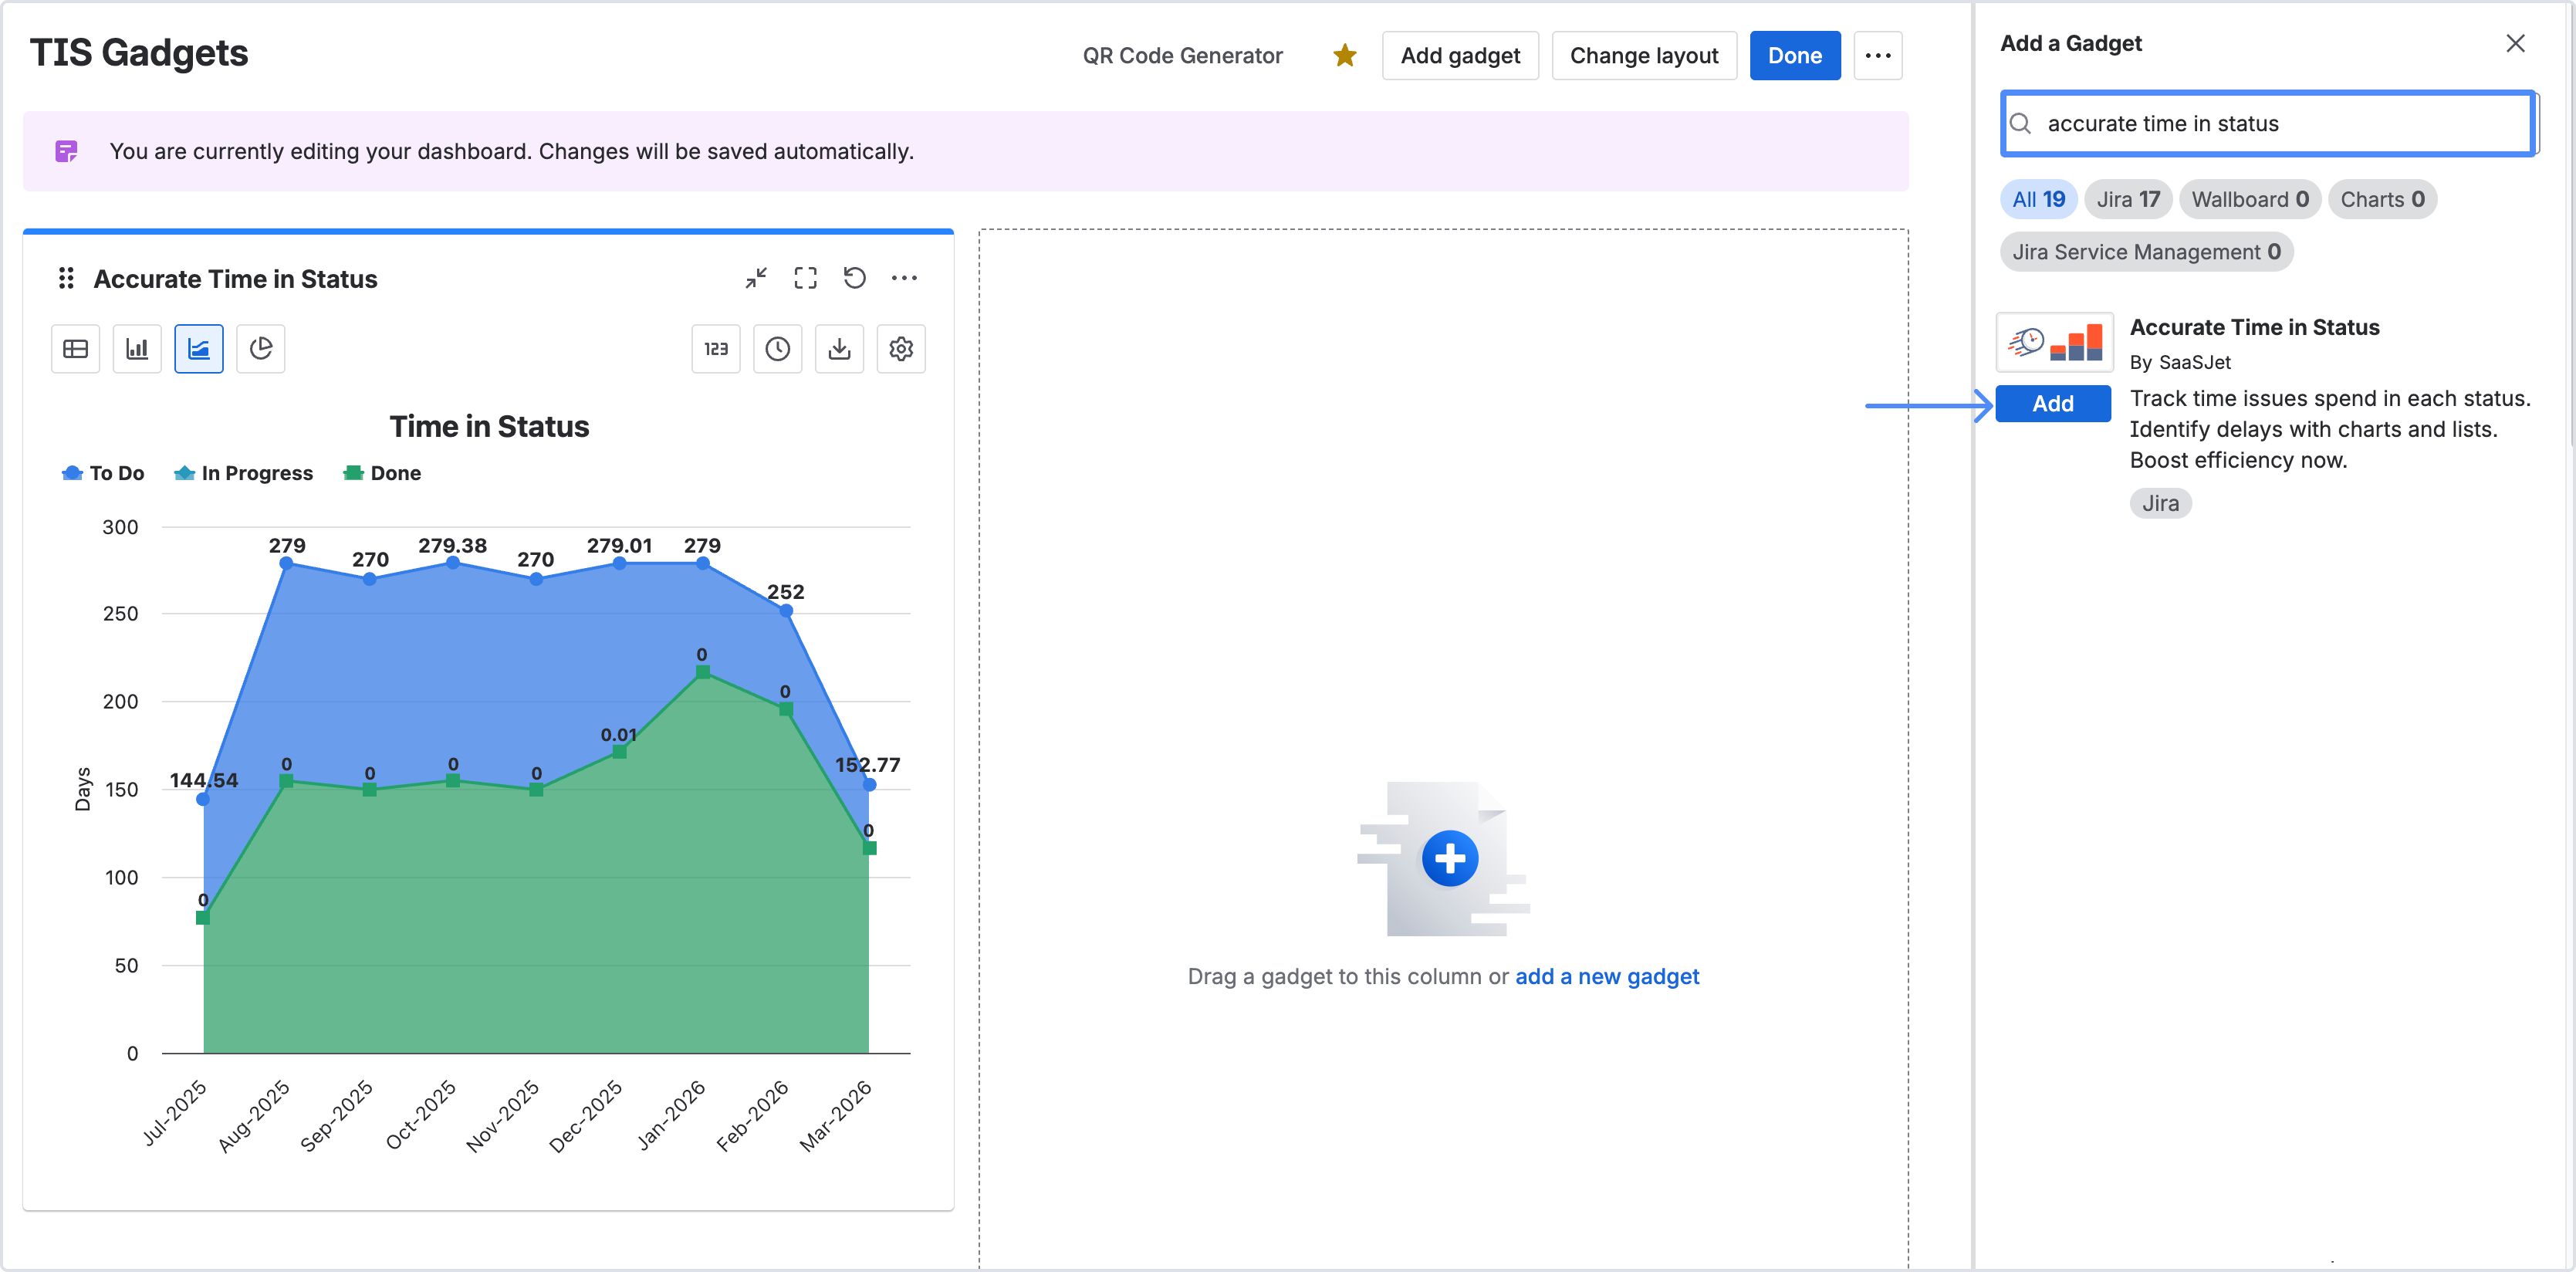
Click the Add gadget button on the dashboard.
-
Write "Accurate time in status" in the search box.
-
Select Accurate Time in Status (by SaaSJet) at the search results.
-
Click the Add gadget button.
-
You're all set!👍
-
Once you added the gadgets, close the Add a gadget screen and continue by entering the gadget settings. See the instructions below to configure the gadgets.
How to use
First of all, you need to configure the gadget by the following settings to view the data in the dashboard.
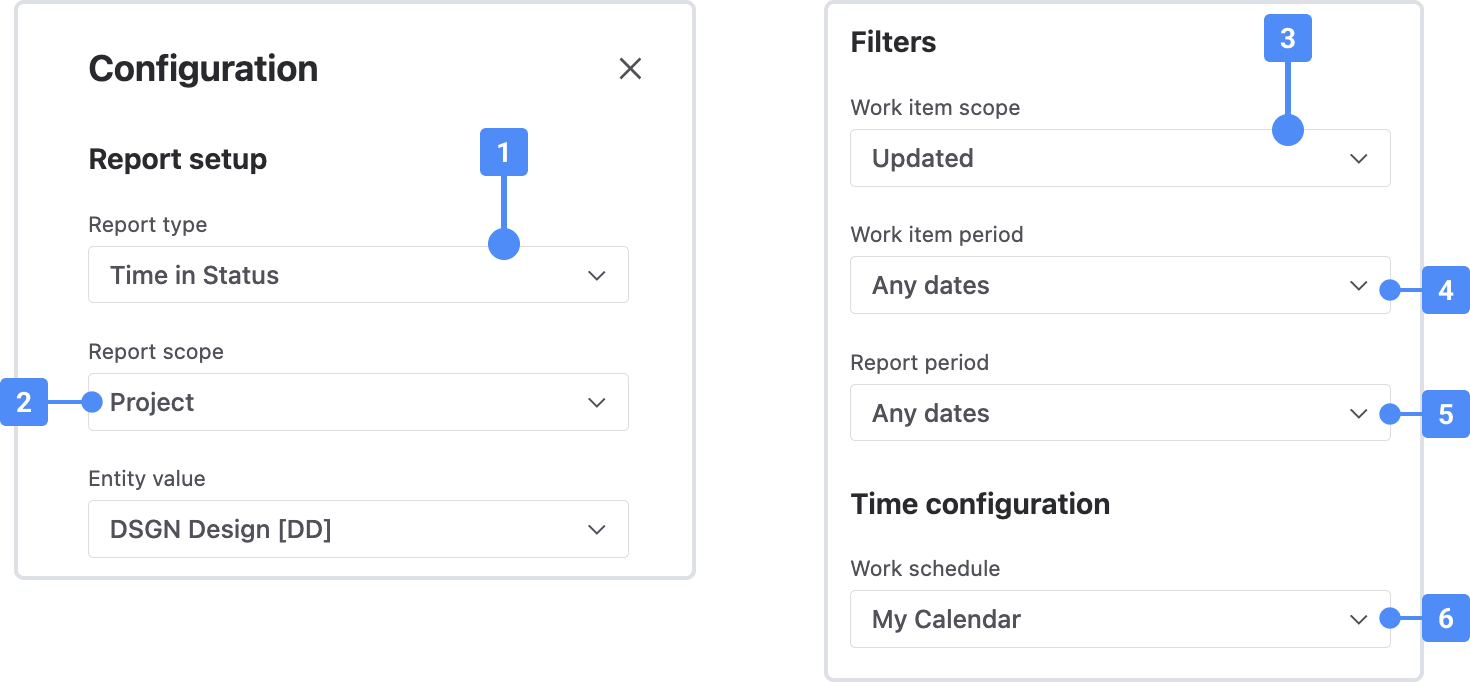
In Gadget сonfiguration you can set:
-
Type of reports (Time in Status, Assignee Time, Average Time, Status Entrance Date, Time in Status per Date, Status Count, and Transition Count). More information about reports here.
-
Choose how to get the work item list filtering data by Assignee, Filter, Label, Project, Reporter or Sprint and specify search details.
3-5. Use the functionality of Work item and Report periods to customize report timeframes.
-
Select a Work schedule to exclude non-working days and non-working hours from the calculation.
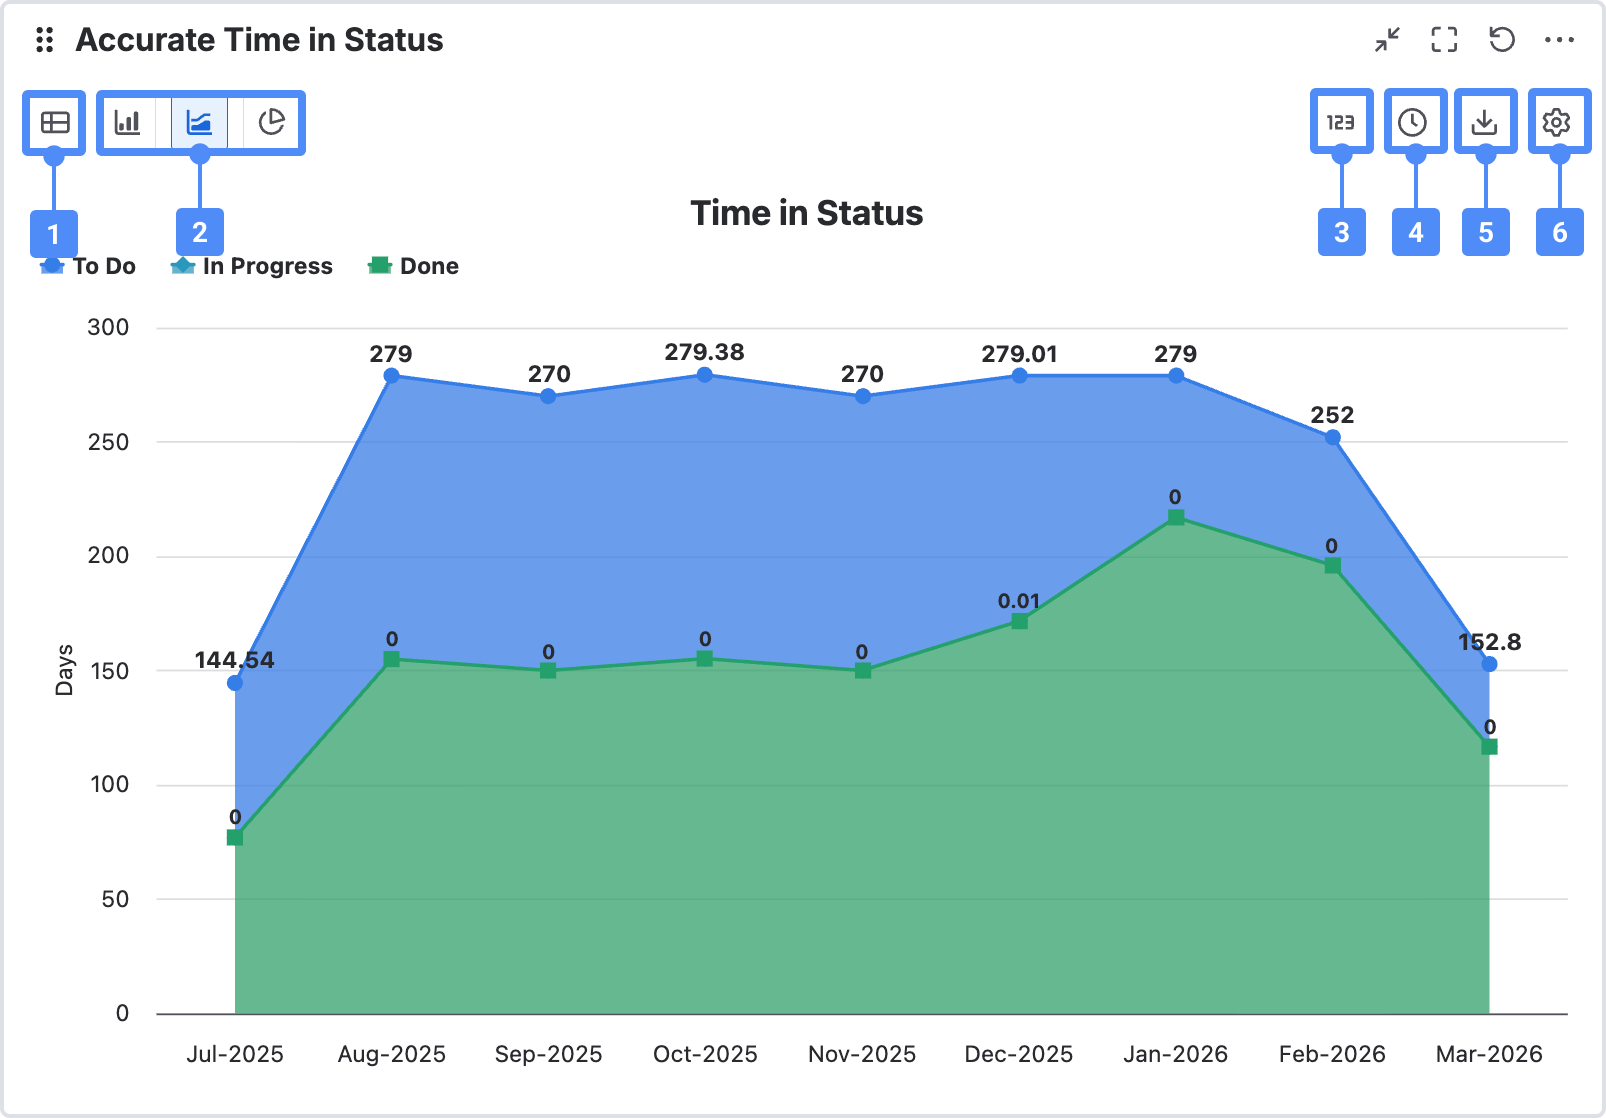
Once the configuration is complete, the gadget will be created. You will then see additional options for customizing its appearance and the way data is displayed.
1–2. Select the view type: Table or Chart (Column, Area, or Pie).
-
Choose the data format.
-
Select time intervals (Chart view only).
-
Export the data.
-
Open the gadget configuration menu.
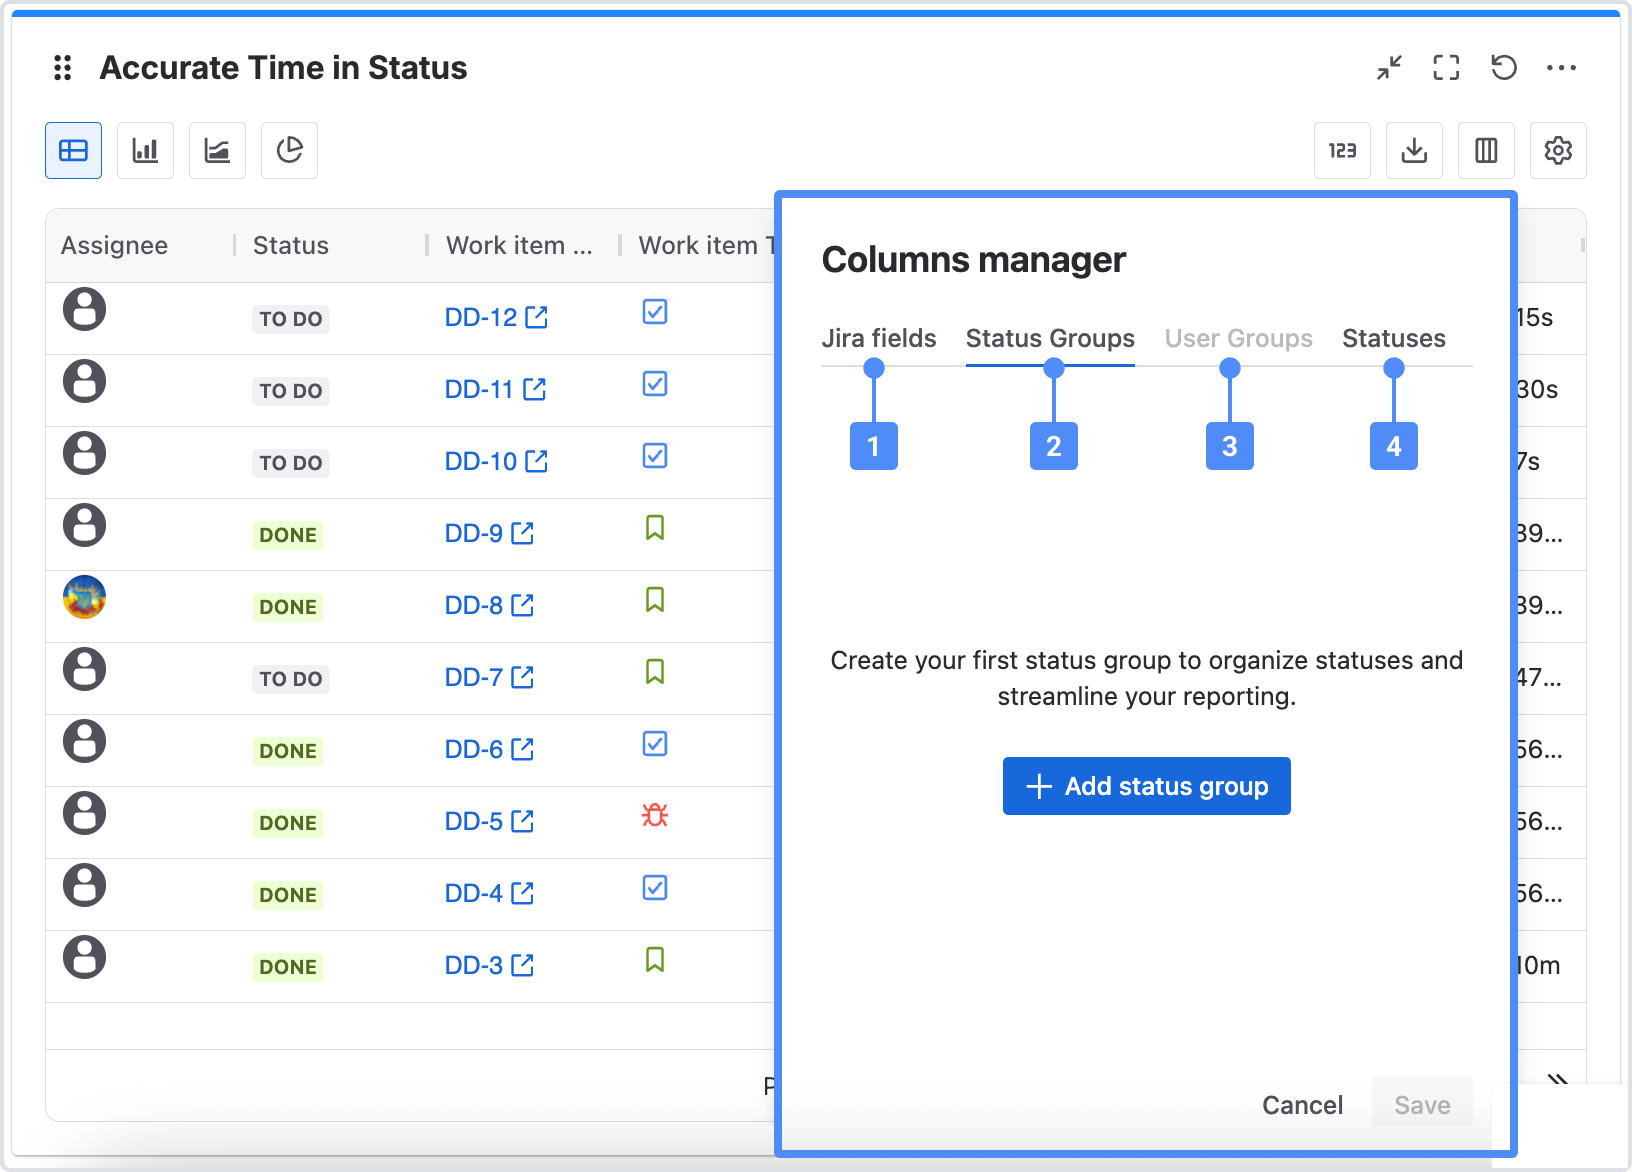
In Table view, use the Columns manager to customize the table layout.
-
Add or remove specific Jira fields.
-
Create or edit a status groups to calculate a specific time metric.
-
Create or edit a user groups (only for the Time in Assignee report).
-
Add or remove specific Jira statuses.
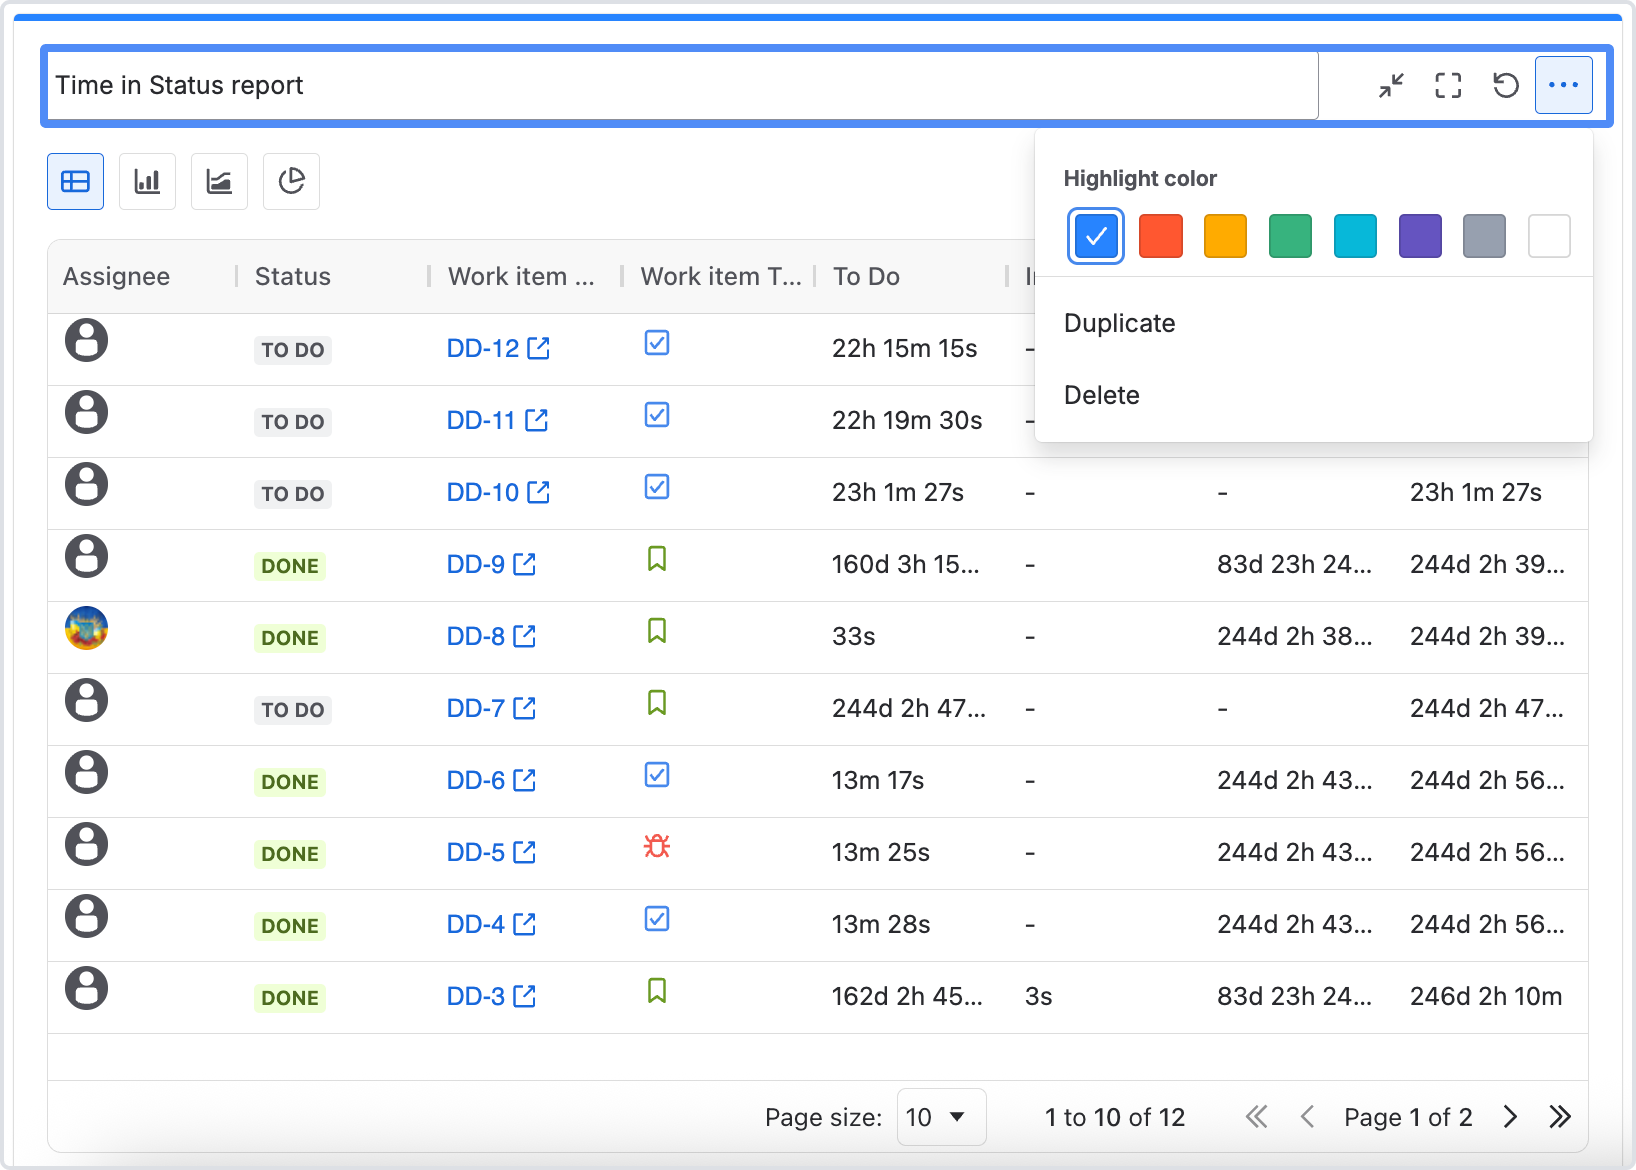
To finish configuring the gadget display, you can rename the report shown on the Jira dashboard, set an accent color, and duplicate or delete the gadget.
If you need help or want to ask questions, please contact SaaSJet Support or email us at support@saasjet.atlassian.net
Haven't used this add-on yet? Try it now