
|
📝 Context: Estimating the development team’s efforts during a sprint is crucial for understanding productivity and workload distribution. Using the Time in Status app, you can analyze which developers closed the most story points and how much time each issue spent in progress. |
|---|
|
🤔 User Problem: Teams need a way to estimate the development team’s efforts during a sprint to understand productivity, identify bottlenecks, and make data-driven decisions. |
|---|
Steps to configure:
-
Open the Time in Status app.
-
Select a Pivot Table view.
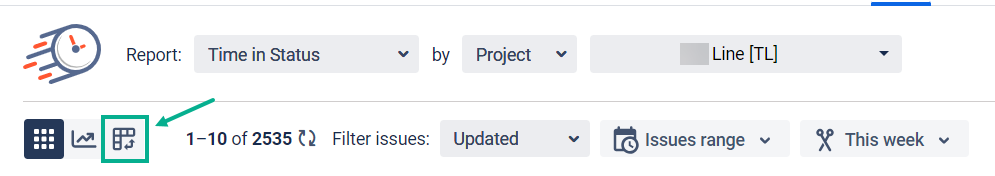
3. Choose the Time in Status report and the required Sprint.
.png?cb=64b0c50b859fb681fb27df12917612d5)
4. Then click the Field button.

In the Field menu, you can customize data presentation by setting your custom fields for Rows, Columns, Values.
5. To get the time and story points, drag and drop such fields:
-
Assignee, Issue Key, and Story Points → Rows
-
Time (hours) → Values
-
Status → Columns
6. Select the Sum option in the Values drop-down menu.
7. Click the gear to filter statuses when assignees are working on issues, according to your workflow, and apply it. Lets’ take “In Progress” as an example.
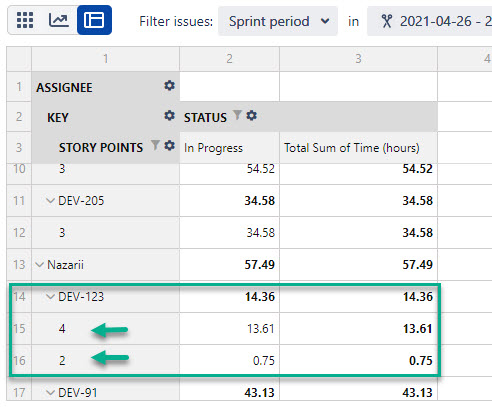
8. You can uncheck issues with blank and 0 estimations to get only the evaluated ones.
9. If an issue has been revalued, you will get the original estimation separately.
10. To move away total and subtotal values, go to the Options menu and apply:
-
Do not show grand totals ;
-
Do not show subtotals ;
-
Classic form ON.
As a result, you will get the time in progress and story points for each assignee.
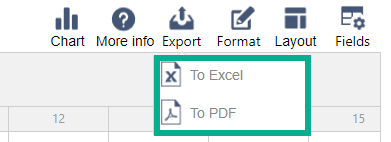
11. For further analysis, export the pivot table to Excel.
-
Remove the revalued estimate and leave the original one.
-
Sum up the story points and time for each assignee.
Now, you can compare how much time each team member has spent on issues and how many story points are closed.
|
📈 Outcomes:
|
|---|
If you need help or want to ask questions, please contact SaaSJet Support or email us at support@saasjet.atlassian.net
Haven't used this add-on yet? Try it now!