
On this page, you can find more details about Time in Status releases, the steps needed to access and start using new features, and our plans for upcoming improvements.
Have ideas for new features? We’d love to hear them. Please submit your request through our Support portal, and we’ll get back to you as soon as possible.
|
Date |
Release Notes |
What should I do? |
|---|---|---|
|
soon |
Introducing the New Pivot Mode
✨ A New Reporting Experience We're launching the new Pivot Mode, delivering a more modern and flexible way to analyze your Time in Status data. What happens to existing Pivot Reports? No action is required.
We encourage you to start exploring the new Pivot Mode and take advantage of its enhanced reporting capabilities while continuing to use your existing reports as needed. |
- |
Major New Features
🔄 Migration Support is Here We're excited to announce expanded migration capabilities for Time in Status:
These options make it easier to move your Time in Status data when changing Jira environments. 📄 Time in Status Reports for Confluence You can now bring Time in Status reports directly into Confluence pages. Share insights and provide stakeholders with up-to-date reporting without leaving Confluence. |
Cloud → Cloud migrations can be enabled upon request by contacting our support team. |
|
Improvements & Enhancements
🔄 Refresh Report Data You can now refresh report data directly from the report view to ensure you're always working with the latest information. 💾 Save Table Preferences Time in Status now remembers and saves your table configuration, including:
This allows you to maintain your preferred report layout between sessions. Legacy Pivot Preset Protection To prepare for the upcoming reporting changes, new presets based on legacy Pivot Reports can no longer be created. Existing pivot-based presets remain fully functional and can still be used and modified. |
- |
|
|
Pivot Reports Transition Notice We've added a banner to all Pivot Reports to inform users that the current pivot experience will be replaced by a new reporting solution. Existing functionality remains available, and we'll continue to share updates as we get closer to the transition. 🚀 New Onboarding Assistant Getting started with Time in Status is now easier than ever. We've introduced an in-app Onboarding Assistant that guides new users through key features, helping them set up reports and discover the app's capabilities more quickly. |
- |
|
|
Column Filters — Narrow Report Results Without Changing Your Configuration With Column Filters you can:
Supported Filter Types
How it works
✅ No report reconfiguration needed ✅ Multi-column filtering ✅ Works in expanded and collapsed group views ✅ Active filters persist until cleared |
- |
|
|
🚀 Column Groups — Smarter Report Analysis Organize report columns into logical groups like Statuses, Users, and Jira Fields for a cleaner, easier-to-read report view. With Column Groups you can:
Available in
Supported Groups
Key Benefits
✅ Cleaner report layout
|
- |
|
|
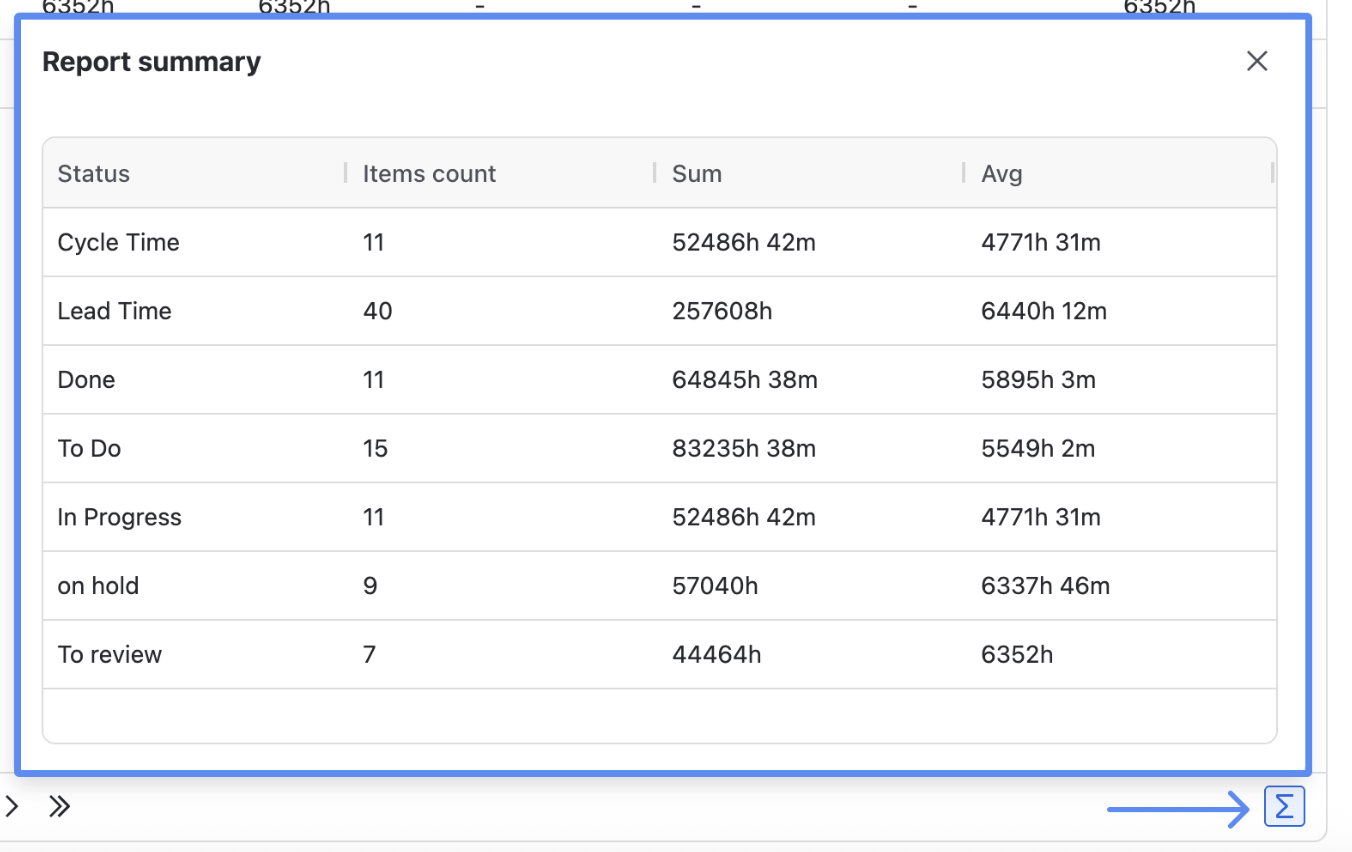
✨ New: Status Summary across multiple reports Status Summary is now available for Time in Status, Status Count, Time in Assignee, and Transition Count reports.
With this update, you can now:
|
Ask your Jira admin to update the app so you can continue using all features and receive the latest improvements. Admin guide (Atlassian): https://support.atlassian.com/organization-administration/docs/managing-an-installed-app/ |
|
|
Time in Status API Releasing new Time in Status data export throught API instead of JSON Data Feed link |
Ask your Jira admin to update the app so you can continue using all features and receive the latest improvements. Admin guide (Atlassian): https://support.atlassian.com/organization-administration/docs/managing-an-installed-app/ Prerequisites Go to Administration > Connected Apps > Time in Status and enable the REST API option. |
|
|
Time in Status dashboard gadgets on Forge Time in Status Gadget is a Jira dashboard gadget that allows you to monitor customized app reports directly on your dashboard. All app reports are available in this gadget, and you can analyze Time in Status data using either the Work Item List or Chart View. 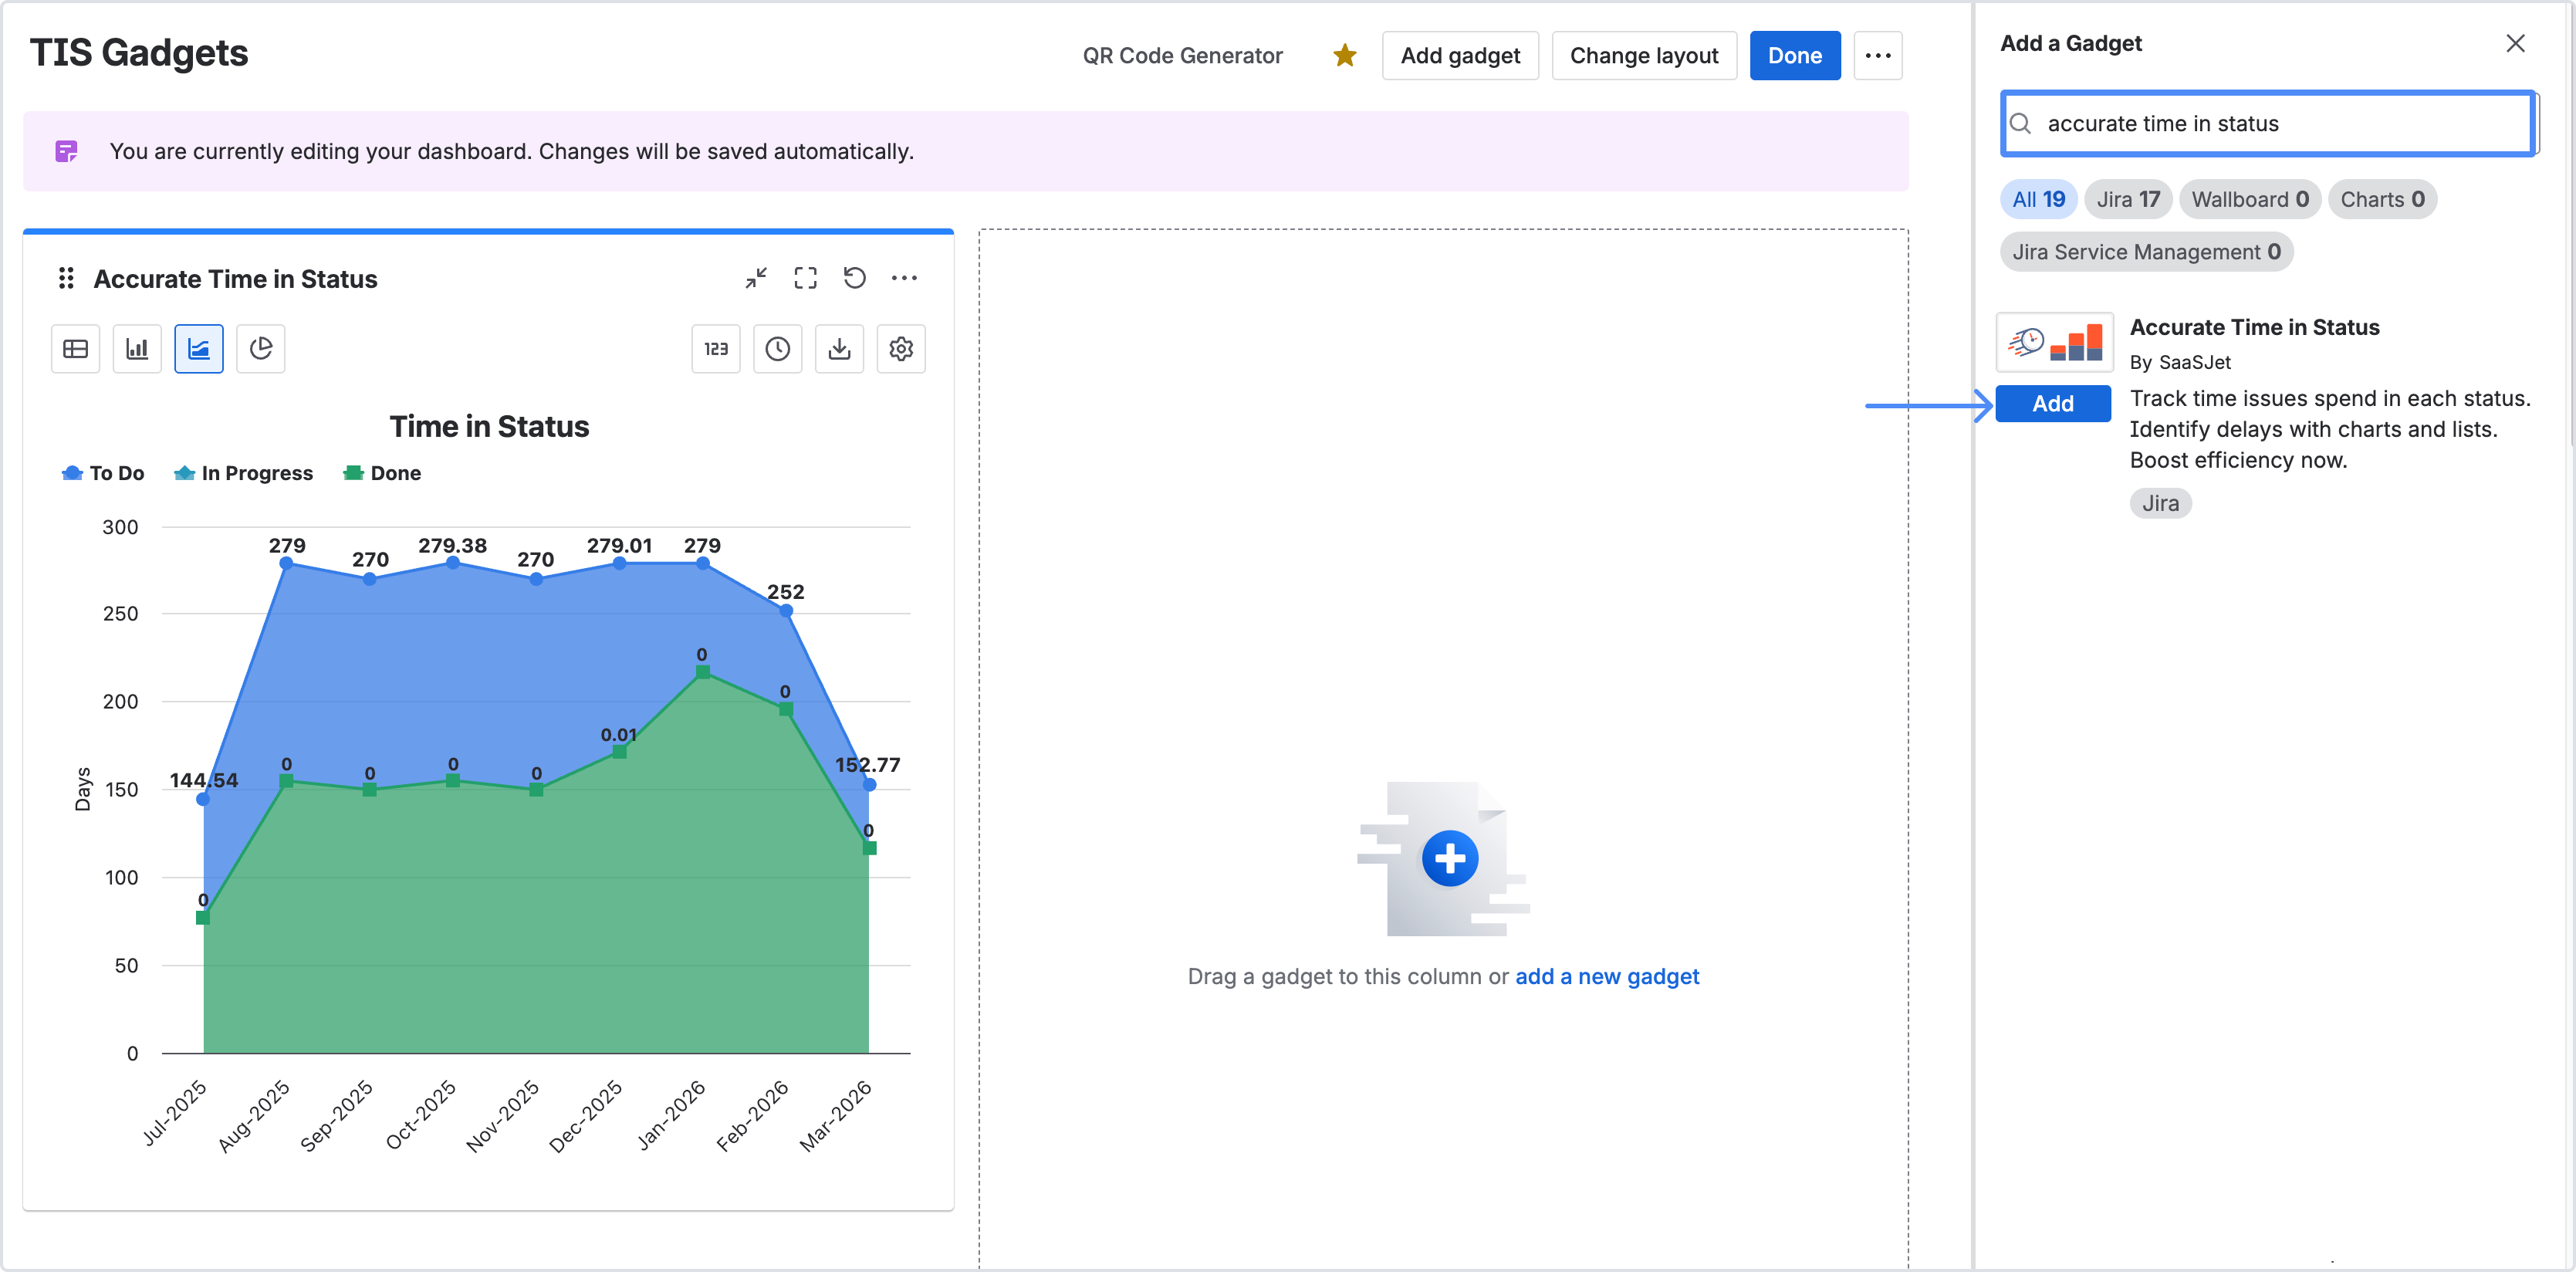
|
Ask your Jira admin to update the app so you can continue using all features and receive the latest improvements. Admin guide (Atlassian): https://support.atlassian.com/organization-administration/docs/managing-an-installed-app/ |
|
|
Global Page module on Forge As part of this update:
In addition, the following features have been deprecated:
|
Ask your Jira admin to update the app so you can continue using all features and receive the latest improvements. Admin guide (Atlassian): https://support.atlassian.com/organization-administration/docs/managing-an-installed-app/ |
|
|
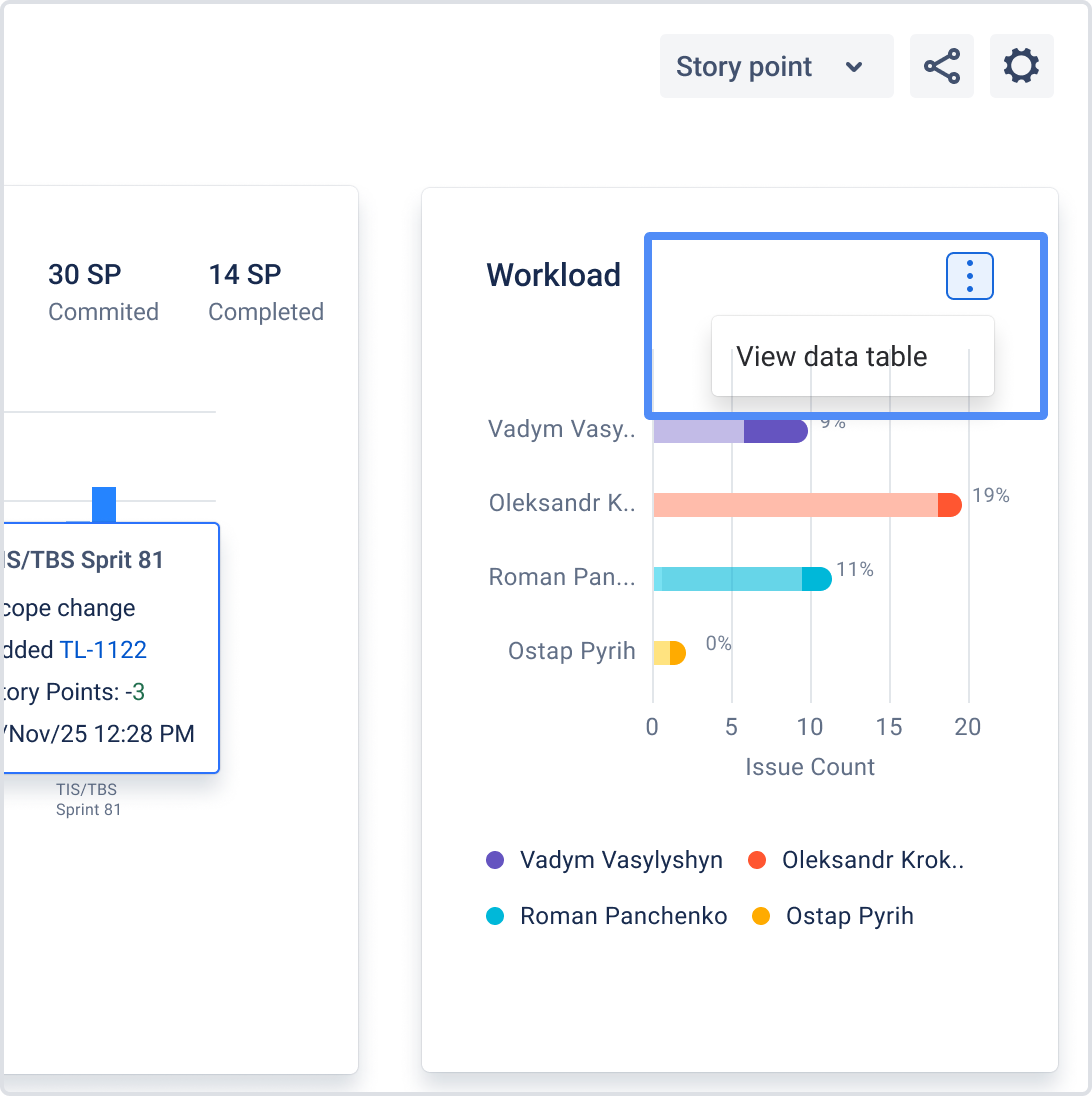
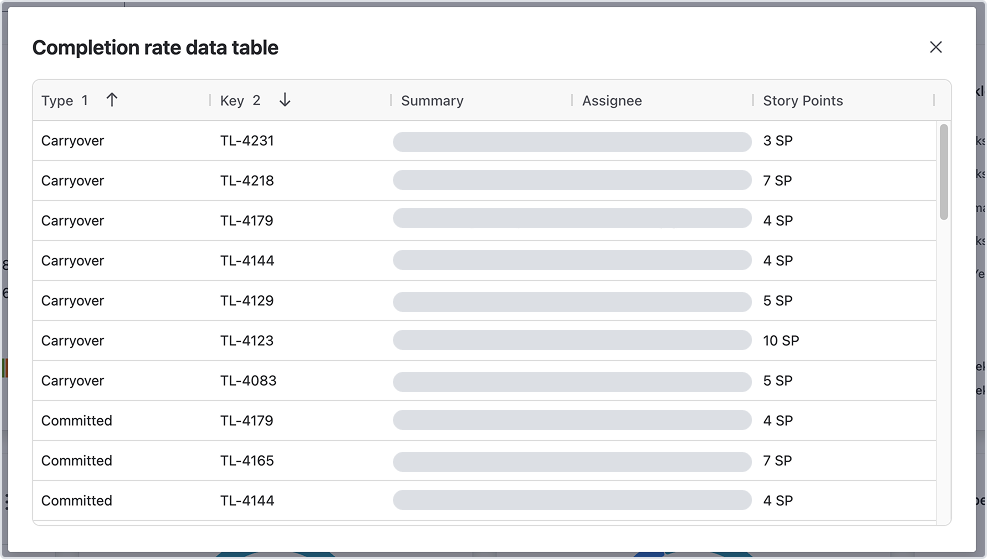
Sprint Report: Metric Data Tables (See What’s Behind Each Metric) The new View data table option lets you open a detailed table for any metric card. This makes it easy to see which work items were included in the metric calculation—along with their estimation values. Where to find it
In Sprint Report, open the three-dot menu (⋮) in the top-right corner of a metric card and select View data table.
|
Ask your Jira admin to update the app so you can continue using all features and receive the latest improvements. Admin guide (Atlassian): https://support.atlassian.com/organization-administration/docs/managing-an-installed-app/ |
|
|
Burndown Status Tracker is a workflow health view that shows how work moves between statuses and helps you spot where items get stuck. It’s a Jira Dashboard gadget included in the Time in Status app. How to use Burndown Status Tracker To display data, configure the gadget with:
The gadget will generate a chart based on your settings. Hover over any value on the chart to open a tooltip, where you can jump directly to the list of issues included in the calculation. 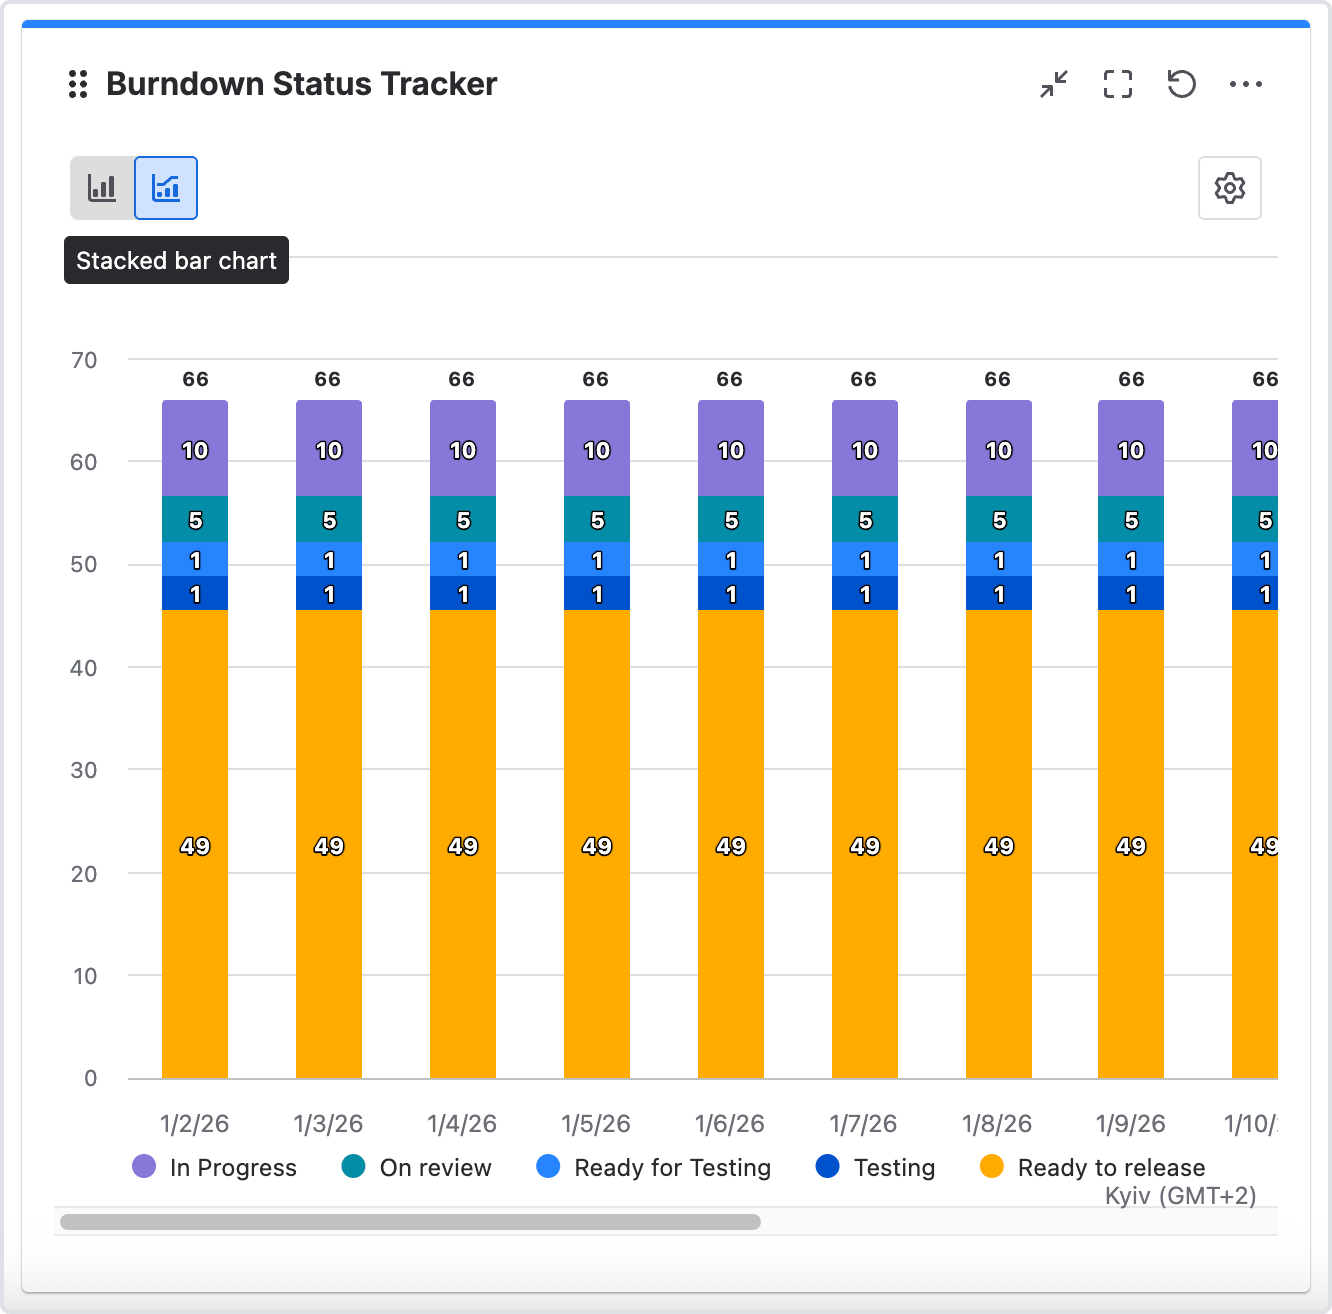
|
Ask your Jira admin to update the app so you can continue using all features and receive the latest improvements. Admin guide (Atlassian): https://support.atlassian.com/organization-administration/docs/managing-an-installed-app/ |
|
|
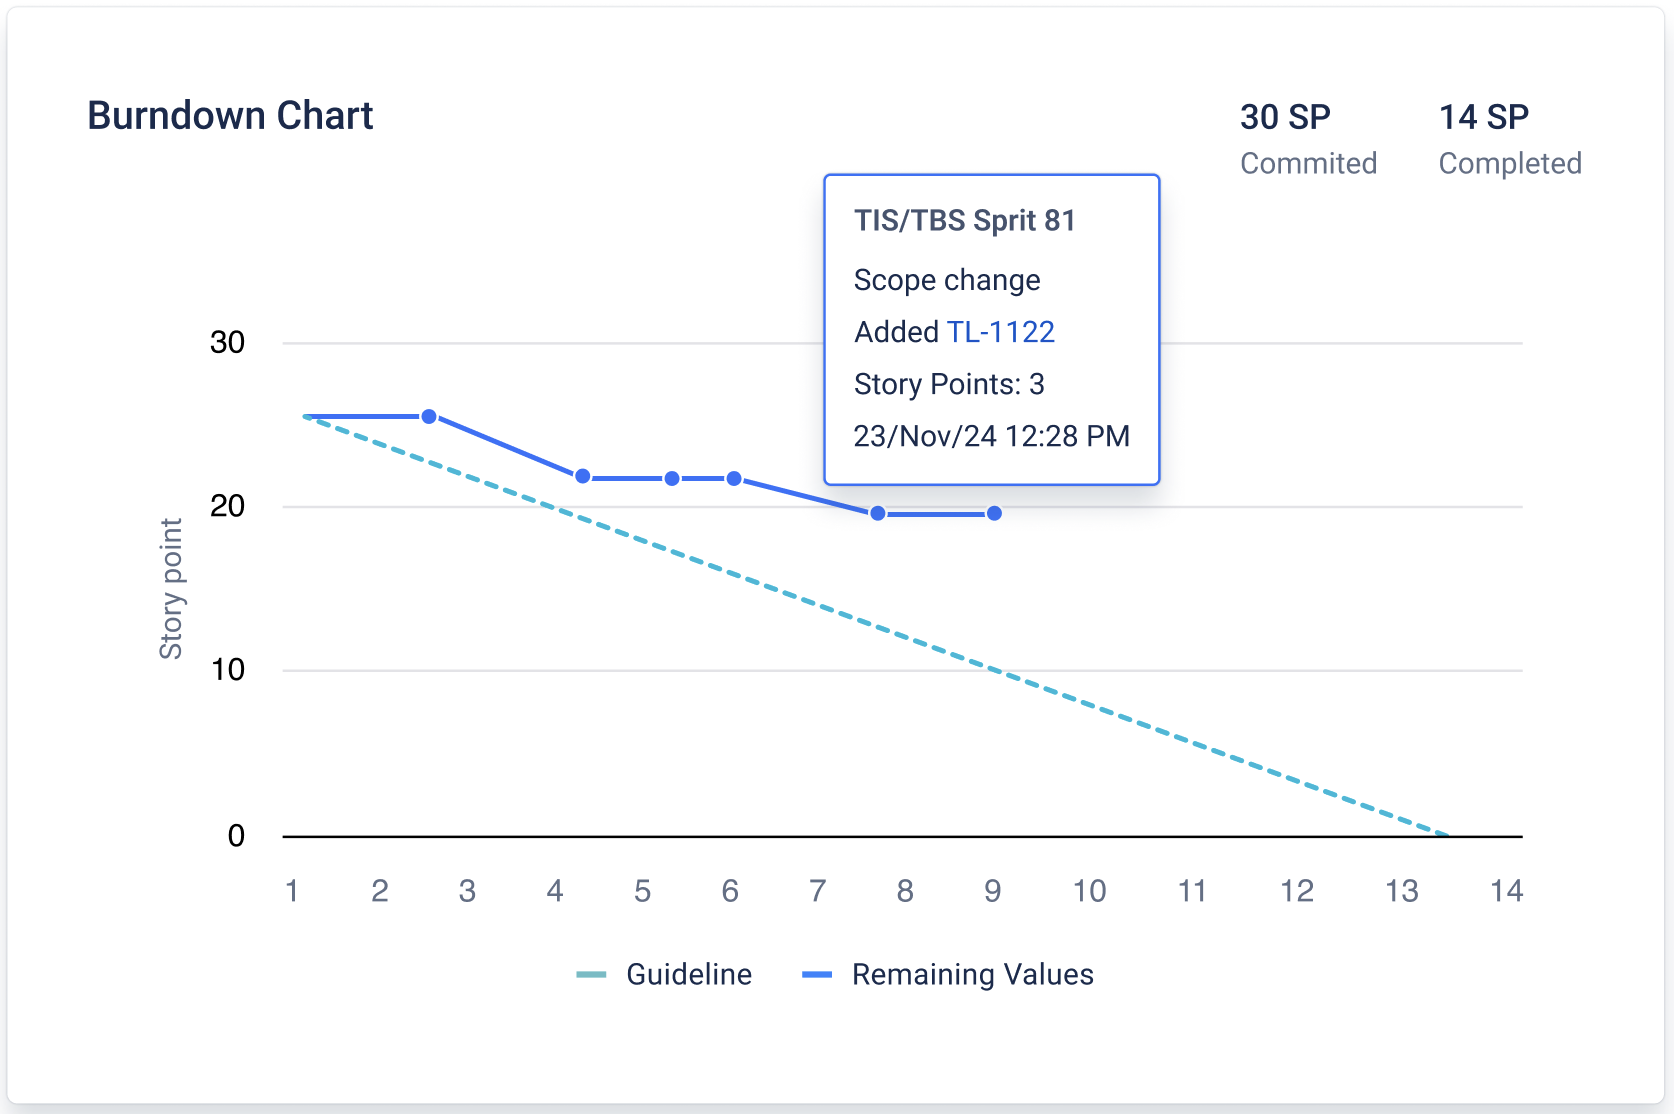
Sprint Report Now Supports Active Sprints Previously, Sprint Report was available only for completed sprints. You can now select an active sprint to track progress in real time. Active sprint support
Burndown chart for active sprints
|
Ask your Jira admin to update the app so you can continue using all features and receive the latest improvements. Admin guide (Atlassian): https://support.atlassian.com/organization-administration/docs/managing-an-installed-app/ |
|
|
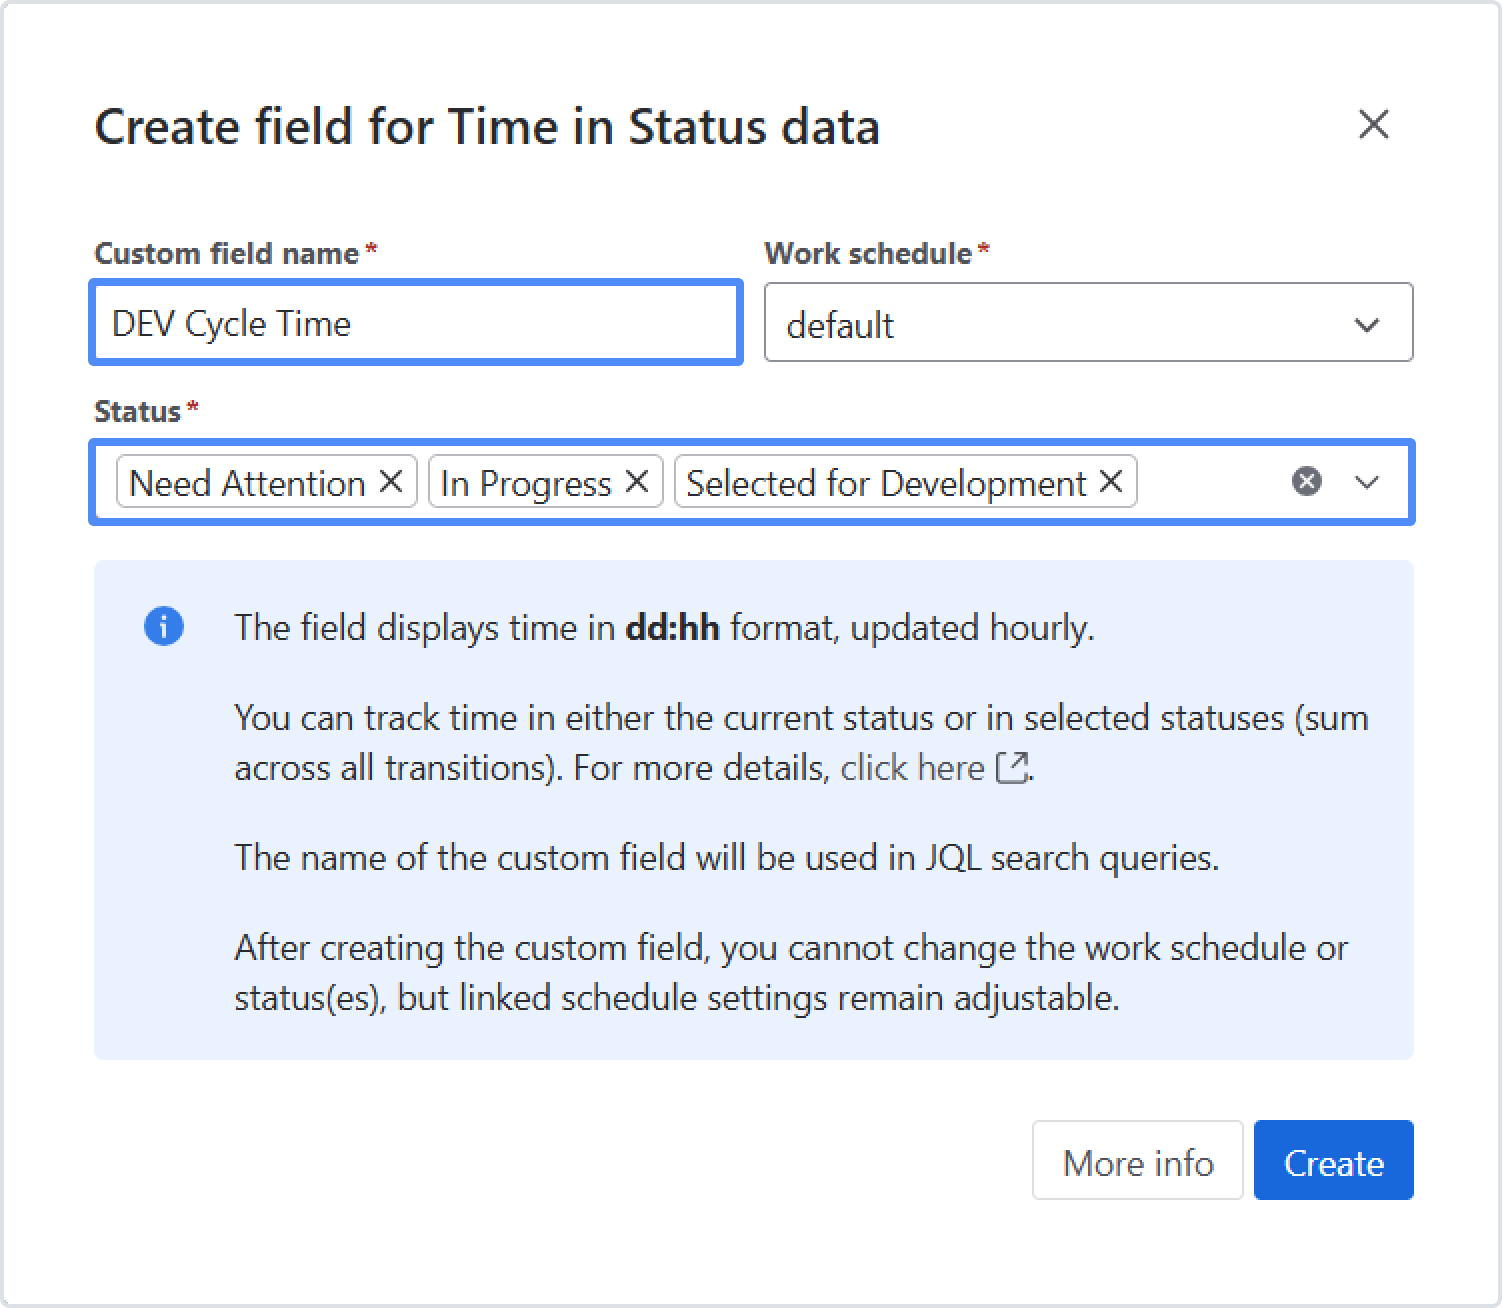
Group statuses into one metric in a single custom field Select Group statuses to combine multiple statuses and calculate a specific time metric. Examples:
|
- |
|
|
Rovo agent FlagFocus by Time in Status FlagFocus by Time in Status helps teams identify blockers by measuring how long issues remain Flagged and where that time accumulates (e.g., In Review, Waiting for Customer, In Progress, etc.). Provide a JQL query and a time window; the agent scans issue history and turns flagged intervals into clear signals. |
- |
|
|
Custom Field functionality moved to Forge, Required scopes changed
Required scopes changed:
|
- |
|
|
Sprint Report Relocated; Required scopes changed Required scopes changed:
Sprint Report Relocated:
|
- |
|
|
Get Started & Custom Field UI moved to Forge; required scopes updated Moved the Get Started page to Forge and the Time in Status Custom Field UI to Forge Remote for better platform integration. Required scopes changed:
|
- |
|
|
✅ Show Percentages as Labels - Converts data labels into percentage values. ✅ Trendline for Column Charts - Adds a linear trendline to column charts. ✅ Hide Labels - Hides data labels for a cleaner chart view. |
- |
|
|
Dark mode support Enjoy a modern, low-light UI theme across Time in Status. Perfect for reducing eye strain and improving focus. |
- |
If you need help or want to ask questions, please contact SaaSJet Support or email us at support@saasjet.atlassian.net
Haven't used this add-on yet? Try it now!