Improving Assignee Reporting: Overcoming Common Challenges
📝 Context: Managing a team effectively requires a comprehensive understanding of each team member's performance. This guide explains how to overcome common challenges in assignee reporting and analyze assignee work in Jira to gain valuable insights into productivity, workload, and performance. |
|---|
🤔 User Problem: Team leaders and managers need a way to accurately assess the performance of each team member, identify potential roadblocks, and ensure efficient resource allocation. They face challenges such as inaccurate data, overlapping assignments, lack of clarity, and limited visibility. |
|---|
Overcoming Challenges in Assignee Reporting
Inaccurate or Incomplete Data:
Solution: Ensure assignees regularly update their issues to provide accurate and complete data. Encourage team members to log time spent, change statuses, leave comments, and update issues promptly.
Overlapping or Duplicate Assignments:
Solution: Split tasks that require multiple assignees into smaller tasks. Plan work effectively to avoid duplication and ensure that each team member clearly understands their responsibilities.
Lack of Clarity in Assignments:
Solution: Clearly define assignments and communicate responsibilities effectively. Daily stand-ups ensure everyone is on the same page and understands their tasks.
Limited Visibility:
Solution: Ensure team members have visibility into each other's issues to view the project comprehensively. Transparent workflows help identify potential roadblocks and foster better collaboration.
Challenges in Analyzing Assignee Work
Incomplete Picture:
Solution: Consider the context of the assignee's work and how it fits into the broader project or team goals. Analyze the work of the entire team to get a complete picture.
Variability in Task Complexity:
Solution: Consider the complexity of tasks when analyzing the work of a single assignee. This helps in drawing accurate conclusions about their performance.
Lack of Collaboration Insight:
Solution: Consider how the assignee's work intersects with the work of others and how they contribute to the overall team effort. Foster collaboration and teamwork to achieve project goals.
Limited Sample Size:
Solution: Analyze the work of multiple assignees to draw meaningful conclusions. Consider the scope of tasks and projects when analyzing performance.
Data Quality:
Solution: Ensure the assignee's work is consistently tracked and updated in Jira to provide accurate and complete insights.
Jira Dashboards for Assignee Performance Reporting

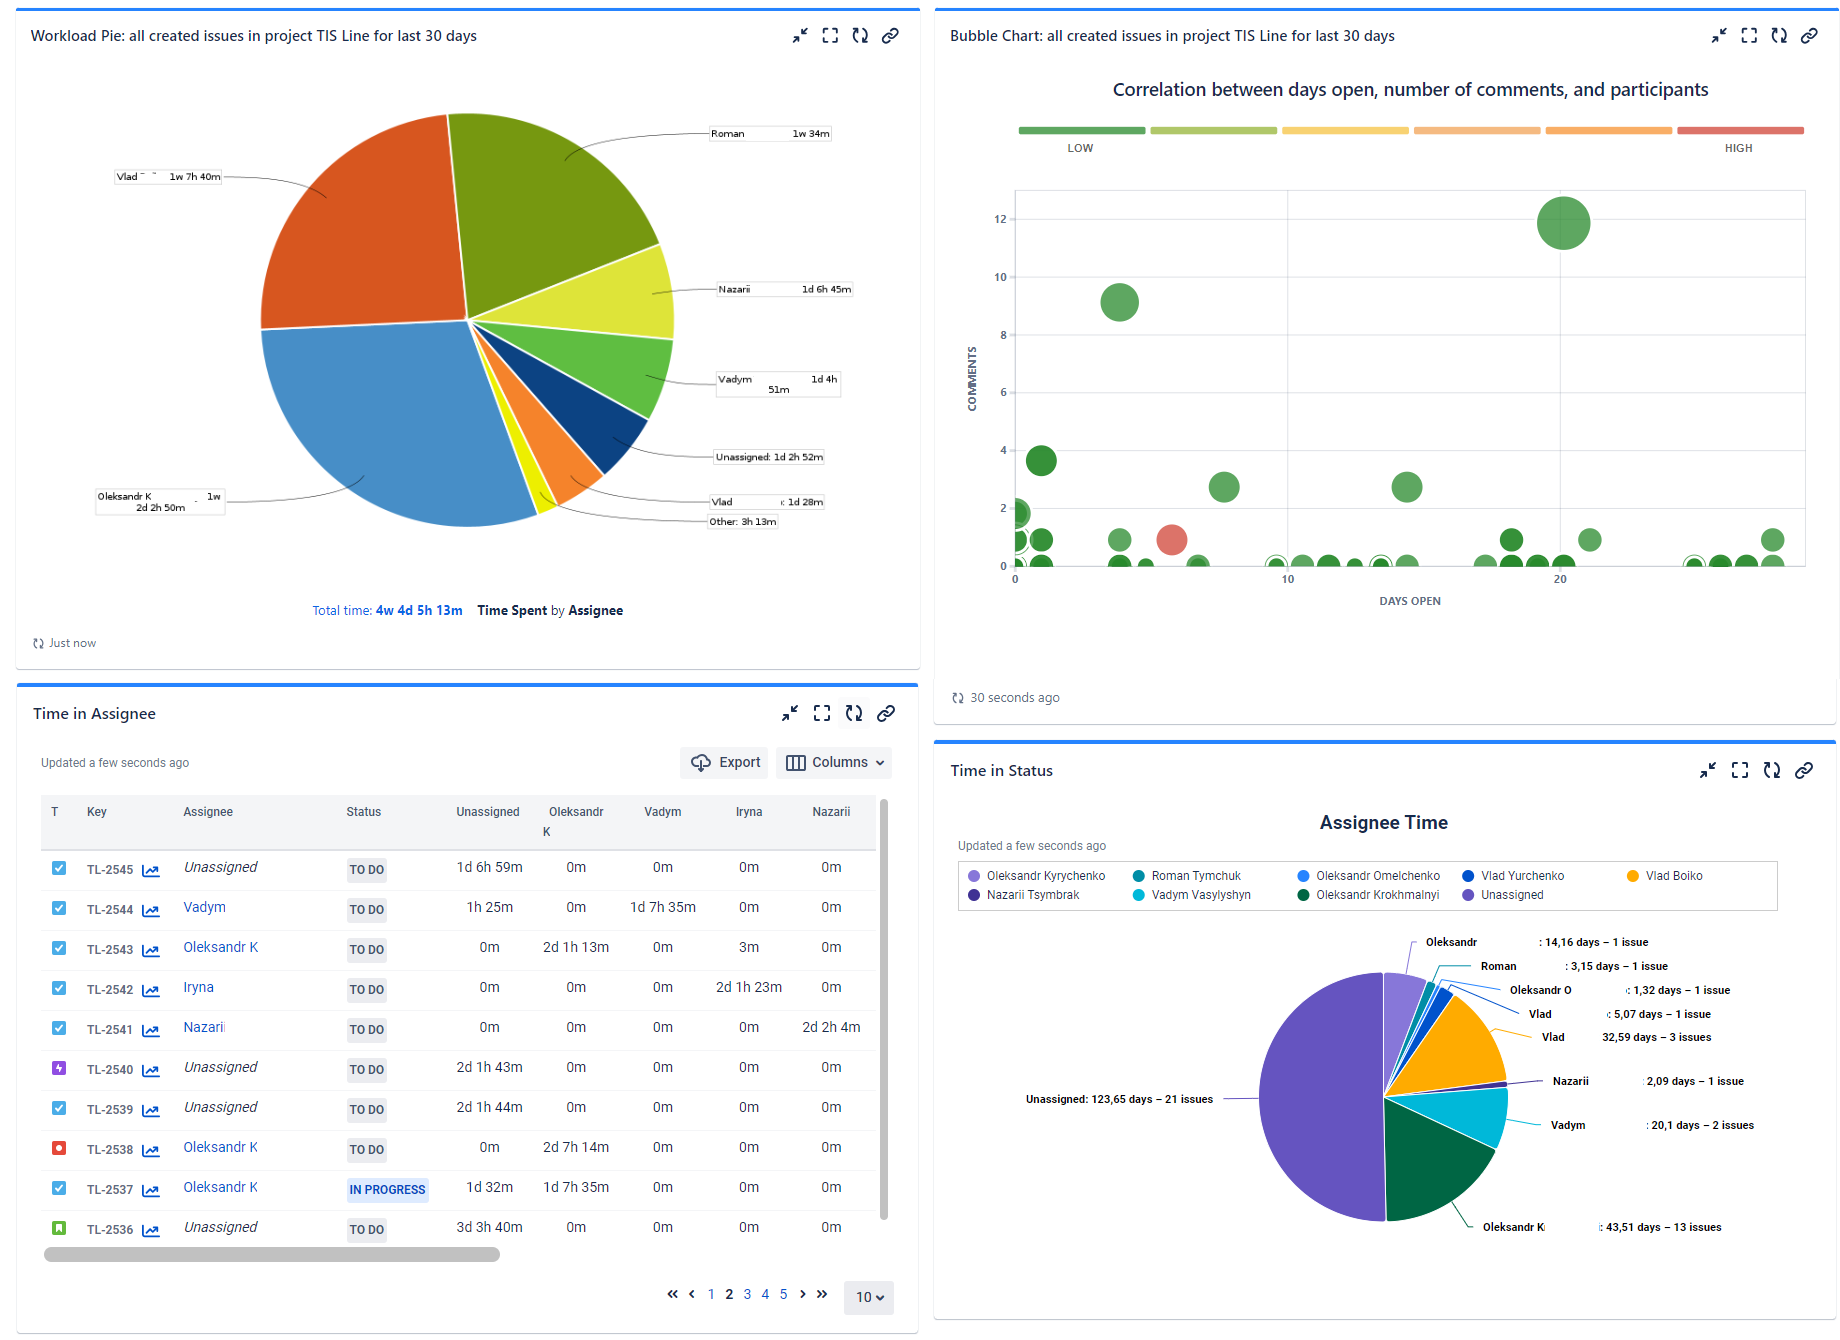
Jira Gadget Workload Pie. A workload pie chart visually represents how an individual or team's time is allocated across different tasks. It is a circular chart divided into slices, each representing a proportion of the whole. The size of each slice corresponds to the amount of time or effort devoted to a particular task.
Further diagonally from it is the Assignee time report (a gadget in the Time in Status app). Why are these two charts essential to us? Firstly, the Workload Pie shows the distribution of time spent on a task, while the Assignee Time pie chart illustrates how much time specific tasks were assigned to a particular Assignee. By comparing the values from both charts, we can see that a specific team member is experiencing delays in working on tasks. The task has been assigned a long time ago, but for some reason, they have only recently started to complete it. This signals us that we need to take a closer look at the situation and possibly adjust it to complete the work on time and with high quality without delays.
Bubble Chart. It's a great chart that will alert us to possible difficulties in time. As you can see, some tasks stand out from the crowd - they were created long ago and are actively filled with comments. Perhaps we need to look at such large “bubbles” and reallocate resources, etc.
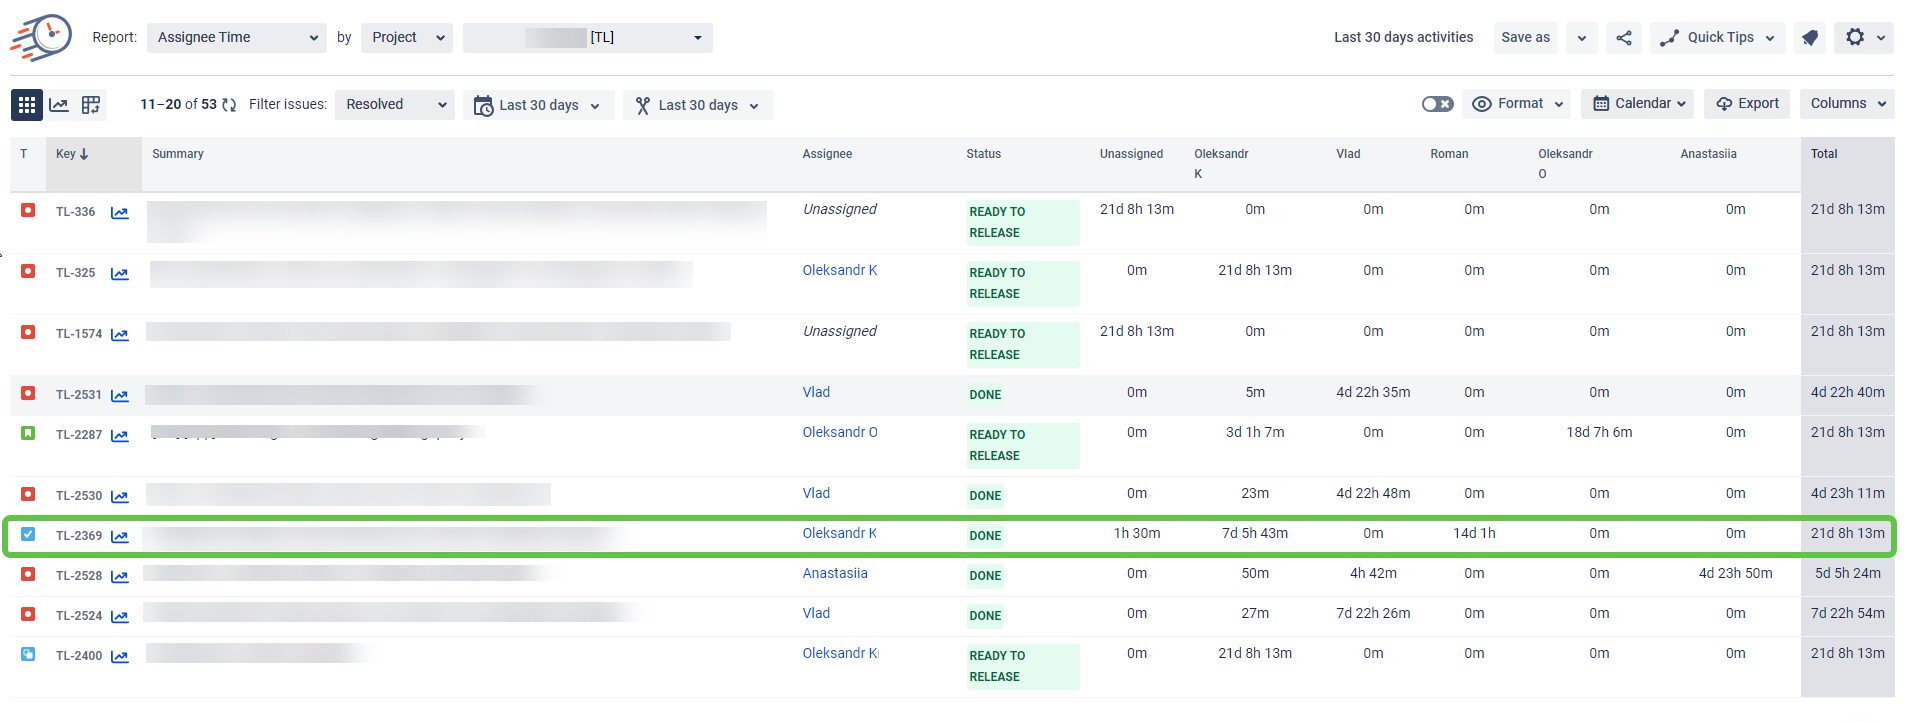
The Assignee time report is in the form of a grid. Here, we can see how long a task was in progress on each Assignee or how long it was Unassigned.
Let's take a closer look at this report.

If you have a practice where one task is reassigned to different performers, you can use this report to see how long the issue was on each. It's easier than juggling custom fields and other workarounds.
📈 Outcomes:
|
|---|
If you need help or want to ask questions, please contact SaaSJet Support or email us at support@saasjet.atlassian.net
Haven't used this add-on yet? Try it now!