
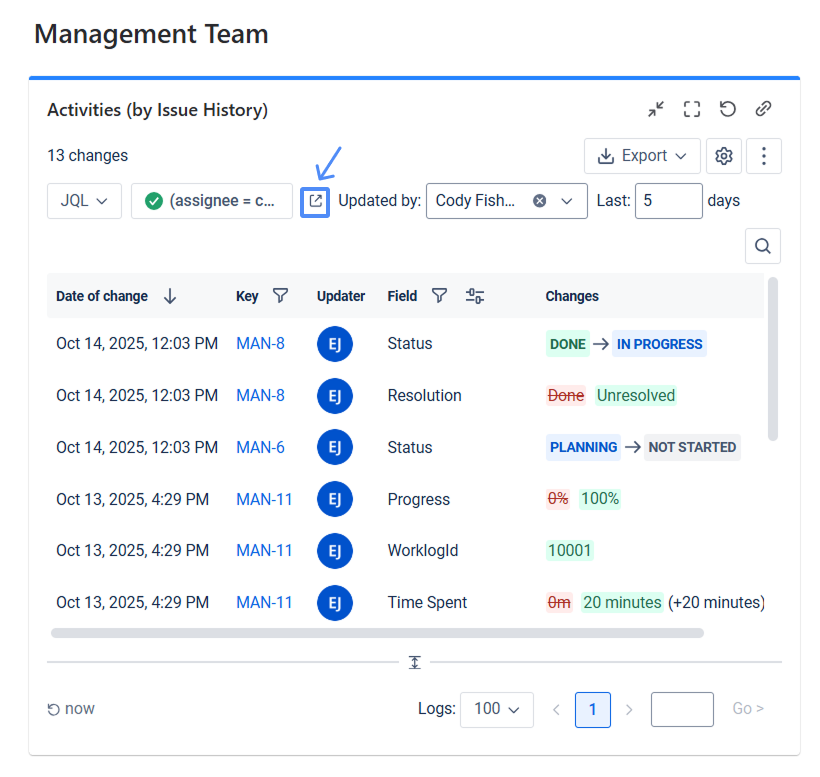
Activities | Issue History gadget presents changes made to the fields in rows like a stream or flow of activities. It uses the same principles to represent data as the Activity view in the app.
Now, you can add a full work item history report to your Jira dashboard:
-
track changes to any standard or custom field
-
filter by project/JQL/filter
-
select one or multiple users
-
set timeframe (within the last -- days)
The gadget reflects all past activities, including those made before the app was installed.
Configuration
-
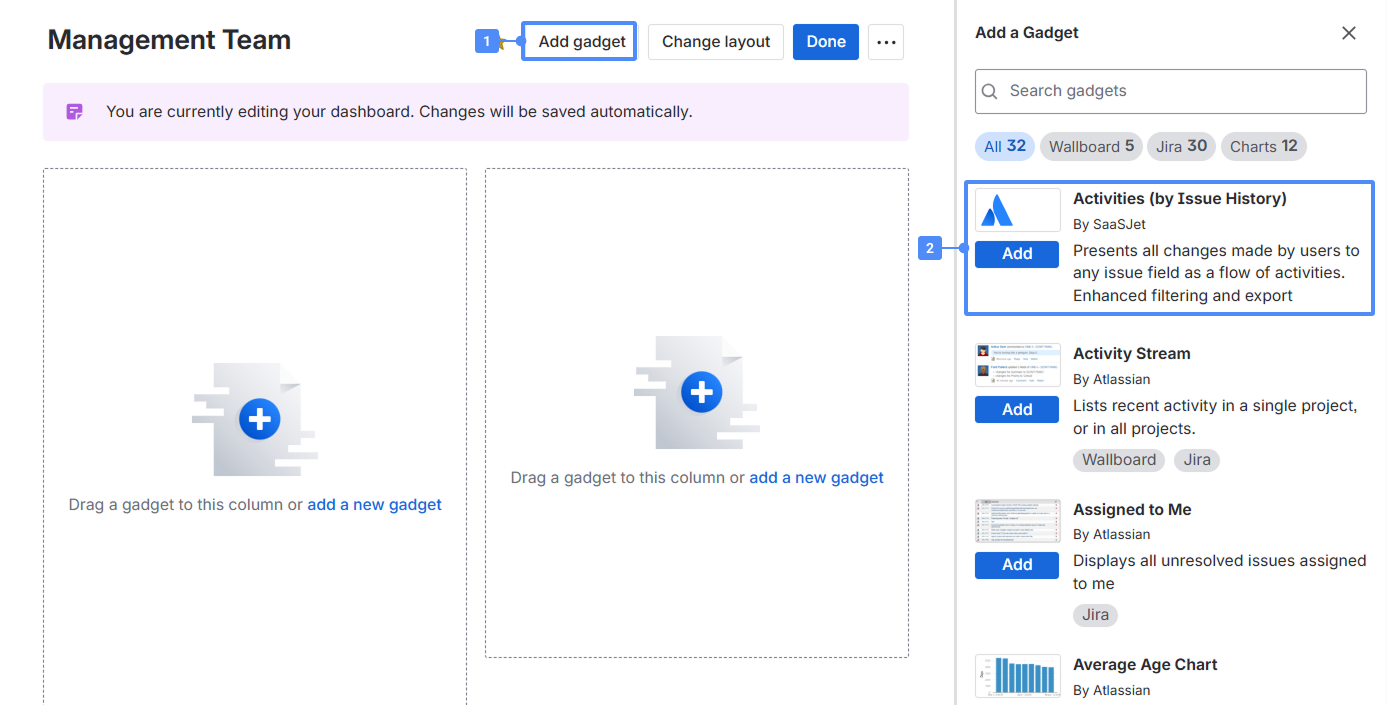
Open your Jira dashboard (or create one if you don’t have it).
.png?cb=13c1007020ff9f6741f78b983f74cd1c)
-
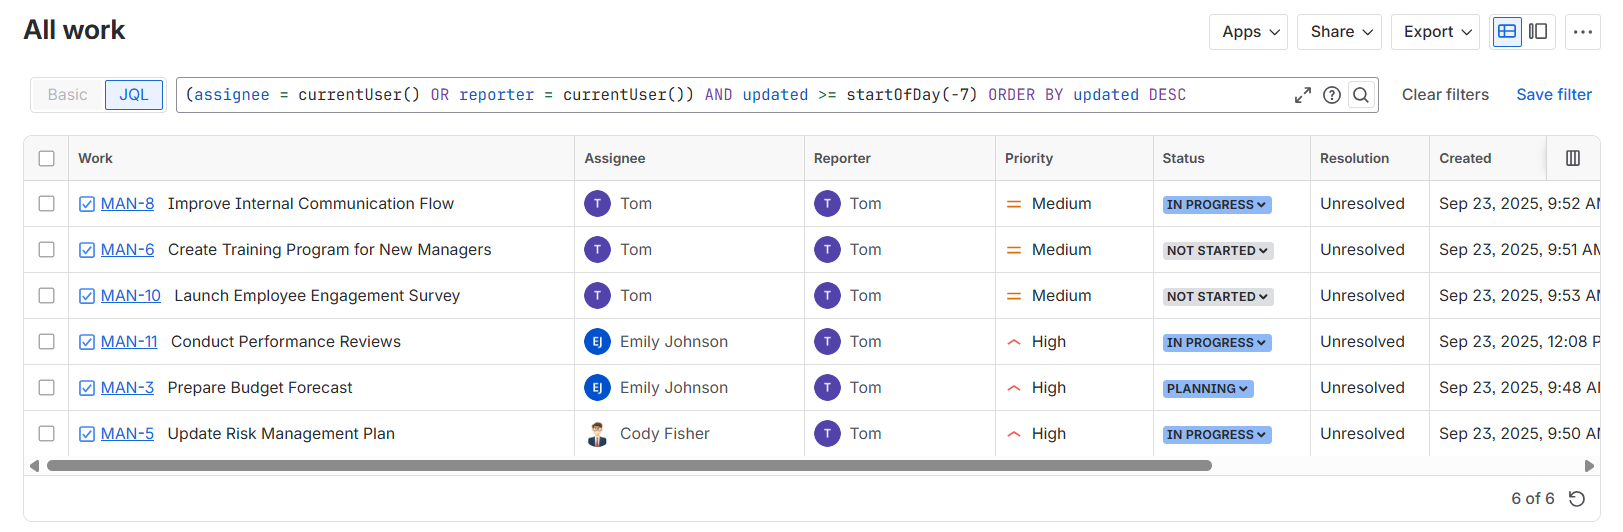
Add Activities | Issue History gadget to your dashboard. To do that, click Add gadget, then choose Activities (by Issue History) and click the Add button.
-
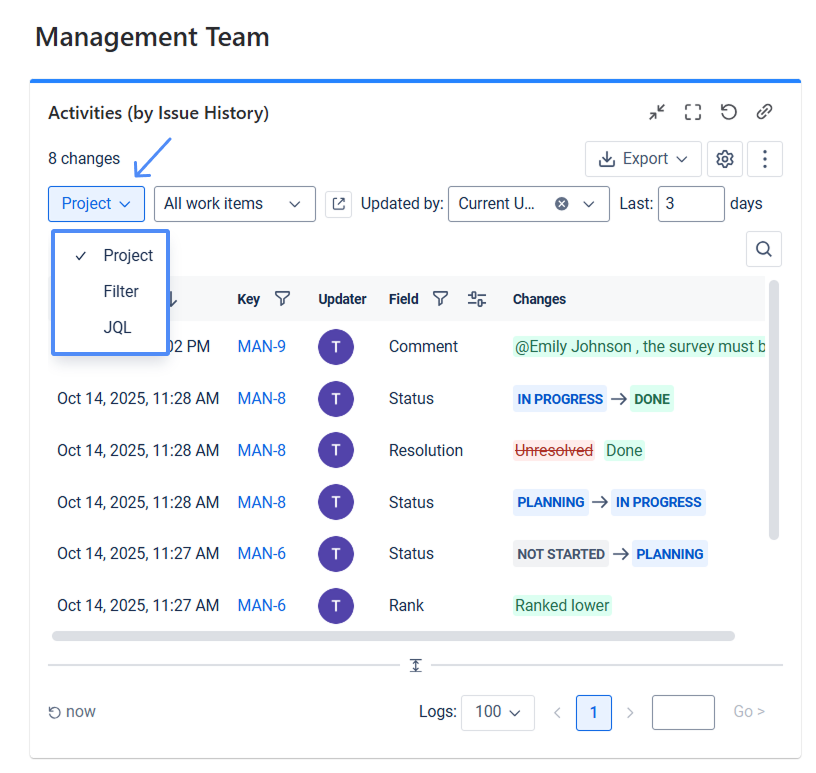
There are three options to select work items by Filter, Project, JQL. Choose the one you need and the following items accordingly.
-
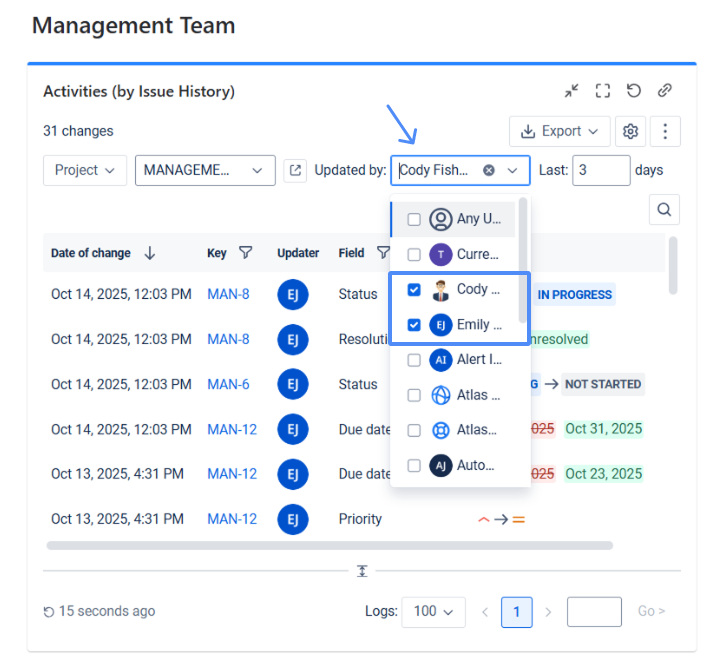
Also, you can choose a user/users who have made updates.
-
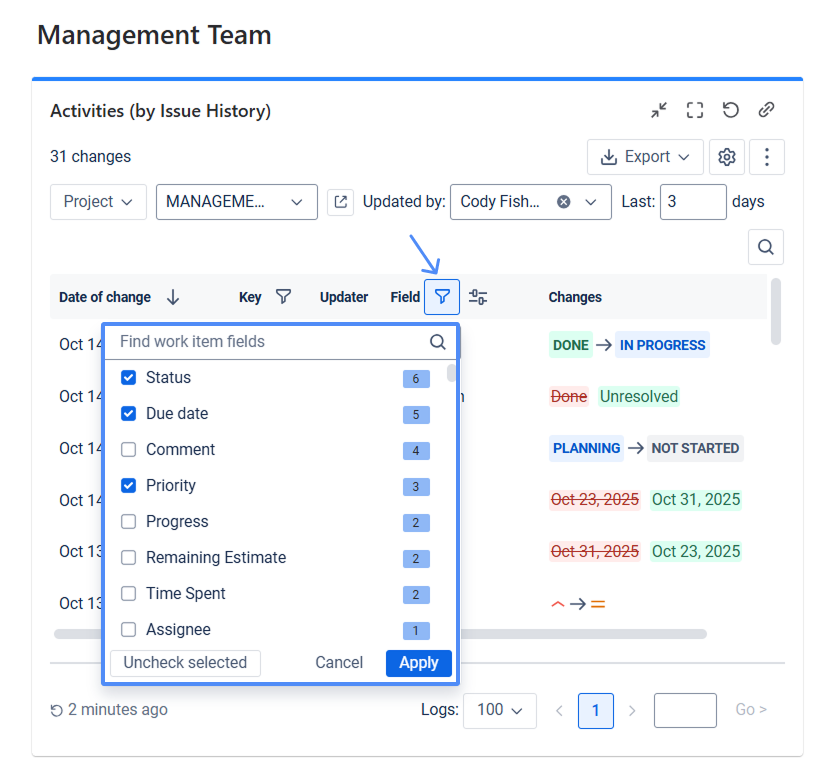
Use the Filed filter to choose which activities you want to see. For instance, it can be Status, Due date, and Priority.
-
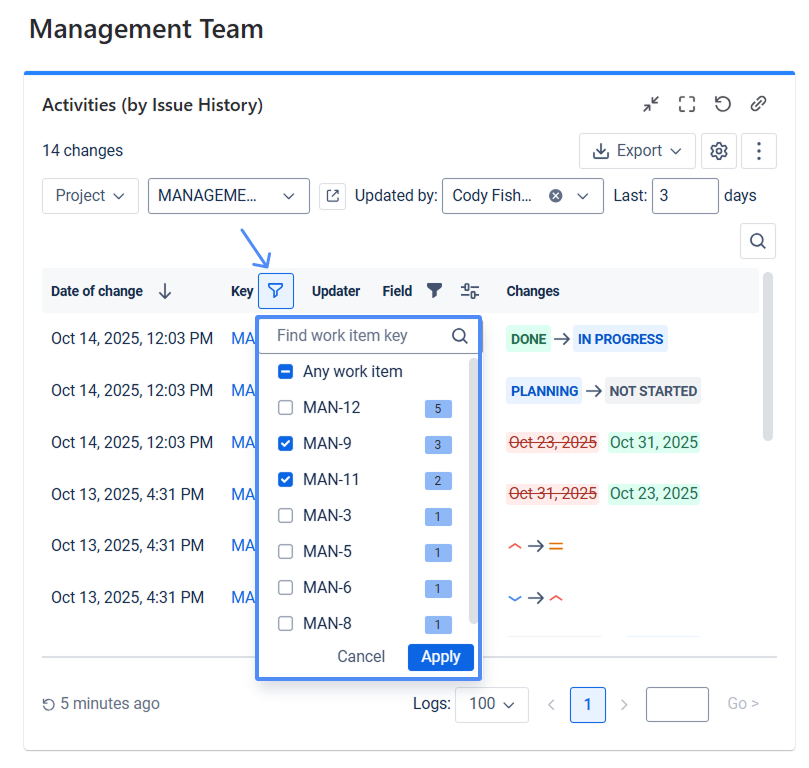
Use the Key filter to choose the exact work items you want to see. For example, it can be all the work items or just the ones you want to focus on.
-
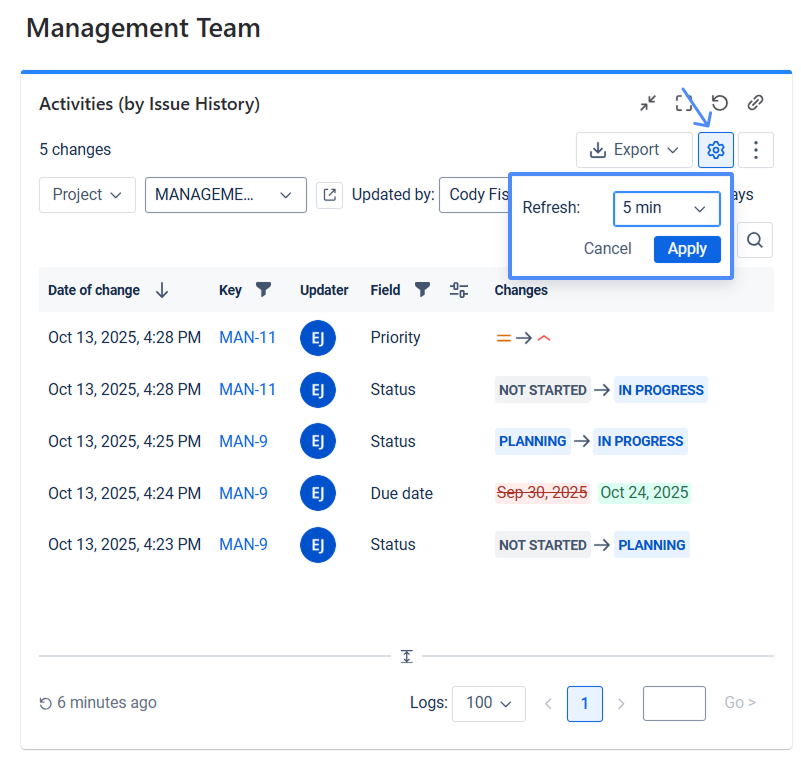
Click the Settings icon (the cog-gear widget), then select Refresh interval.
-
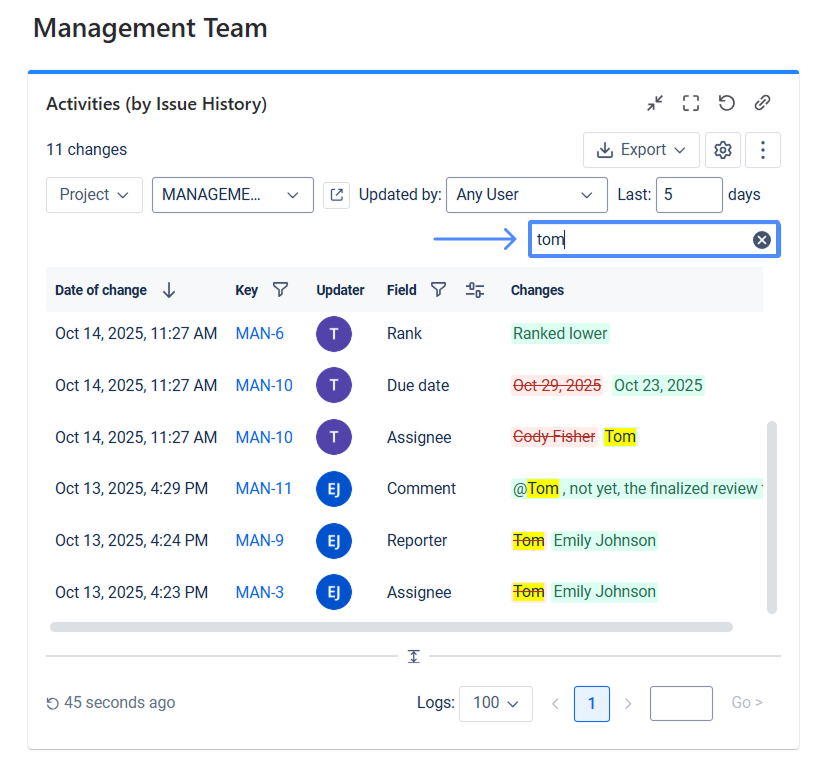
Search option. Enter the required keyword into the search bar. The system will automatically process your input and display all relevant activities matching your search term.
-
You can also open the filter with the selected work items in a new window.
-
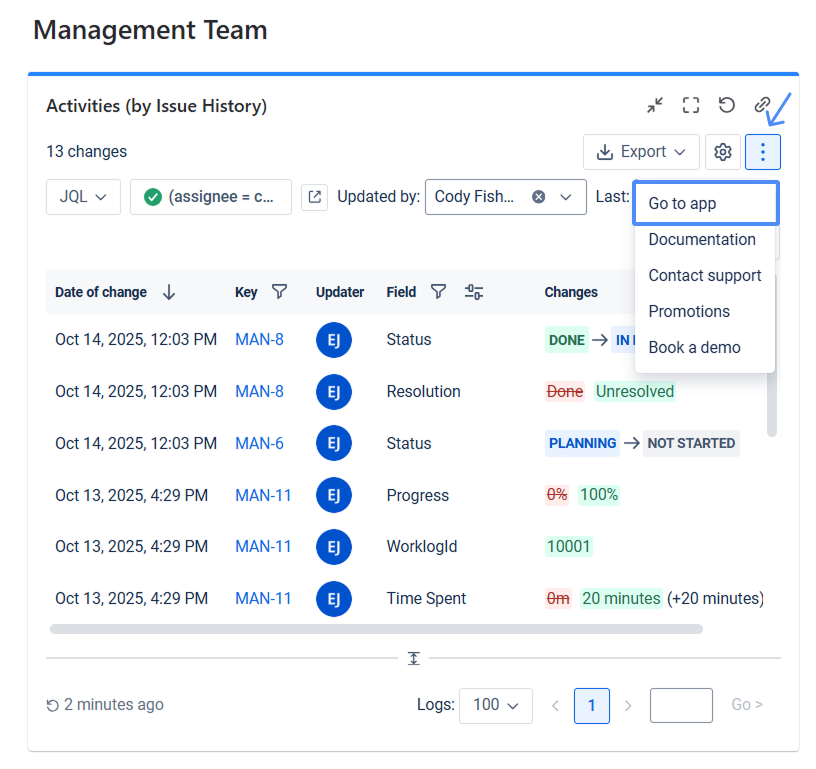
If you need to open the app with full functionality, click on the Go to app link.
-
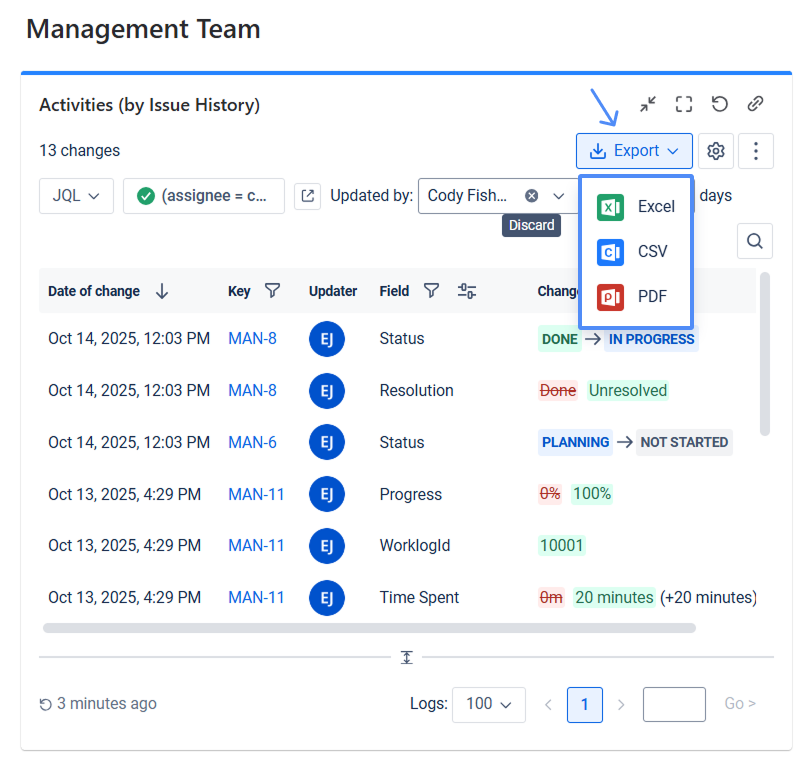
Export the report with changes in PDF, CSV, or Excel format.
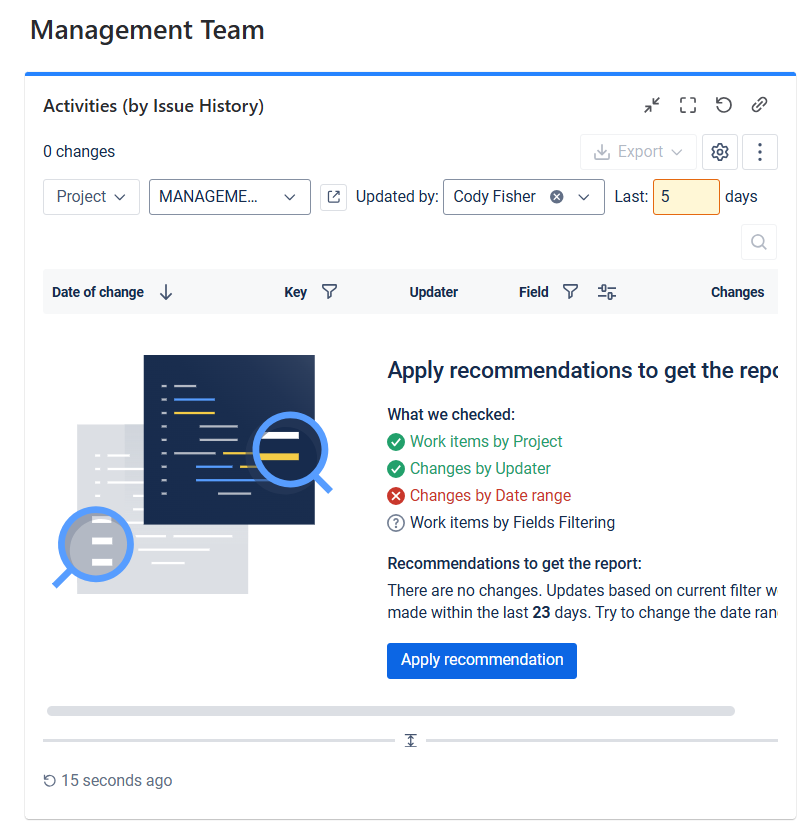
Empty State Troubleshooter
When no changes are found in your report, it usually means the filter conditions don’t match any data. That’s where the Empty State Troubleshooter comes in.
This built-in visual assistant automatically detects problems with your filters and provides helpful suggestions for adjusting them. Whether it's a date range, user selection, or field mismatch, Troubleshooter will point out the problem so you can quickly get back to viewing your work item history.
Haven't used this app yet? 👉 Then you’re welcome to try it 🚀