
This option is free for everyone if you remain in expired status and do not cancel your subscription. Payment is required only to use the main report options.
If you've already shared credit card details, it will not be possible to stay in expired status and use this functionality.
Export is accessible only in the paid version.
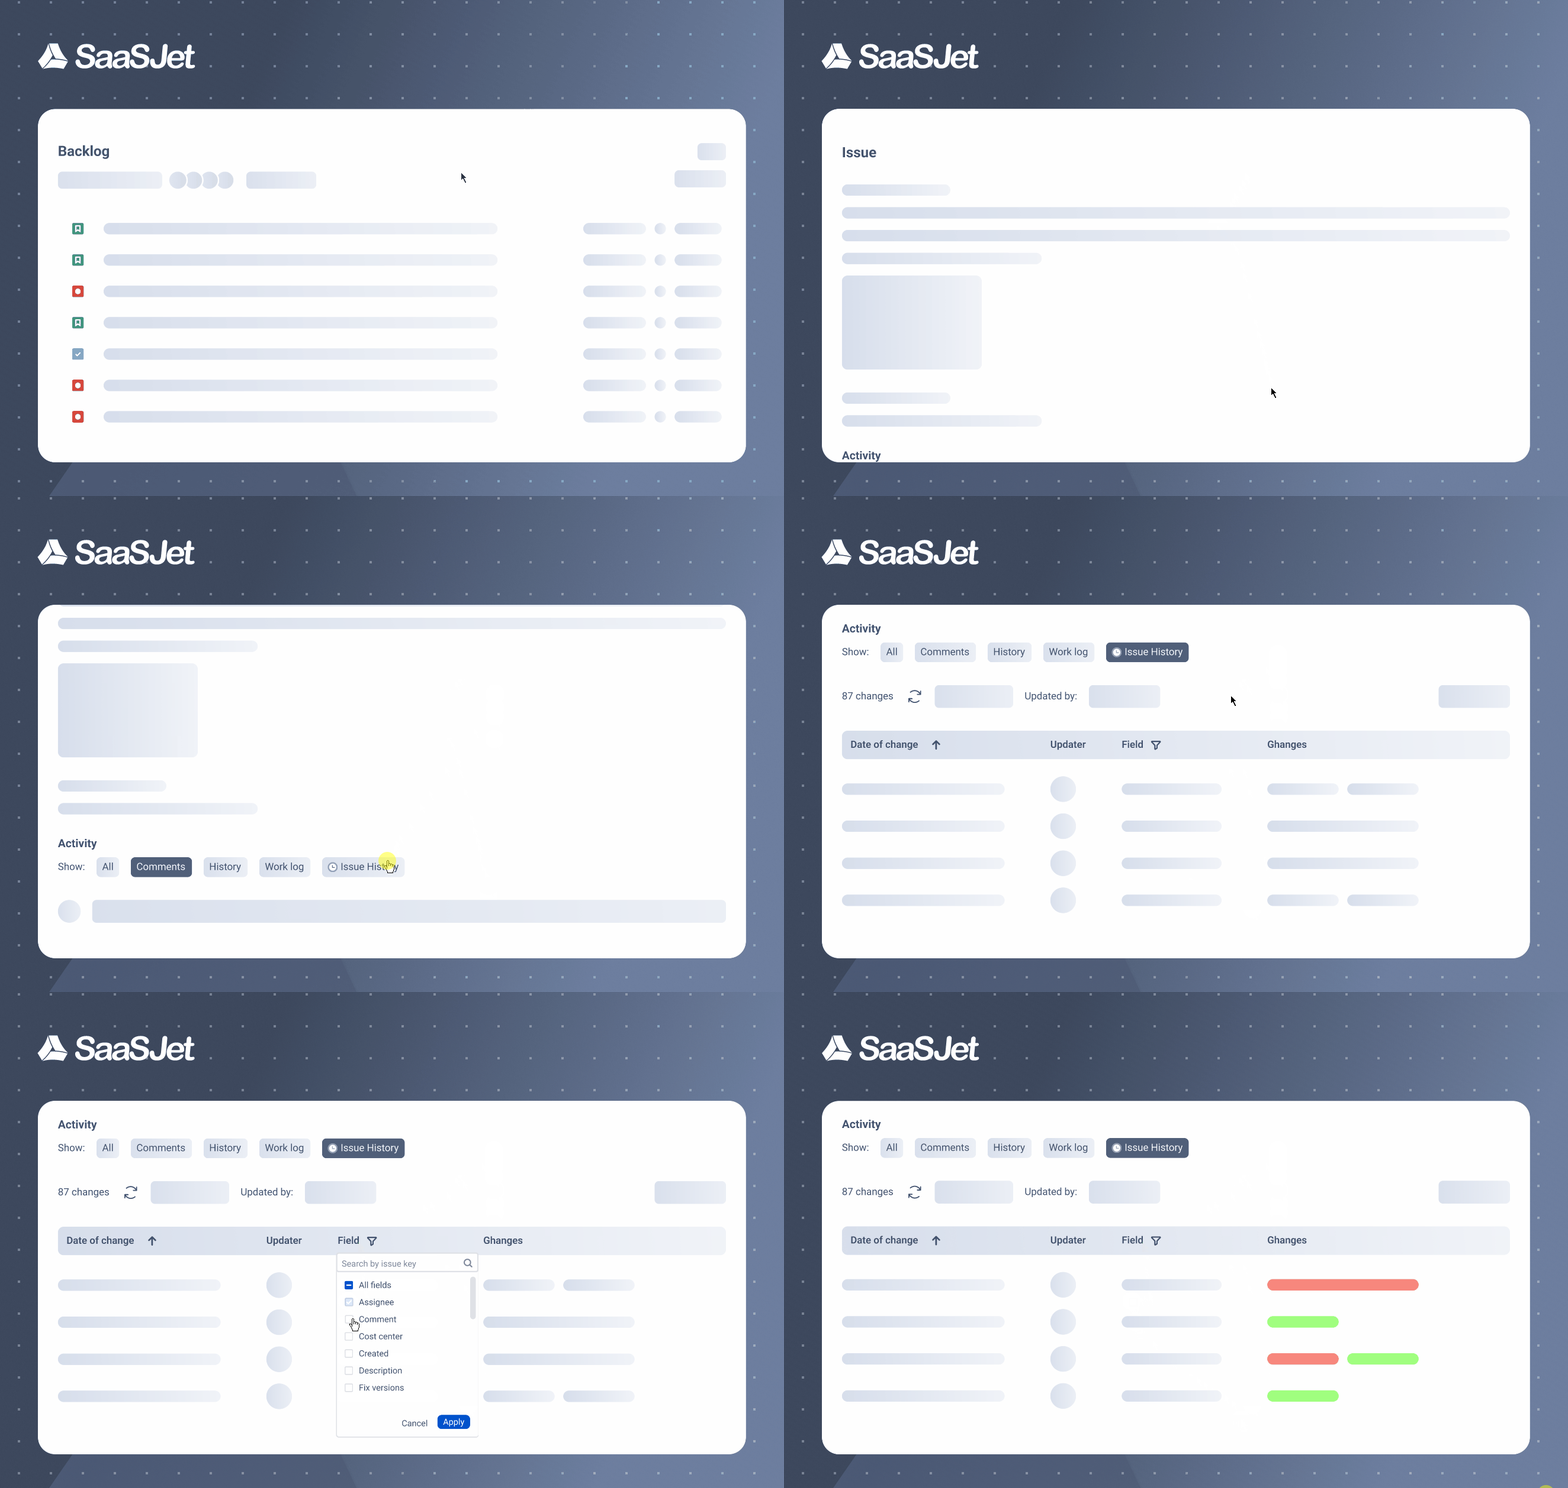
While it is convenient to view the change history for a list of work items, Issue History in Jira also offers a well-structured, customizable report for a single work item. All changes will be presented one by one in vertical order.
Compared to the built-in Jira history, you will get the following:
-
Relevant changelog filtering
-
Flexible field selection
-
Eye-catching highlighting for updates
Configuration
-
Click to open the required work item.
.png?cb=250ae3eb3167dac48e6c5a4a52a049a1)
-
Scroll down to the Activity section, click More, and select 🕒Issue History. You will get a well-organized report for the selected work item updates:
.png?cb=f738d84076a75902d76aaa778a0da602)
Activity View
In the Activity View of 🕒Issue History, you can apply different types of filtering to see the specific list of changes: Date range, Updated by, or Field filter.
For example:
-
Select the desired date preset (today, last week, last month, etc.) to narrow down the issue changelog.
.png?cb=4696edc99676d8a44382ba8d034373d2)
-
Use the Updated by menu, type in the name, or select the person you need from the drop-down list.
.png?cb=f341be3a2e48f8a5be279863051041a6)
-
Use the Field filter to select any fields (standard or custom) where you want to see changes. For instance, you can review changes only for Description.
.png?cb=c32528d96831069cc61906c83780ff29)
Result:
.png?cb=52207f4cc382e09c16f30c6199d331dc)
-
Search option. Enter the required keyword into the search bar. The system will automatically process your input and display all relevant activities matching your search term.
.png?cb=e2de5f67c6bbed7df40b7b4f5f9bcc32)
-
Sort by date in ascending/descending order by clicking the Arrow.
.png?cb=e4991673cb6a856e015322e9ffabe4e7)
-
Click More to go to the main app report, where you can view all available options for the list of work items, explore the documentation, contact our support team, or book a demo.
.png?cb=011c25b7de70dd5d7fd0eca526ea61eb)
-
Export to Excel, CSV, and PDF is available only in the paid version.
.png?cb=174141d1be339dc8bce53e8a282d4cc7)
Additional features:
-
Revert description: Revert description changes directly from the work item panel (paid version only). Learn more
-
Comment tracking: Enable tracking to view comment history. Learn how to activate
Activity Stream
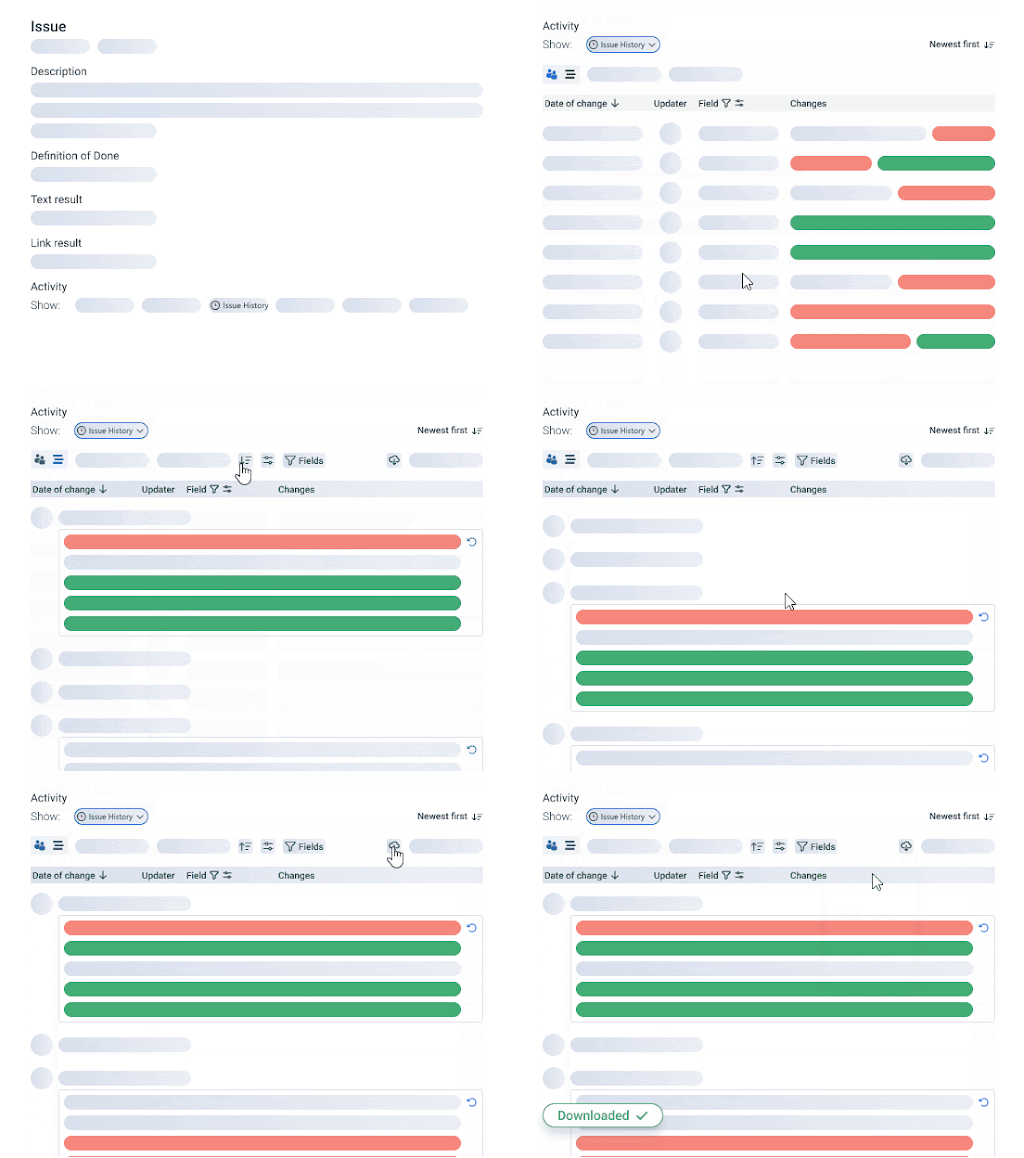
Stream mode provides a continuous and structured view of activity data. It shows all changes in a work item, such as added, removed, or updated details.
.png?cb=22f20fb328af7ec70e2e0ed7ca546aa3)
This feature is free and allows efficient tracking and analysis of activity. Additionally, the data export functionality allows you to export data in a tabular format for further analysis or reporting.
Activity Timeline
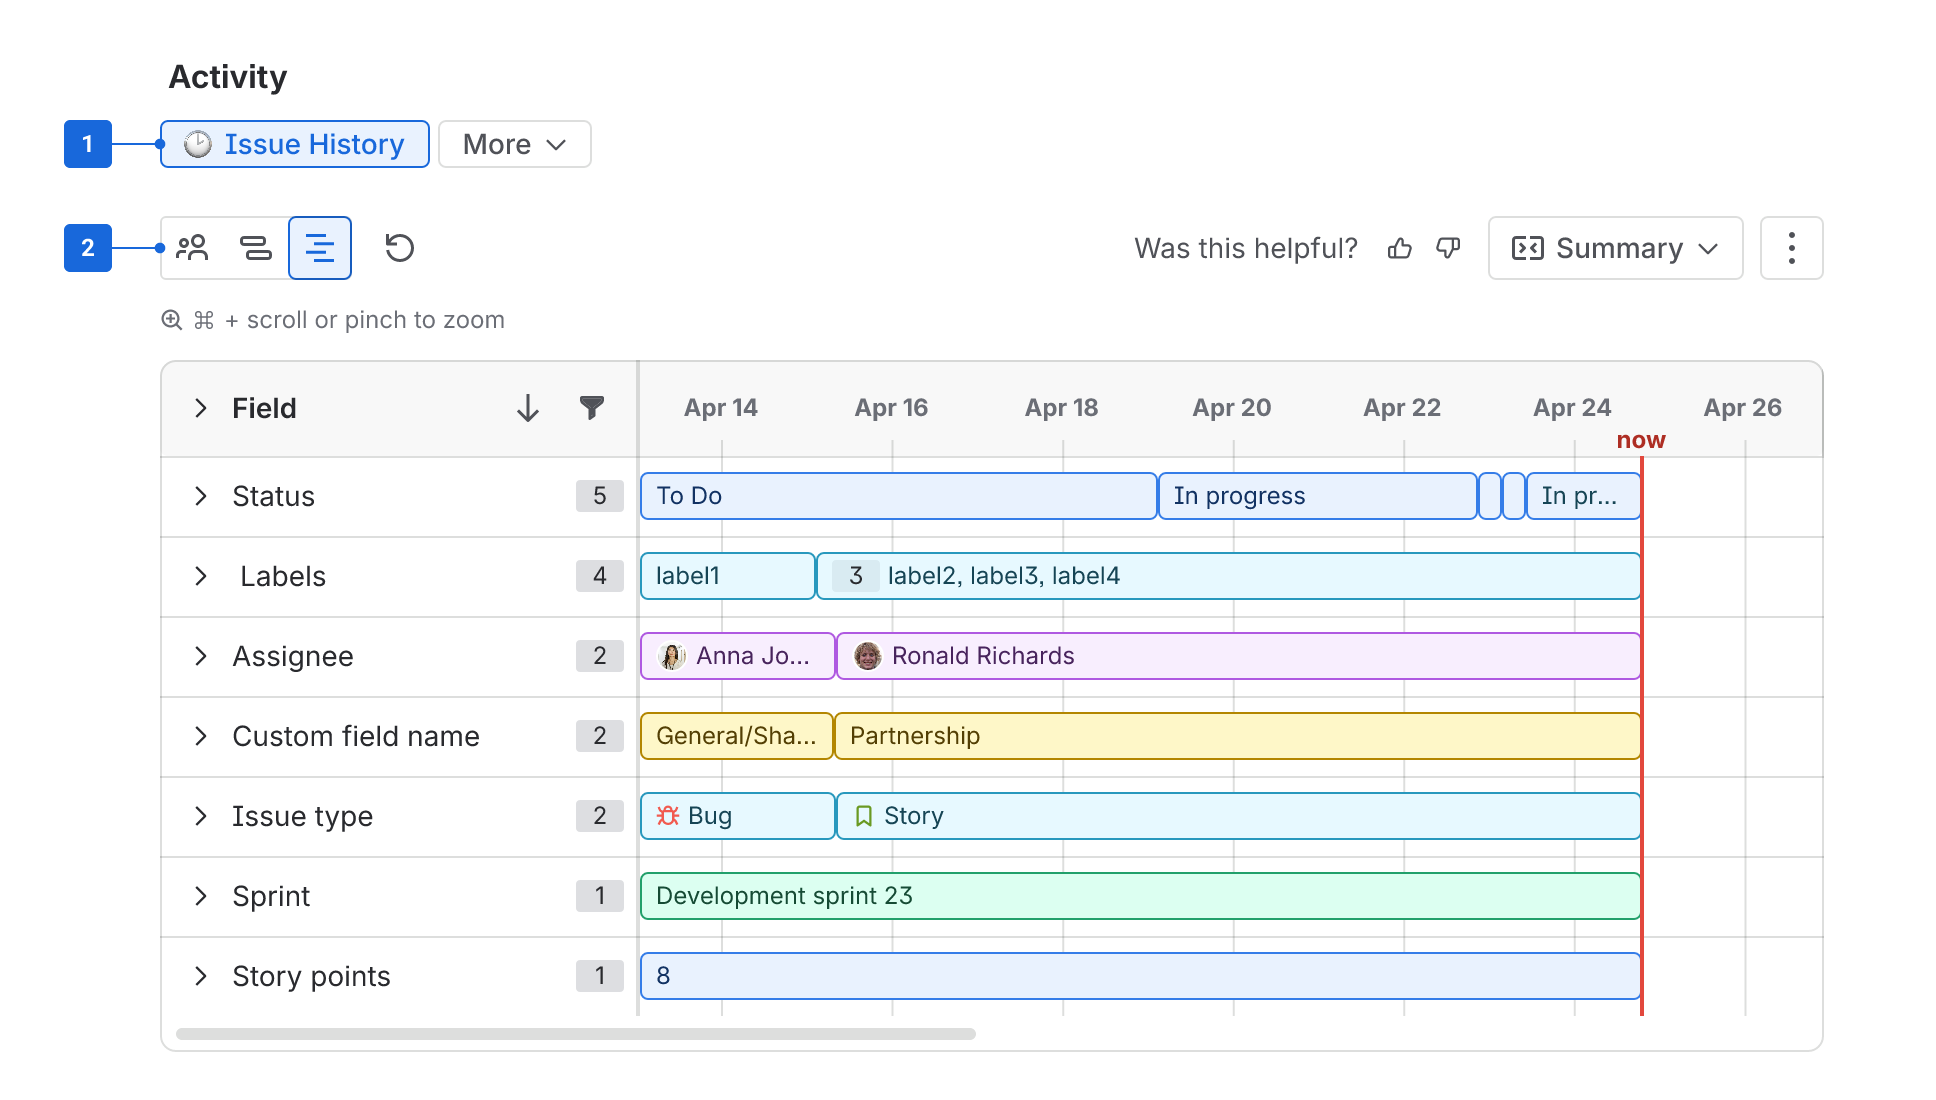
Timeline Chart shows how the fields of a work item changed throughout its life. You can see every value each field had, from when the work item was created until now. This makes it easy to follow status changes, sprint transitions, assignee changes, and more, all in one place.
Reading the chart:
-
Left panel: lists the field names. Each field has a badge showing the total number of values for this field in the current work item.
-
Right panel: shows each field's values as colored sections along a timeline that ends at Now.
-
Hover hints: hover over a section to see its from and to values.
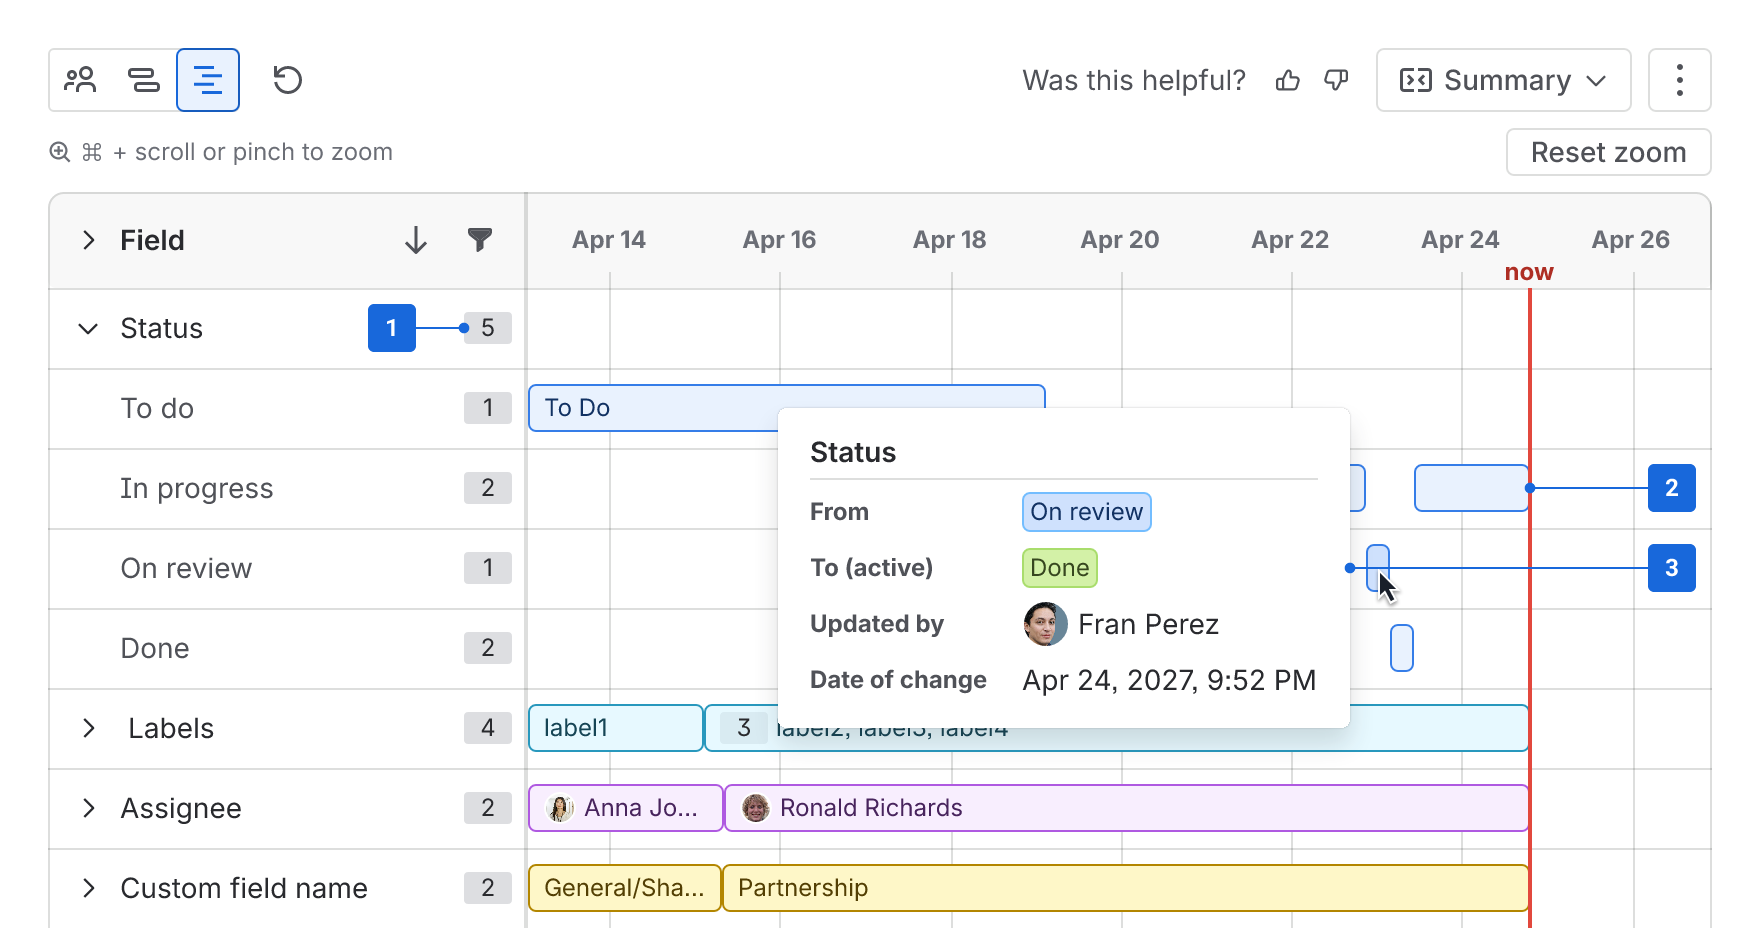
None values: if a field had no value for a period, that period shows as None. This keeps the timeline unbroken.
You can use Fields Filtering to choose which fields appear in the chart:
-
Click Fields Filtering.
-
Select the fields you want to see in the chart.
-
Click Reset to clear your selection and return to the default fields.
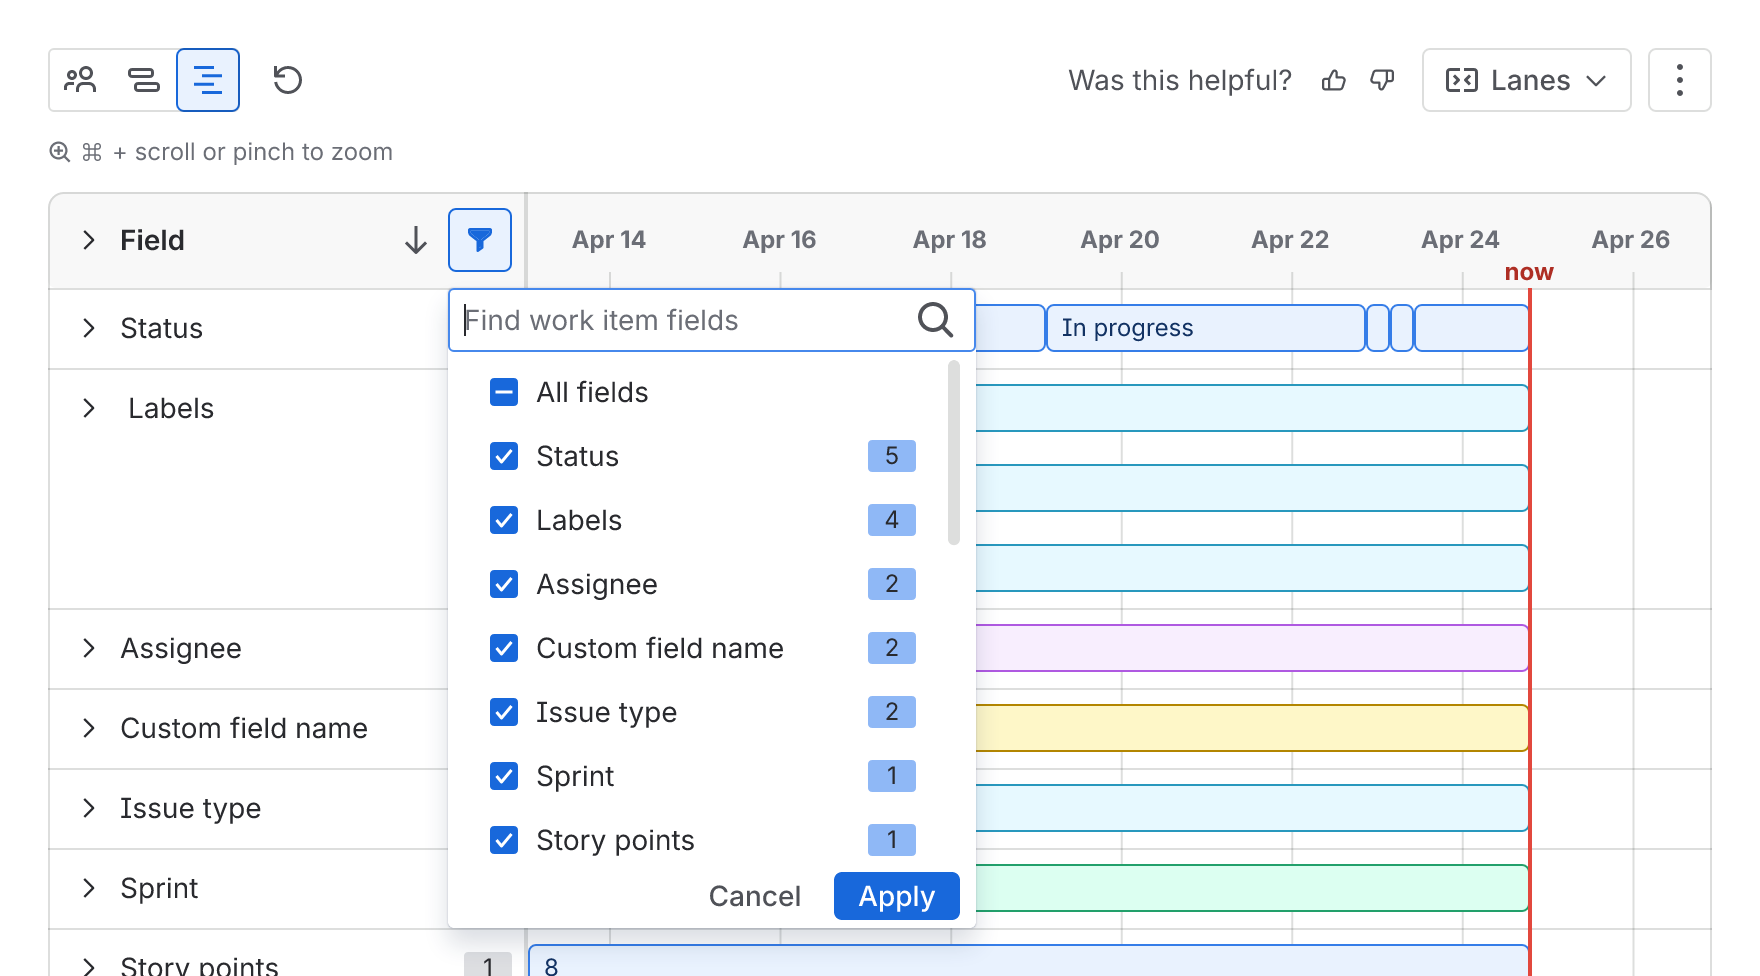
If you don't select any fields, the Timeline Chart shows the default fields.
The following fields are not shown in the Timeline Chart: Summary, Description and other rich-text fields, Work log, Time tracking, Time spent, Progress, URL, Rank, SLA, and Attachments.
The Timeline Chart has navigation controls so you can move through the history:
-
Use the zoom in and zoom out controls to change the level of detail shown.
-
Use the arrows to move backward and forward along the timeline.
-
Hover over a lane or the summary to see a hint text that explains what it shows.
Use the display mode dropdown to choose how collapsed fields look:
-
Summary - All values of a field on a single row.
-
Lanes - Separate rows when a field held several values at once, like multiple labels or fix versions.
Note: The mode only changes collapsed fields. Expanded fields look the same in both modes. To expand or collapse every field at once, use the expand/collapse all button in the header.
.png?cb=1cc463a931a0bea32262cb3c40182a87)
Please note that Issue History Panel View will be stored in work item properties.
Haven't used this app yet? 👉 Then you’re welcome to try it 🚀