
The new View data table option lets you open a detailed table for a metric card, so you can quickly see which work items were included in that metric’s calculation (and their estimation values).
In the report, this is available from the three-dot menu (⋮) in the top-right corner of a metric card.
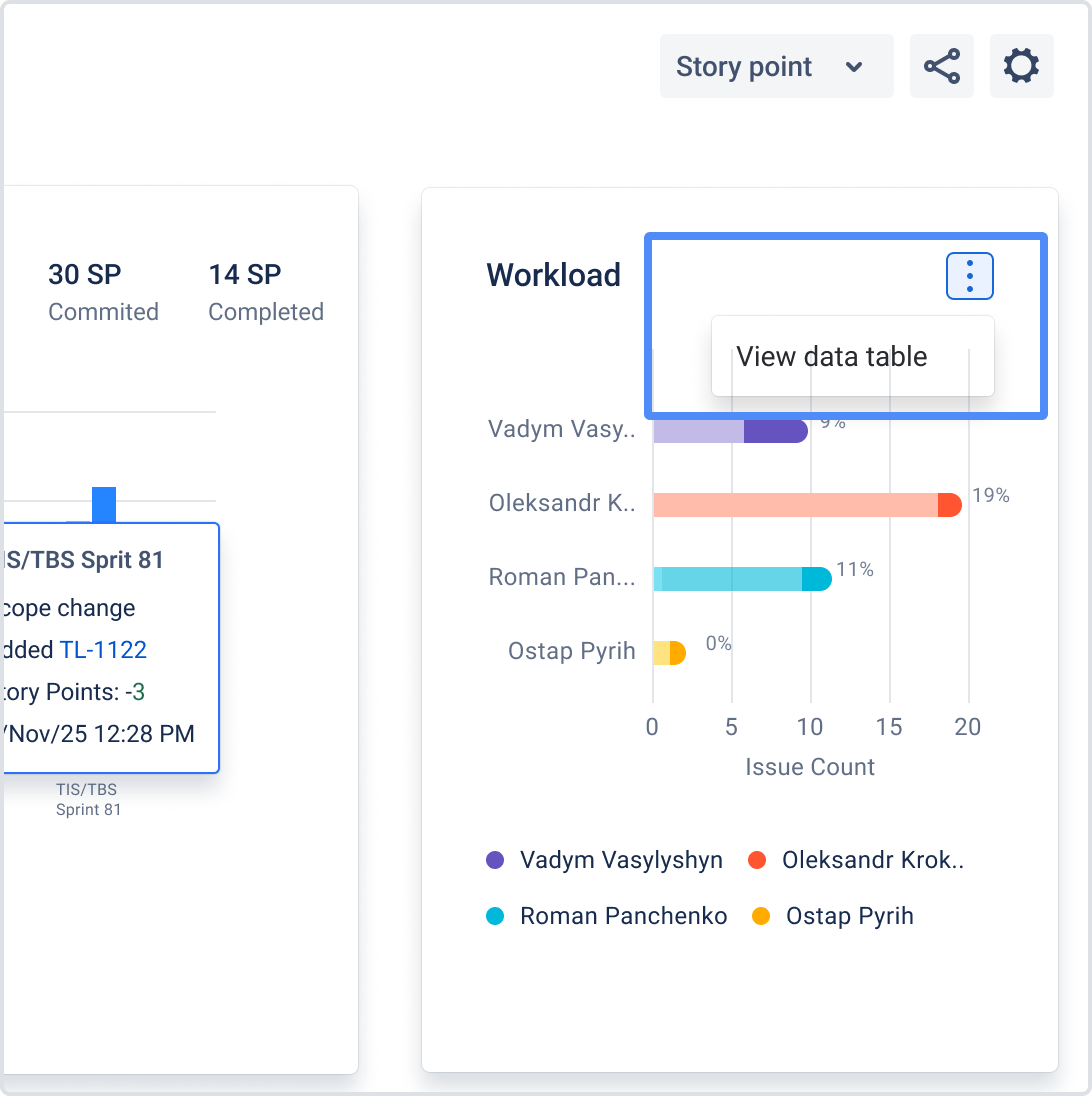
Selecting it opens a modal table.
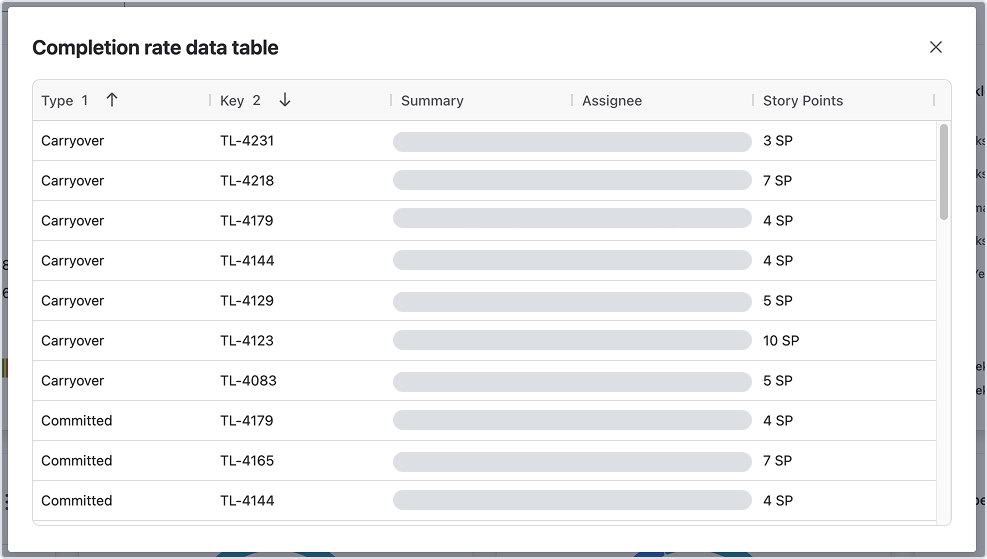
What you can do inside the table
The data table is interactive, so you can:
-
Sort columns: click a column header to sort; click it again to toggle ascending ↔ descending
-
Resize columns: drag the border between column headers
-
Scroll: if there are many rows, you can scroll vertically inside the table
Understanding the Estimation column
The Estimation column label matches the estimation setting used by the board, such as:
-
Story points
-
Original time
-
Item count
If your estimation is Item count / work items, then each work item row counts as 1.
Totals (when shown)
For these two metrics, the table includes a Total row:
-
Committed
-
Completed
How it works
-
The Total row shows the sum of the Estimation column
-
It stays sticky at the bottom while you scroll
-
It shows “Total” in the first column and the aggregated number in Estimation
If you need help or want to ask questions, please contact SaaSJet Support or email us at support@saasjet.atlassian.net
Haven’t worked with the add-on yet? Give it a try