
The Report Summary gives you a quick, clear overview of your report without needing to dig into individual issues.
Instead of analyzing every status, user, or transition, you can instantly see:
-
how many items there are
-
how much time (or count) they take in total
-
and the average value
This helps you understand what’s happening in your workflow at a glance.
Where you can use it
You’ll find Report Summary in such reports:
How it works
-
Click the Report Summary button
-
The system will:
-
open the summary right away if it’s already calculated
-
or quickly calculate it and then open it
-
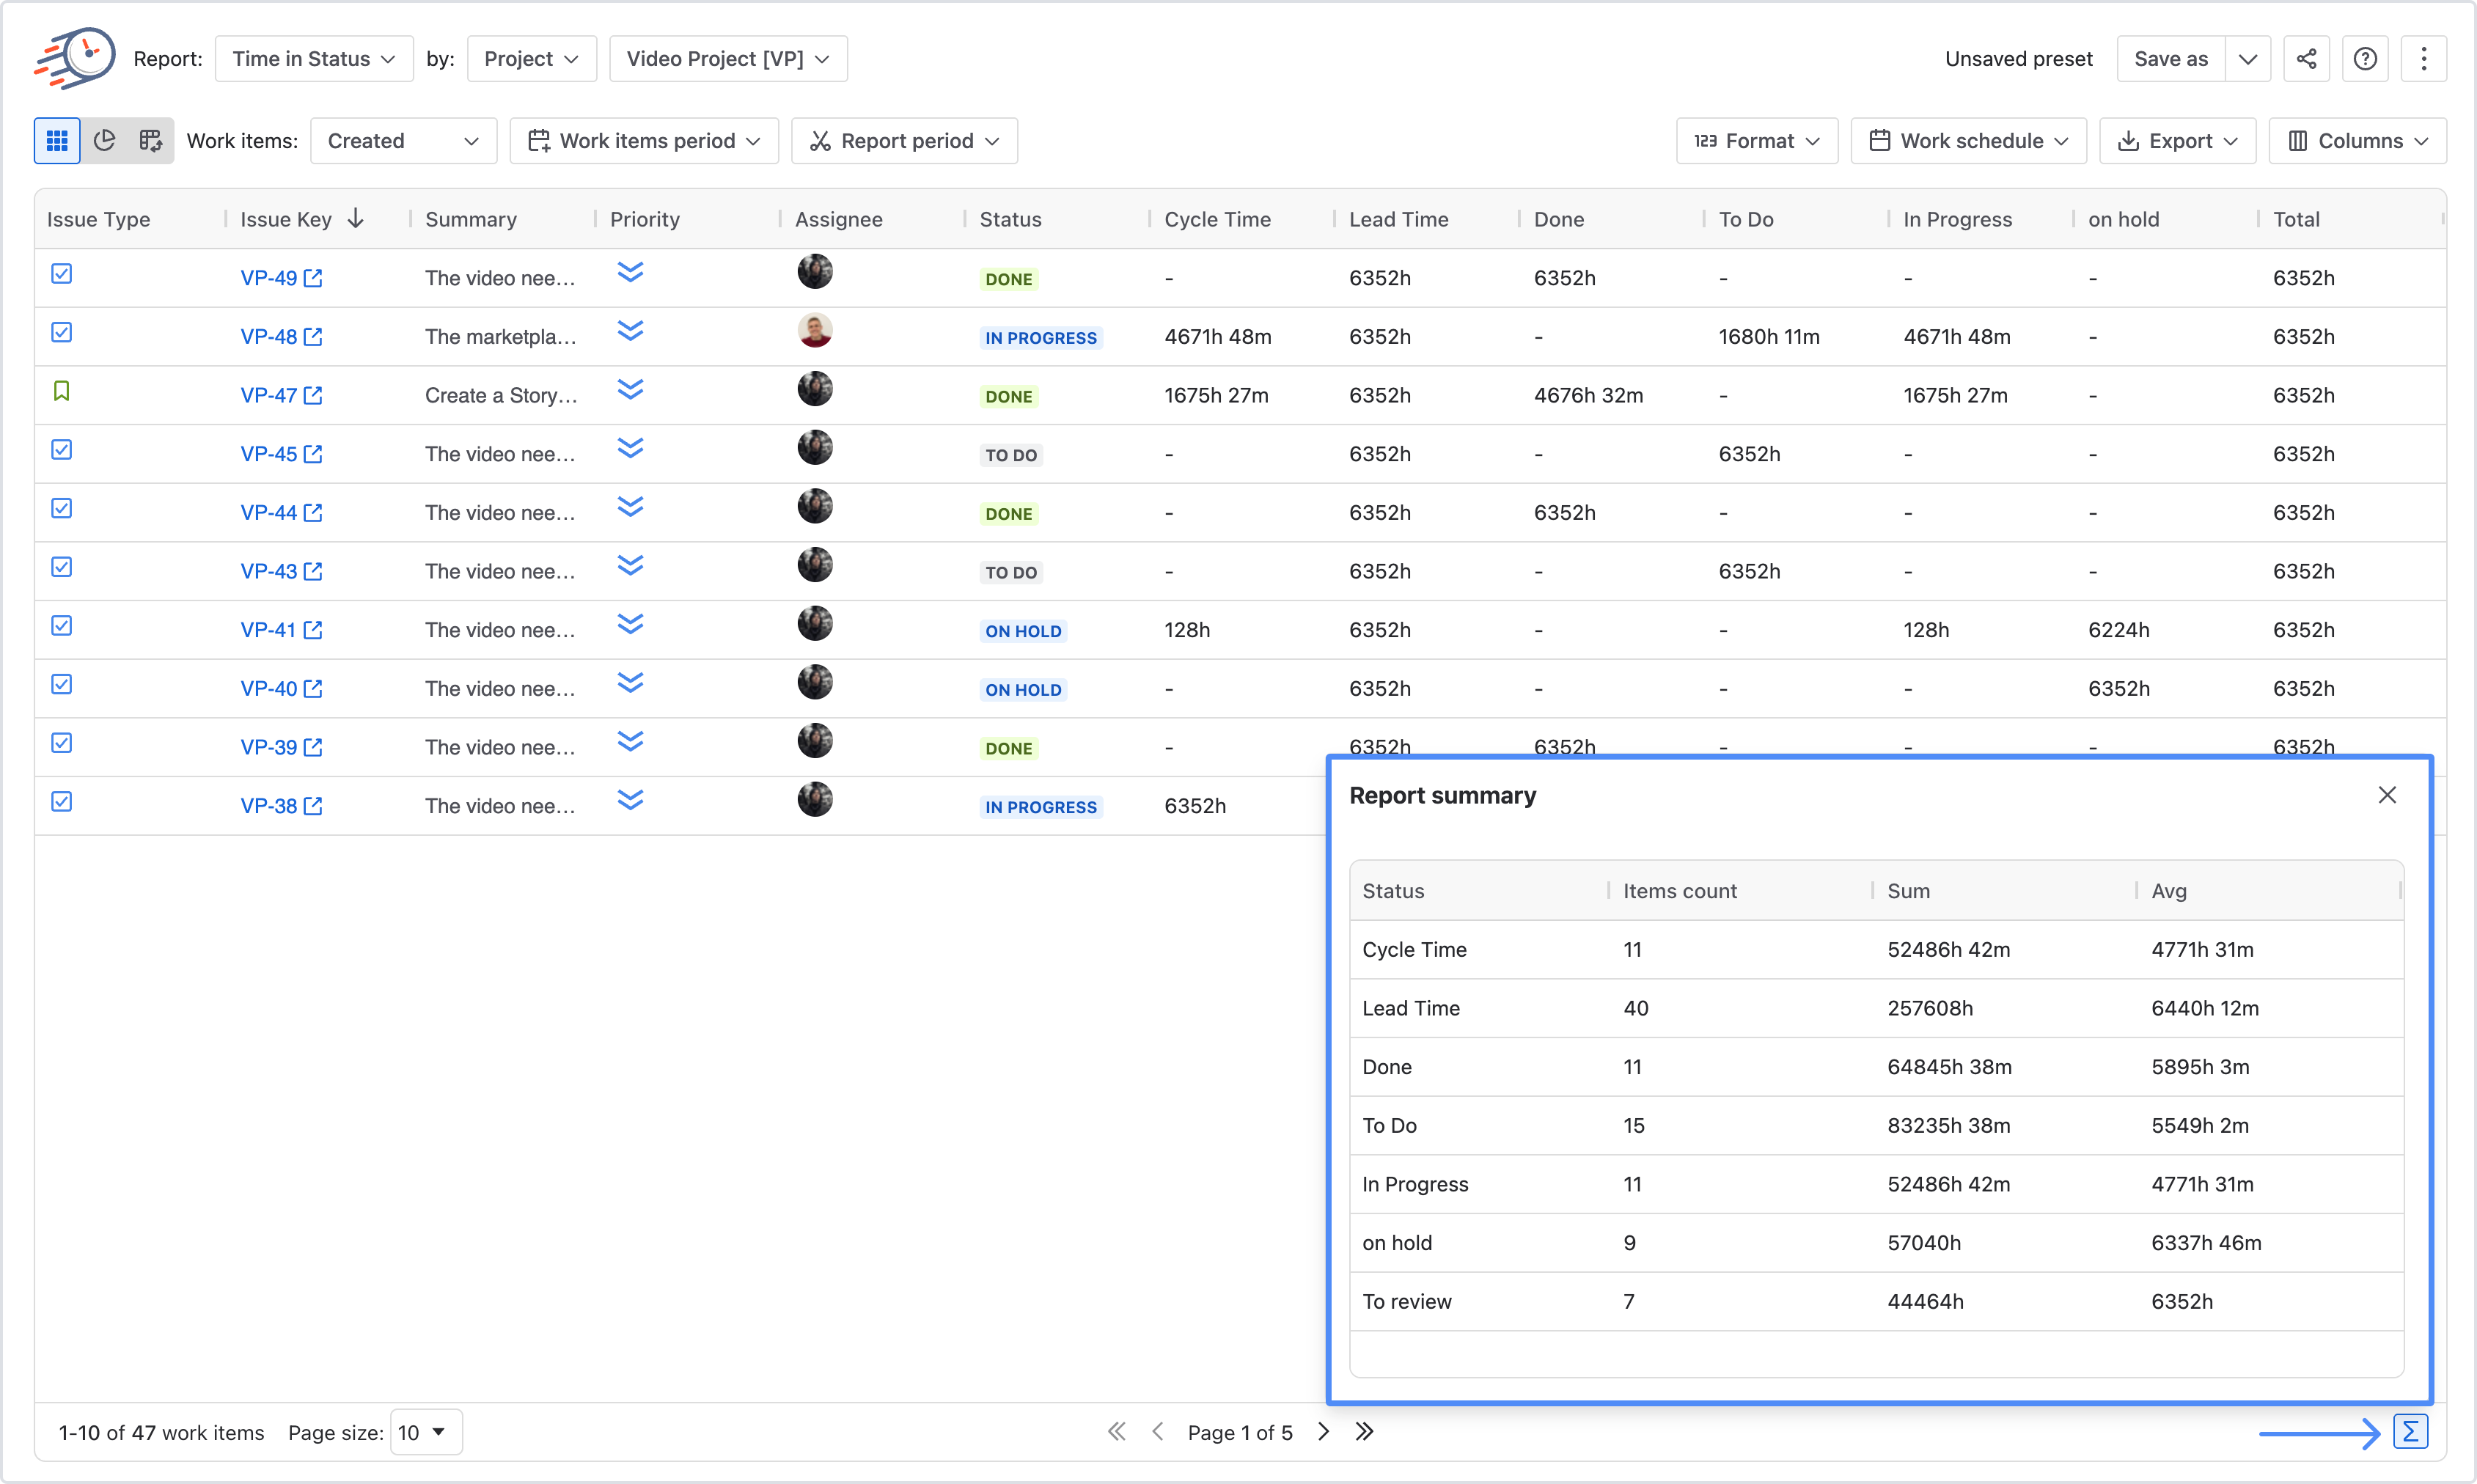
🧮 What you’ll see
The summary shows a simple table with:
-
Items count – how many items are in each group
-
Sum – total time or total count
-
Average – average per item
📑 How the data is grouped
Depending on the report, the table will group data differently:
-
Time in Status / Status Count → grouped by statuses
-
Time in Assignee → grouped by users
-
Transition Count → grouped by transitions
💡 Why it’s useful
With Report Summary, you can:
-
Spot bottlenecks quickly (e.g. where items spend the most time)
-
Compare performance across statuses or team members
-
Get a fast overview without digging into details
-
Make quicker, data-driven decisions
If you need help or want to ask questions, please contact SaaSJet Support or email us at support@saasjet.atlassian.net
Haven't used this add-on yet? Try it now