
Group, summarize, and compare your report data directly inside Time in Status — no spreadsheet export needed.
What is Pivot mode?
Pivot mode restructures the table view of a Time in Status report into a pivot grid: you choose which fields become rows, which spread across columns, and which values get calculated.
It allows you to analyze the same dataset from different angles.
Before you begin
-
Pivot mode is available in the Table view of reports on the Global page and in Dashboard gadgets.
-
Pivot mode is not available for the Average Time and Time in Status per Date reports.
-
Access permissions are the same as for the table view.
-
Pivot mode uses the columns configured in the current report. If you want to pivot by a field that is not displayed, add it as a column in the table first.
Build a Pivot
-
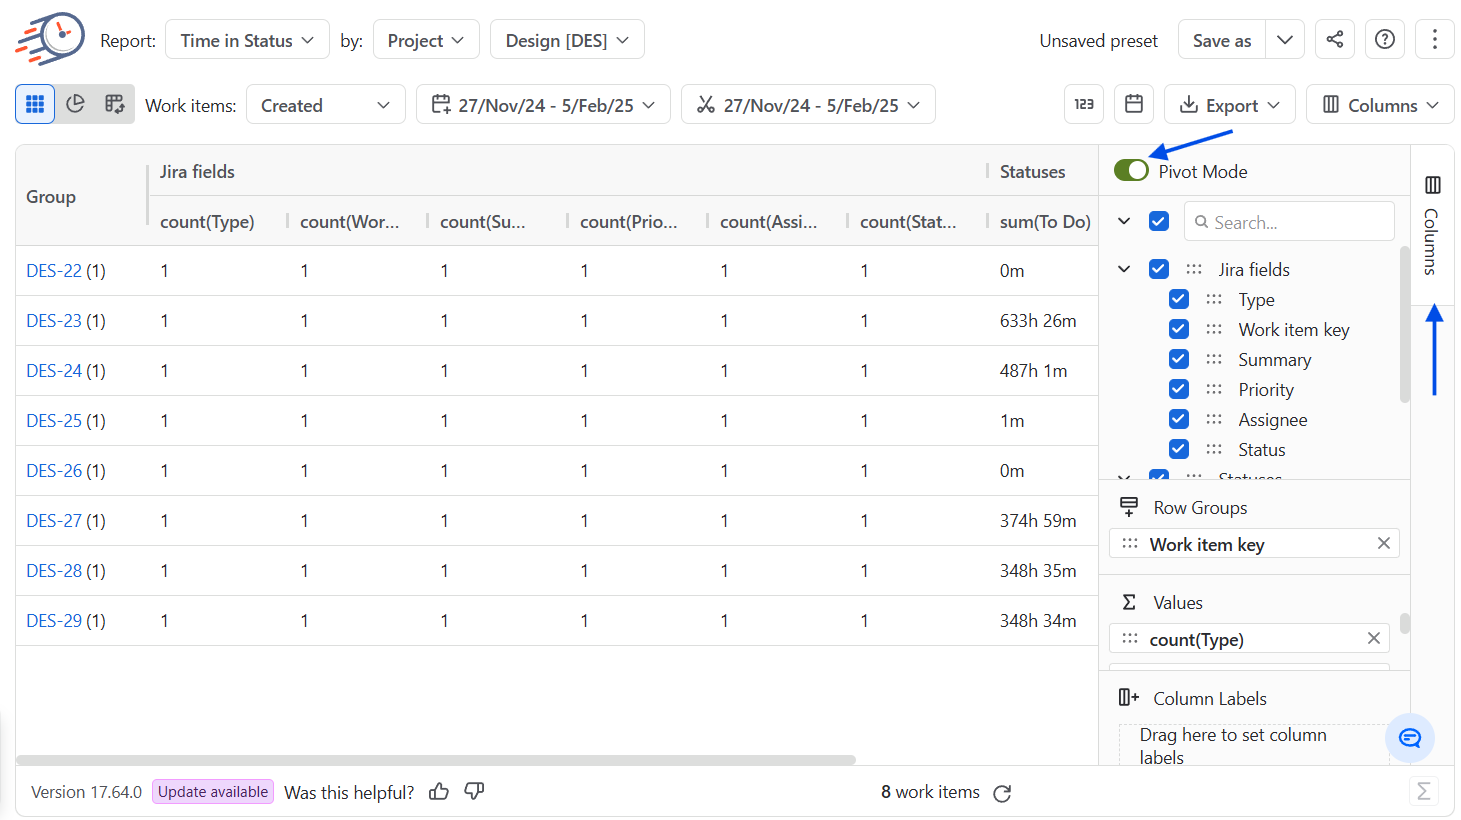
In Table view, open the Columns panel and enable the Pivot Mode toggle.
Time in Status loads the complete dataset before pivoting, so large reports may take a moment.
-
In the side panel, find fields by typing in Search or by browsing the list. Fields keep the same grouping as in the table view — Jira fields, Statuses, Transitions, Users.
-
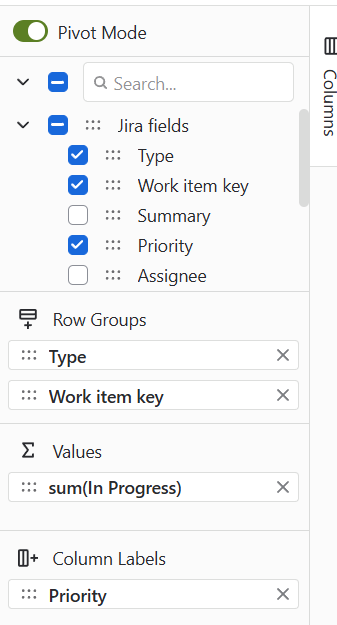
Drag fields into one of the following areas:
-
Row groups — categories for rows, for example Assignee or Project.
-
Values — the numbers to calculate, for example a time in status field.
-
Column labels — categories spread across columns, for example Status.
The grid updates after every change.
-
For each field in Values, pick an aggregation. The available options and the default depend on the field type — see the table below.
-
If you need more workspace, collapse the side panel without leaving Pivot mode.
-
To return to the regular table, disable Pivot mode. Your current pivot configuration is kept and restored the next time you enable it.
Aggregations by Field Type
|
Field type |
Available aggregations |
Default |
|
Number |
Sum, Min, Max, Count, Average, Median |
Sum |
|
Date / Date-Time |
Min, Max, Count |
Min |
|
Text and other field types |
Count |
Count |
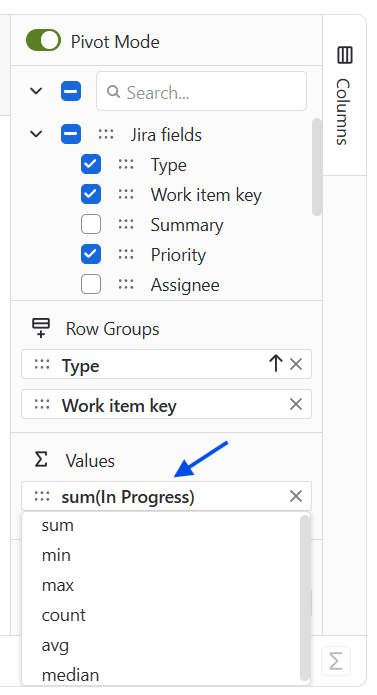
Only aggregations supported by the selected field are displayed.
Filters, saving, and export
Pivot mode uses the current report configuration: the JQL filter, work items filter and period, report period, and work schedule. When any of these settings change, the report data is refreshed automatically.
Your setup is remembered per report — row groups, column labels, values, aggregations, and whether you last used table or pivot mode are all restored when you return, including in a new session. In saved reports, save the report again to keep changes to its pivot configuration.
Export works the same way as in the table view: download the pivot as CSV or XLSX. The file contains exactly what you see — current groups, filters, and aggregations at the moment of export.
Limitations
-
Report summary is not available while Pivot mode is on.
-
The maximum Pivot table size is determined by the browser's rendering limit for the generated table height rather than by a fixed row limit.
|
Browser |
Maximum table height |
Approximate number of rows |
|---|---|---|
|
Chrome |
~32,000,000 px |
~800,000 |
|
Edge |
~32,000,000 px |
~800,000 |
|
Firefox |
~32,000,000 px |
~800,000 |
|
Safari |
~16,000,000 px |
~400,000 |
If you need help or want to ask questions, please contact SaaSJet Support or email us at support@saasjet.atlassian.net
Haven't used this add-on yet? Try it now