
📝 Context: A grant-making team — a public agency, foundation, or NGO — runs its application review in Jira. Applications move through many hands (eligibility, compliance, expert review, committee decision, disbursement), decisions are often bound by legal or donor deadlines, and stakeholders regularly ask why a decision is taking so long. The status history is already in Jira, but the time each stage actually consumes stays hidden.
|
🤔 User Problem: Grant workflows are multi-stage and cross-departmental. When an application sits too long, it's hard to say where the time actually went — was it stuck in Compliance Review, waiting on the applicant, or waiting for the next committee meeting? Without a clear view of time between statuses, teams can't answer applicants, report processing times to auditors, or catch a stalled application before a deadline is missed. What's needed is a way to measure how long each stage takes and where applications wait — directly in Jira. |
|---|
A typical grant workflow in Jira might look like this:
Application Submitted → Eligibility Check → Compliance Review → Expert Review → Committee Decision → Approved → Funding Disbursed → Monitoring & Reporting
How to configure it
Step 1. Create all the metrics your workflow needs
Start by setting up every time metric that matters for your grant process, so the whole workflow is covered before you begin analyzing. Each stage you care about — end-to-end wait, internal processing, compliance, decision, disbursement — becomes its own metric.
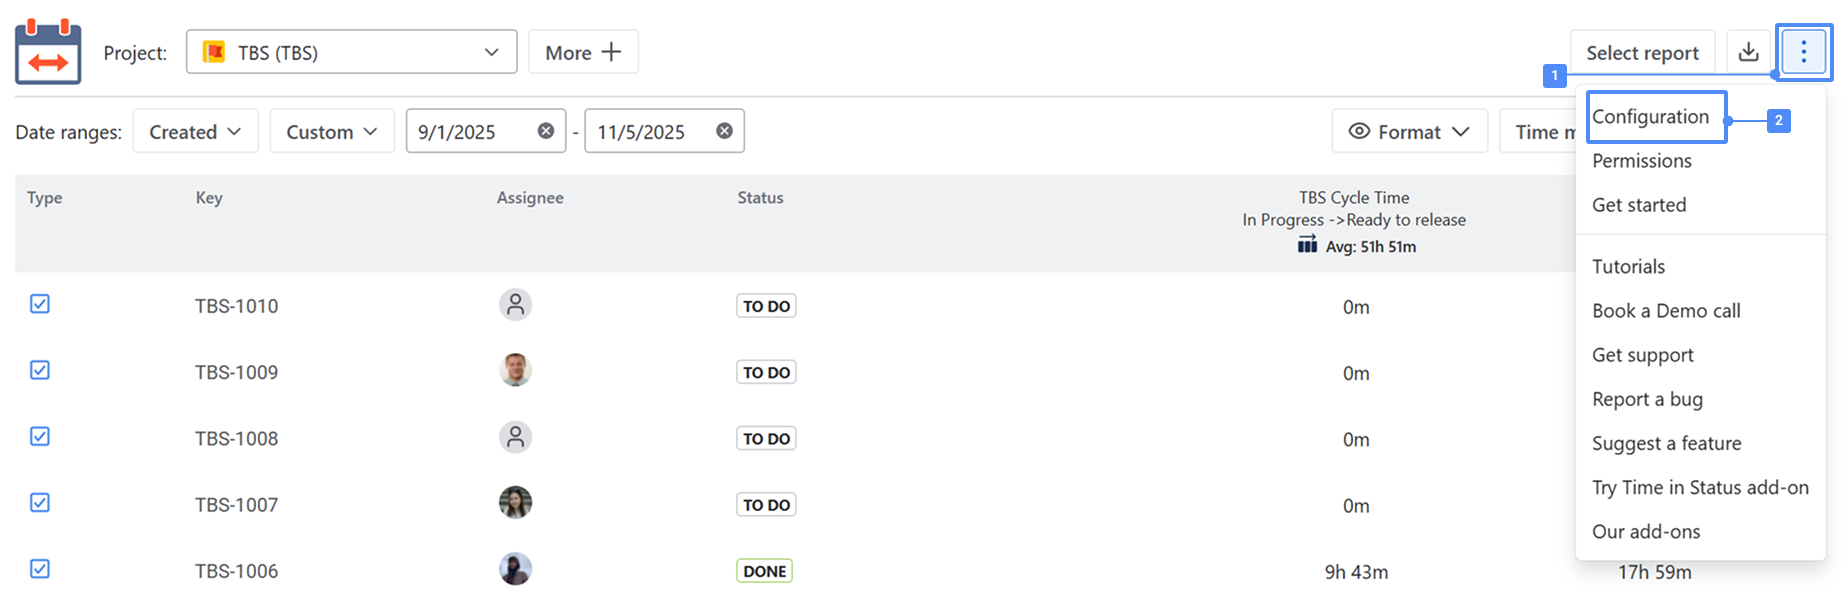
Open Configuration — available from the three-dots menu (⋯) in the top-right corner of the report screen, or from the left sidebar under the Time Metrics Tracker section — then click + Time metric. (You can also open the Time Metrics button above the grid.)
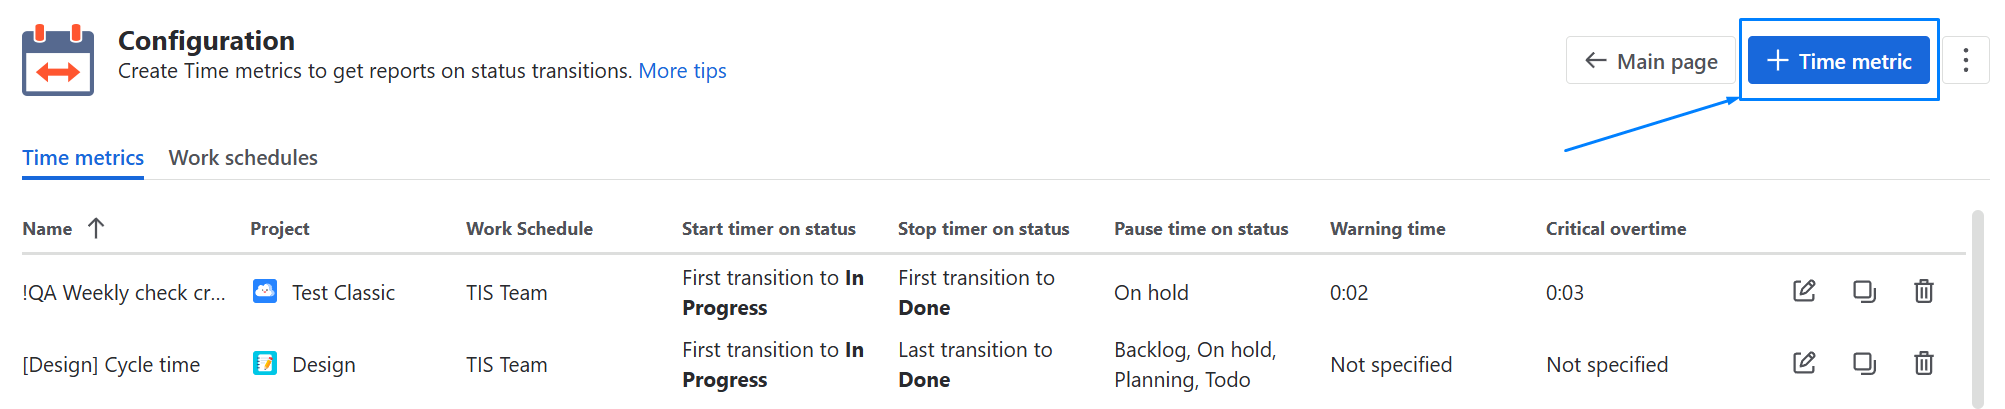
In the configuration window, for each metric:
-
Name the metric and select the project.
-
Choose a Work schedule so the calculation counts only working hours — useful when processing targets or SLAs are defined in business days rather than calendar days.
-
Set the From status and To status, and pick the transition option (First / Last transition to status) to define when the timer starts and stops.
-
Add Exclude statuses to pause the count while an application is legitimately waiting outside your team's control — for example Pending Applicant Input or On Hold. This keeps the metric focused on the time your team is actually responsible for.
-
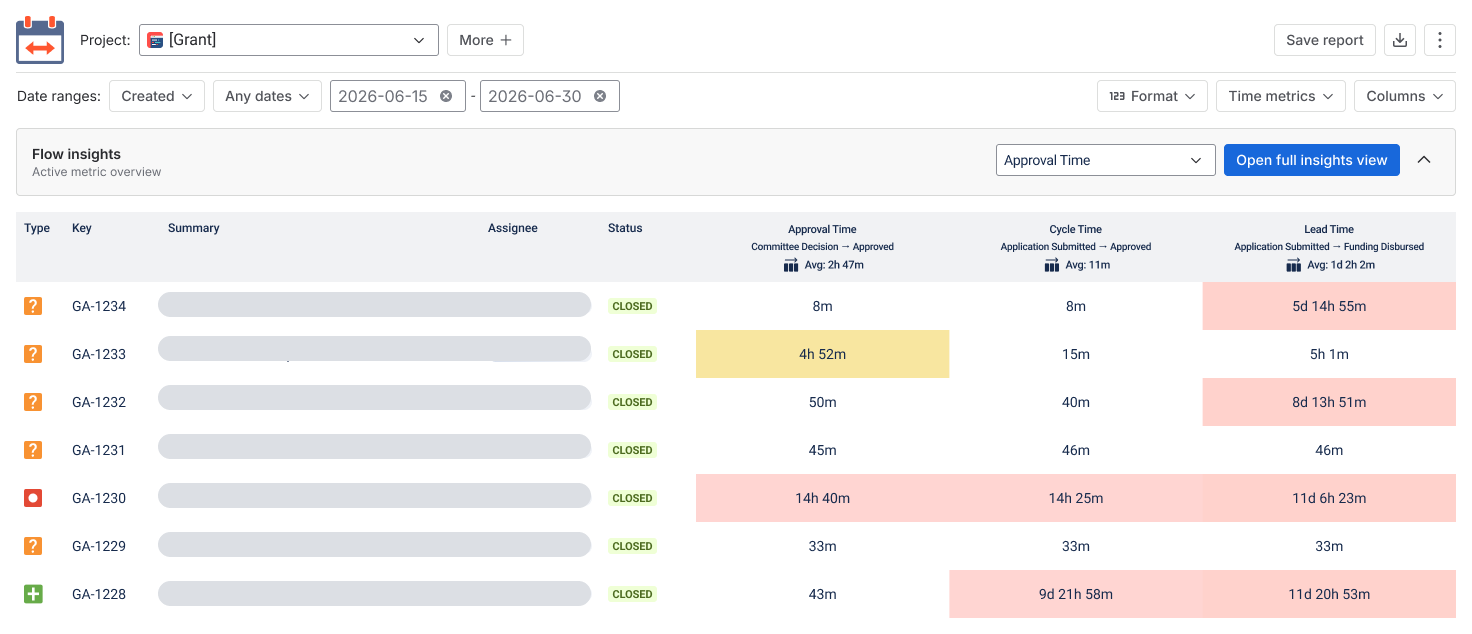
In Time metric alerts, set Warning and Critical limits. Applications that exceed them are tagged visually — yellow for warning, red for critical — so approaching deadlines are easy to spot in the grid.
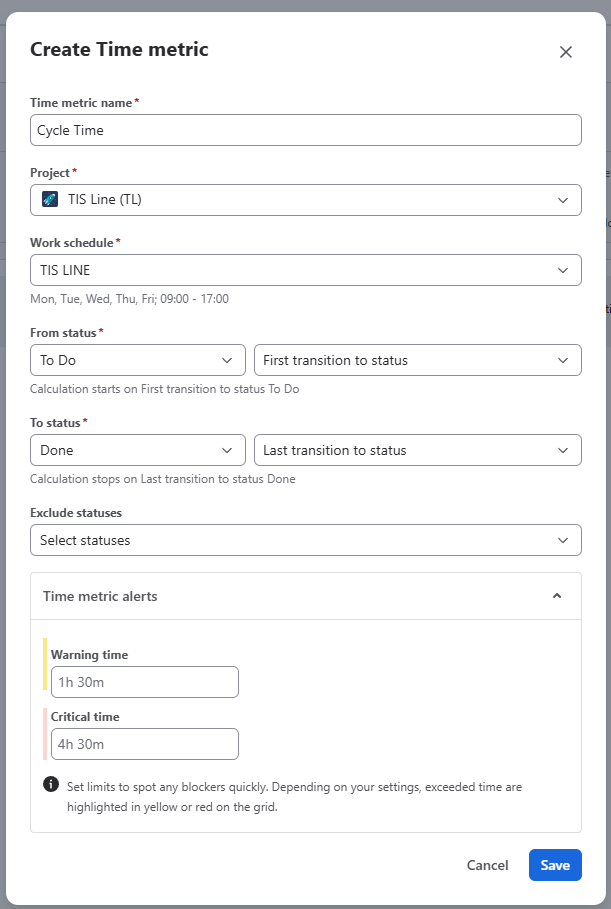
Click Save, then repeat for the next metric.
A set worth creating for a grant workflow:
|
Metric |
On this workflow |
What it tells you |
|---|---|---|
|
Time Between Statuses |
Any two milestones, e.g. Application Submitted → Eligibility Check |
How long each step of the review takes |
|
Time in Status |
A single stage, e.g. Compliance Review or Expert Review |
Which stage applications sit in longest |
|
Cycle Time |
Application Submitted → Approved |
Total time to evaluate and decide a grant |
|
Lead Time |
Application Submitted → Funding Disbursed |
The real, end-to-end wait an applicant experiences |
|
Approval Time |
Committee Decision → Approved |
Efficiency of the decision-making bodies |
|
Blocked Time (optional) |
Time in a hold status, e.g. On Hold / Pending Applicant Input |
Delays from missing documents or inter-agency waiting |
Blocked Time applies only if your workflow includes a waiting status. The linear example above doesn't have one — add On Hold or Pending Applicant Input to the workflow if you want to measure it. On end-to-end metrics like Cycle Time or Lead Time, you can then add that status under Exclude statuses so waiting time outside your team's control doesn't count against your processing figures.
Step 2. Analyze the metrics
Once all your metrics are set up, there are two ways to work with them, depending on whether you want the whole picture or a deep dive into one metric.
On the grid — see all metrics at once. Every metric you created appears as its own column, so you can scan the full workflow side by side and compare applications across stages in a single table. Adjust the date range, project, and time format to focus the report, and use Warning/Critical tagging to surface applications that are running long. This is the view for a quick overview and for exporting audit-ready data.
In Flow Insights — analyze each metric on its own. When one metric needs a closer look, open Flow Insights and select that metric to review its health for the chosen project and period in one connected view. Flow Insights works with the selected metric at a time, so you analyze the workflow one dimension at a time and in depth. For a grant workflow, it helps answer:
-
Trend — Is processing time for this metric trending up, staying stable, or improving across the period?
-
Status contribution — Which stage consumes the most time? For example, whether most of Lead Time is spent in Compliance Review, Expert Review, or waiting for the next Committee Decision.
-
Work in Progress — Are too many applications active at once, and are any aging in a stage longer than expected?
-
Scatter plot — Are long processing times spread across many applications, or concentrated in a few outliers that need direct attention?
.png?cb=3fdf2b9afc2f8161dc2483d08f7361e0)
Each chart lets you drill down into the specific applications behind a data point and open them in Jira, so you can move from "this stage is slow" to "these are the applications to look at."
Step 3. Set up a dashboard for ongoing monitoring
Add gadgets to a Jira dashboard so the review committee and administrators can monitor processing without opening the app each time:
-
Time Metric Trend Gadget — watch whether a selected metric (e.g., Lead Time) is drifting over quarters.
-
Status Contribution Chart Gadget — see how tracked time is distributed across stages.
-
WIP Run Chart — watch active application volume and spot pressure building.
-
Scatter Plot Gadget — surface outliers across the review period.
-
Agile Metrics Dashboard Gadget — keep headline metrics visible for stakeholder updates.
Dashboard gadgets help you monitor and report the metrics; the metrics themselves are calculated from your configured time-metric settings.
|
📈 Outcomes: You can see how long each stage of grant review actually takes, separate your team's processing time from time spent waiting on applicants, and identify which stage contributes most to delays — directly in Jira. Warning and Critical limits help you catch applications approaching a deadline before it's missed, and the report data can be exported to Excel or Google Sheets for audit-ready records and stakeholder reporting. Time Metrics Tracker helps teams find where applications wait and investigate delays. |
|---|
Haven't used this app yet, then try it now!
If you need help or want to ask questions, please contact SaaSJet Support or email us at support@saasjet.atlassian.net