
Time Metrics Tracker provides a Rovo agent that helps you get information about your configured time metrics and understand how much time your Jira work items spend according to a selected metric — directly in Rovo, in natural language.
Rovo agent can analyze a metric across many work items at once, and summarize what it finds as insights and recommended actions — so you can quickly see where time is building up and which issues are worth a closer look, without opening the app or exporting data.
What can the Time Metrics Tracker Rovo Agent do?
-
Available metric names — see which time metrics are configured in your instance.
-
Elapsed time for a single work item — check the current time result for one issue.
-
Metric analysis across many work items — calculate a metric for a set of issues.
-
Insights and recommended actions — a short read-out of what stands out and what to check next.
-
Configuration guidance — step-by-step help on setting up and editing metrics.
Available metric names
Ask which metrics are configured in your instance, such as Cycle Time, Lead Time, Resolution Time, or any custom metric.
Show me all available time metrics.
Elapsed time for a single work item
Ask how much time a specific work item has accumulated according to a metric.
How much time has DEV-123 spent according to Cycle Time?
The agent replies with the metric, elapsed time, and current status — for example: DEV-123 is monitored by "Cycle Time". Elapsed time: 2h 30m. Current status: In Progress.
Analyze a metric across many work items
Ask the agent to calculate a metric for a group of work items — for example a whole project, a recent period, or issues in a specific status category. It builds the query from your request and returns the results together.
Show Lead Time for all issues in project MARC updated in the last week.
Tip: Larger sets take longer to calculate. Add conditions (project, status category, date range) to keep the scope focused.
Insights and recommended actions
When the agent analyzes many work items, it can summarize the results — pointing out what stands out and suggesting what to check. This helps you interpret and prioritize without scanning a long list of issues yourself: which items are driving the numbers up, whether values are still growing, and where the data points to a setup or scope problem rather than a real delay.
The read-out is a fast first pass, not a decision. Confirm anything important in the app's reports, gadgets, or Flow Insights before acting. Because it reflects the exact metric, project, and scope you asked about, changing the scope changes the observations.
Example
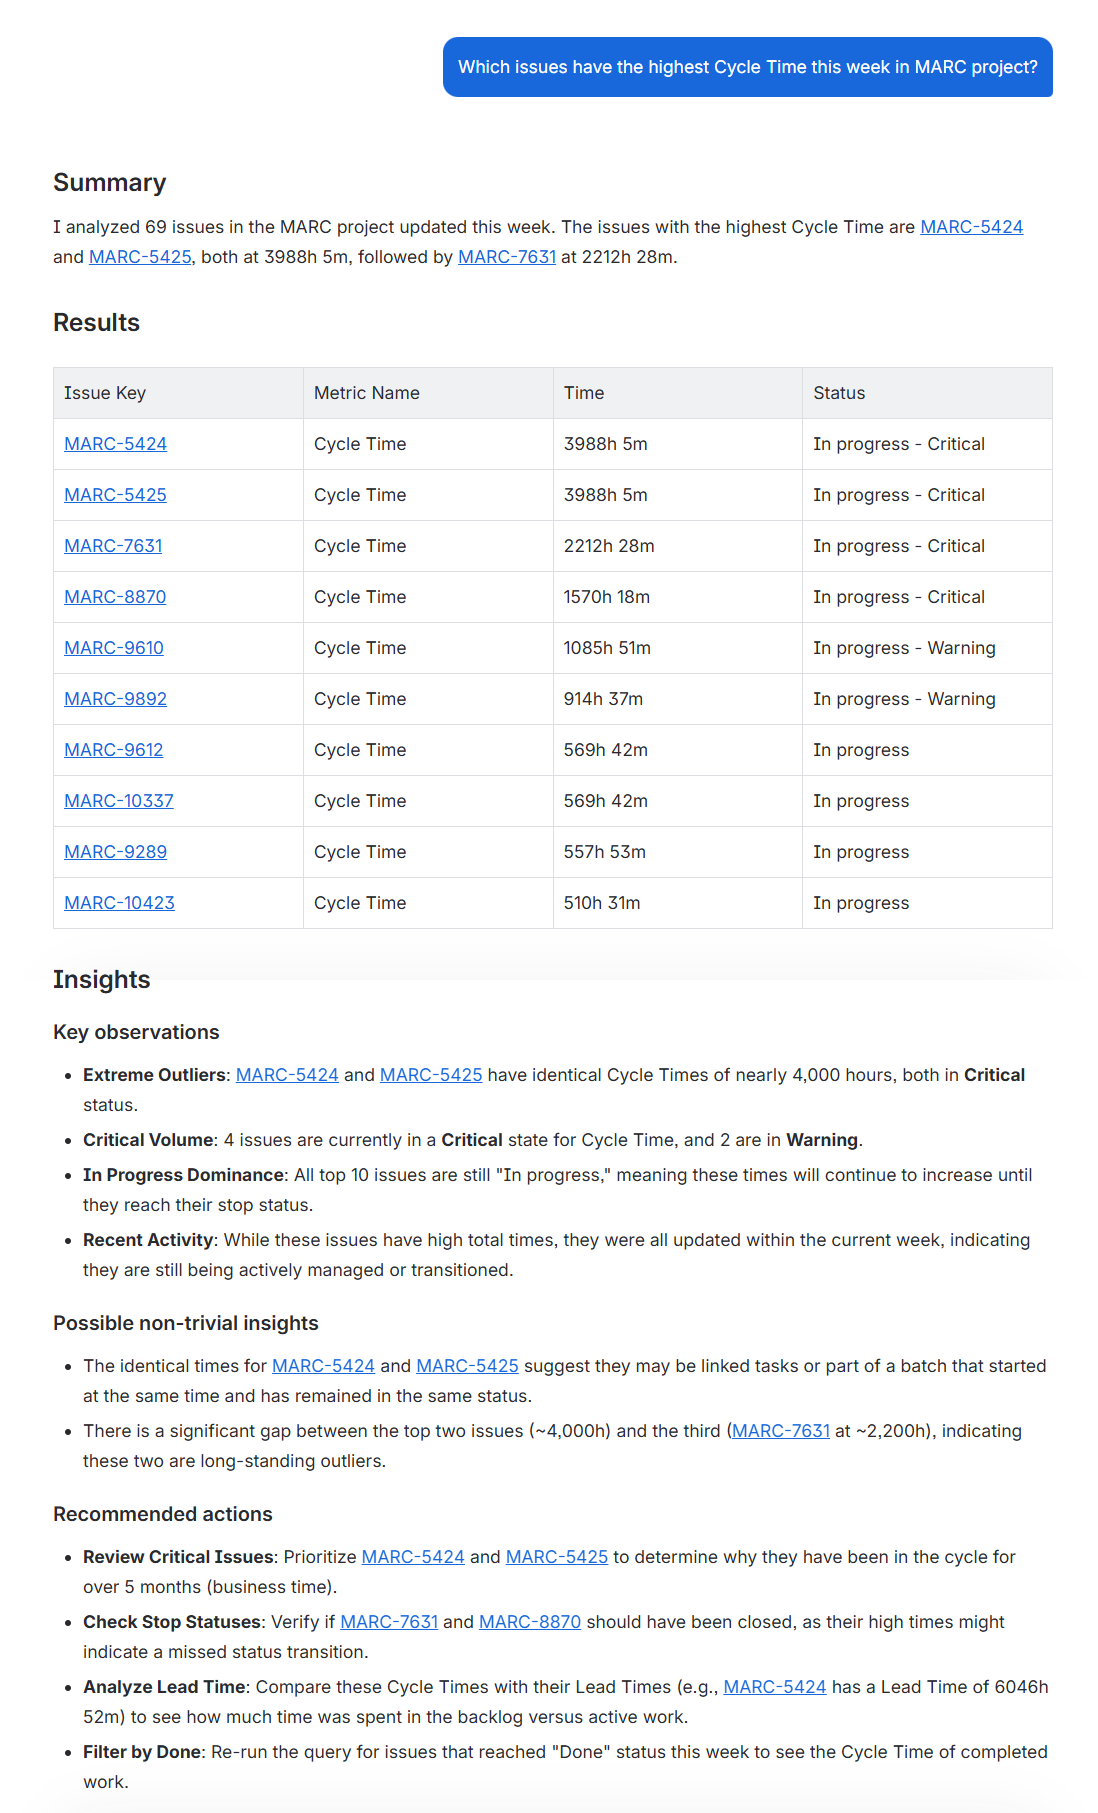
Example output. Actual observations depend on your workflow, metric configuration, and data.
Configuration guidance
The agent can also provide step-by-step guidance on how to configure Time Metrics Tracker.
You can ask how to:
-
create a new time metric;
-
choose start, stop, and pause statuses;
-
select a work calendar;
-
set warning and critical time limits;
-
edit an existing metric;
-
configure alert recipients.
Good to know / limitations
-
Results reflect your metric configuration. Elapsed times depend on the start, stop, and pause statuses and the work calendar defined for the metric. If a value looks unexpected, check the metric setup first.
-
Timers keep running for active items. Work items still in a start-to-stop range will keep accumulating time, so their values change over time.
-
The agent analyzes a sample of up to 250 work items per request. If your query matches more, narrow the scope (project, status category, date range) so the results cover the issues you care about.
-
Insights are a summary, not a decision. The agent highlights patterns and suggests what to check. Confirm anything important in the app's reports, gadgets, or Flow Insights before acting.
-
Large sets take longer. For big queries, expect a longer response and consider adding filters to keep the scope focused.
How does it help?
The Time Metrics Tracker Rovo Agent is useful when you need a quick answer, a fast read of how a metric is behaving across a set of work items, or simple setup guidance — without searching through app settings, building a report, or exporting data.
How to find the agent
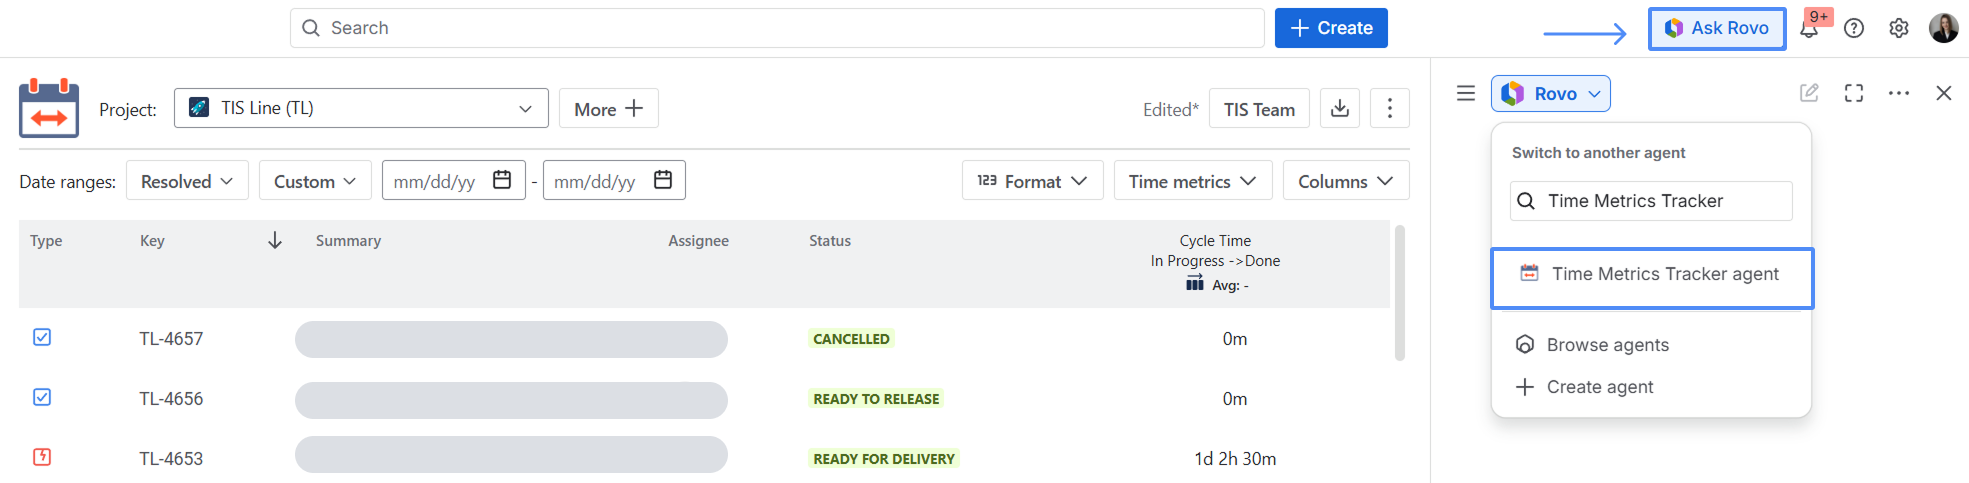
To open the Time Metrics Tracker Rovo Agent:
-
Open Jira.
-
Click Ask Rovo.
-
Go to Agents or View all agents.
-
Search for the Time Metrics Tracker agent.
-
Open the agent and enter your question.
Prompt examples
Metrics and single work items
Show me all available time metrics. What time metrics are configured in Time Metrics Tracker? How much time has DEV-123 spent according to Cycle Time?
Analyzing many work items
Show Lead Time for all issues in project MARC updated in the last week. Which issues have the highest Cycle Time this month?
Insights and next steps
Analyze Lead Time for project MARC and tell me what stands out. Show the same results in business days.
Configuration
How do I create a new time metric? How can I edit an existing metric? How do I configure warning and critical limits? How do I exclude On Hold time from a metric?
If you need help or want to ask questions, please contact us through SaaSJet Support or via email support@saasjet.atlassian.net
Haven't used this app yet? Try it now! >>>