Track Time in Engineering in Jira
📝 Context: An engineering team working on software development projects wants to gain better insights into how long tasks spend in the engineering phase to optimize development cycles and ensure smooth project delivery.
🤔 User Problem: Engineering efforts can often take longer than expected, which can create bottlenecks and slow down the entire delivery pipeline. Without clear tracking, it's hard to identify where time is being spent or wasted in the development process. |
|---|
Before we begin, let’s clarify what Time in Engineering means.
Time in Engineering refers to the amount of time a work item or task spends in the development phase. This includes the period from when the task is assigned to the engineering team until it’s moved to the next stage, such as testing or review. Monitoring this metric helps to keep the development process and identify delays early.
💡 Solution: Calculate and visualize Time in Engineering by tracking the relevant statuses using the Time Metrics app.

How to Configure Time in Engineering?
Click on the Time metrics button and choose Create Time metrics
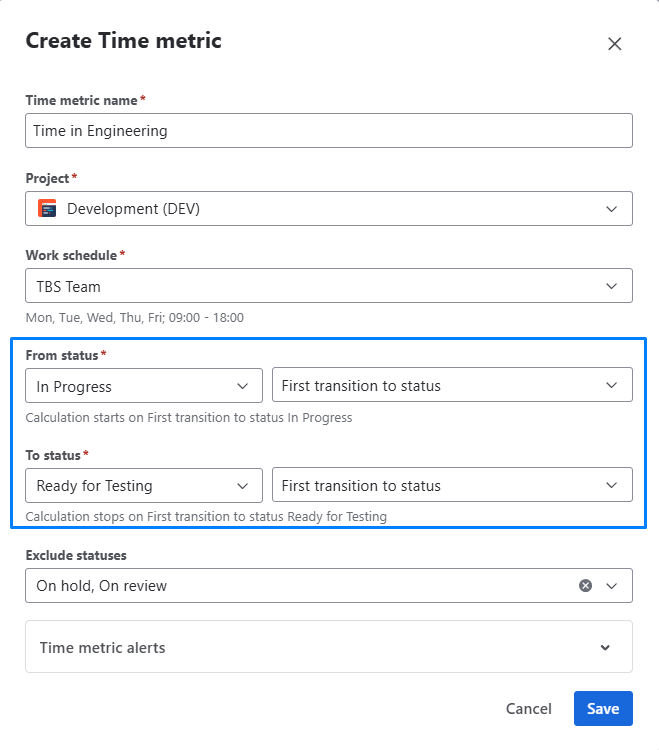
Set Start/Stop Statuses for Calculation:
Start status: Choose the status when a work item enters the engineering phase (e.g., "In Progress," "Engineering," or "Development").
Stop status: Set the status when development is complete (e.g., "Ready for Testing," "Code Review," or "Done").

Optional: Configure Pause Statuses: If development is paused for external reviews or approvals, configure pause statuses like "Waiting for Input" to stop the clock during such times.
Granular Data: Configure first/last transitions to/from statuses for more detailed insights, such as when the task was first picked up by the engineering team or when it was marked as ready for review.
Set Warning/Critical Limits: Define acceptable time limits for how long a task should remain in engineering.

Customizing Reports:
Adjust settings like project type, date range, and time format to match your team's needs.
Use the multi-calendar feature to account for non-working hours and different time zones if needed.
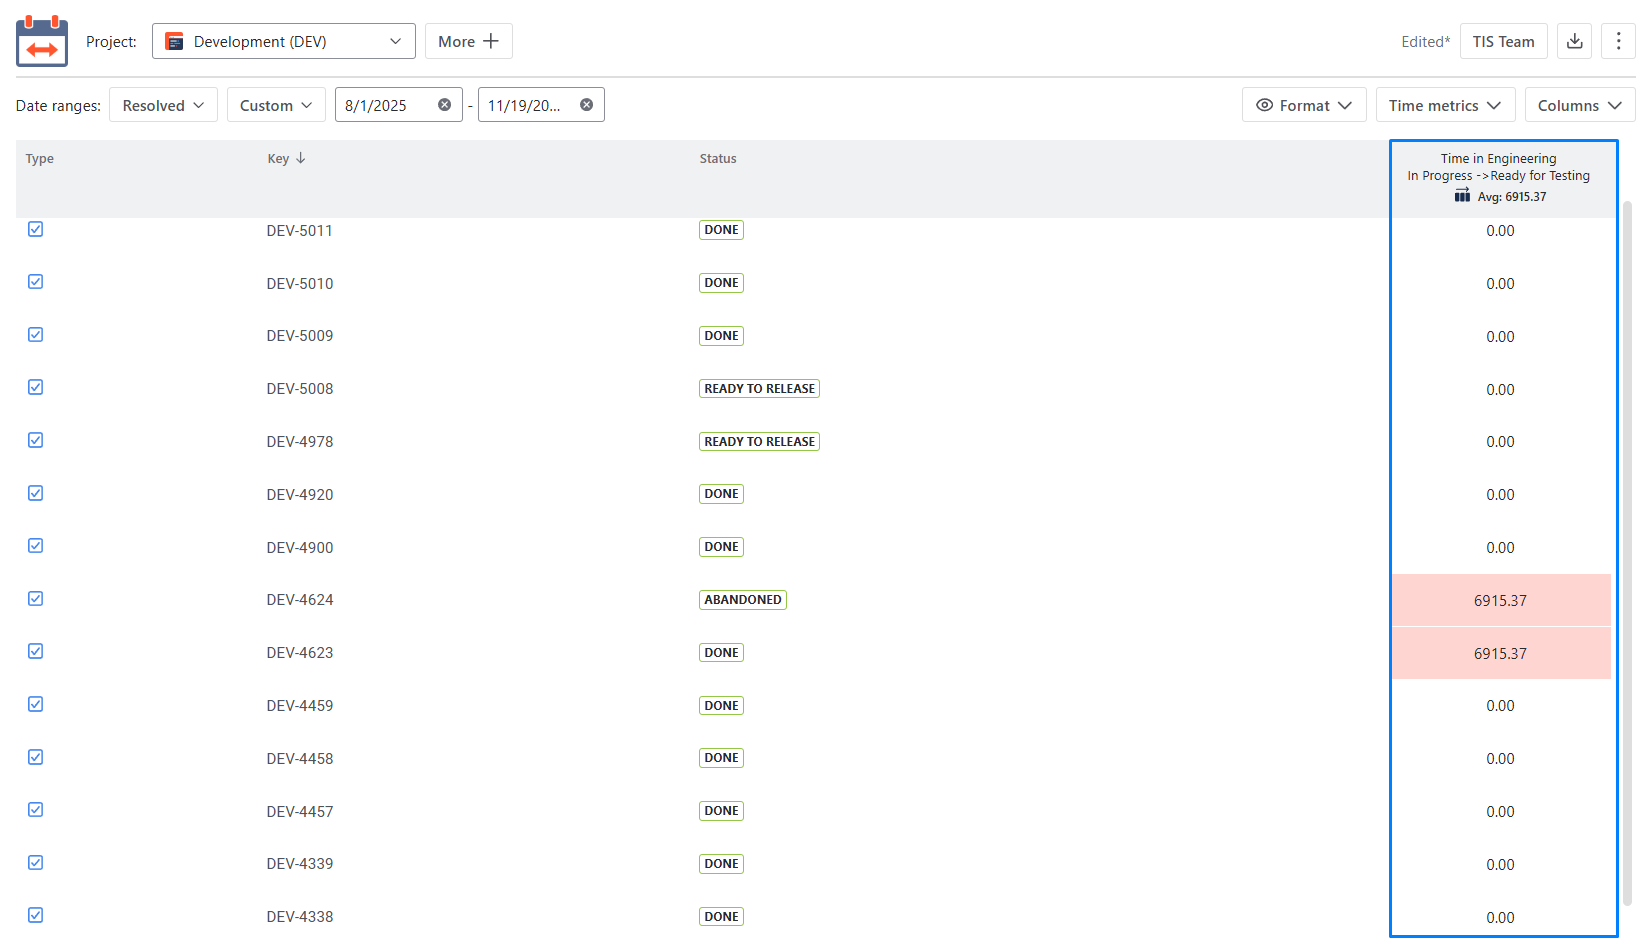
Visualizing Data: Once configured, view Time in Engineering on the app’s grid, showing you exactly how much time was spent in the development phase for each task.
Exporting Data: You can export Time in Engineering data to Excel or Google Sheets to share with stakeholders or analyze trends to make informed decisions.
After clicking Save, you will be able to view Time in Engineering on the grid.
📈 Outcomes: With the Time Metrics/Time Between Statuses app, you can track how long work items spend in the engineering phase, spot delays, and optimize your development cycles. By keeping track of Time in Engineering, your team can work more efficiently and ensure that tasks move swiftly from development to the next phase. |
|---|
If you need help or want to ask questions, please contact SaaSJet Support or email us at support@saasjet.atlassian.net
Haven't used this app yet? Try it now!