Track Time in QA in Jira
📝 Context: A development team aiming to monitor the efficiency of their QA (Quality Assurance) process needs detailed insights into how much time work items spend in QA to identify potential delays and optimize the testing workflow.
🤔 User Problem: Teams need to prevent work items from lingering in QA, as this can lead to bottlenecks and postpone product releases. However, without precise tracking, it becomes challenging to ascertain the duration tasks spend in the testing phase. |
|---|
Before we start, let’s clarify what Time in QA refers to.
Time in QA measures the total amount of time a work item spends in the QA process, starting from the moment it enters the testing phase until it is either approved or rejected. Tracking this metric helps improve the testing process, pinpoint delays, and ensure timely work item resolution.
💡 Solution: Calculate and visualize Time in QA by tracking the status transitions using the Time Metrics/Time Between Statuses app.
.png?inst-v=1702e073-bb07-4621-bc42-04cb799daf87)
How to Configure Time in QA?
Click on the Time metrics button and choose Create Time metrics
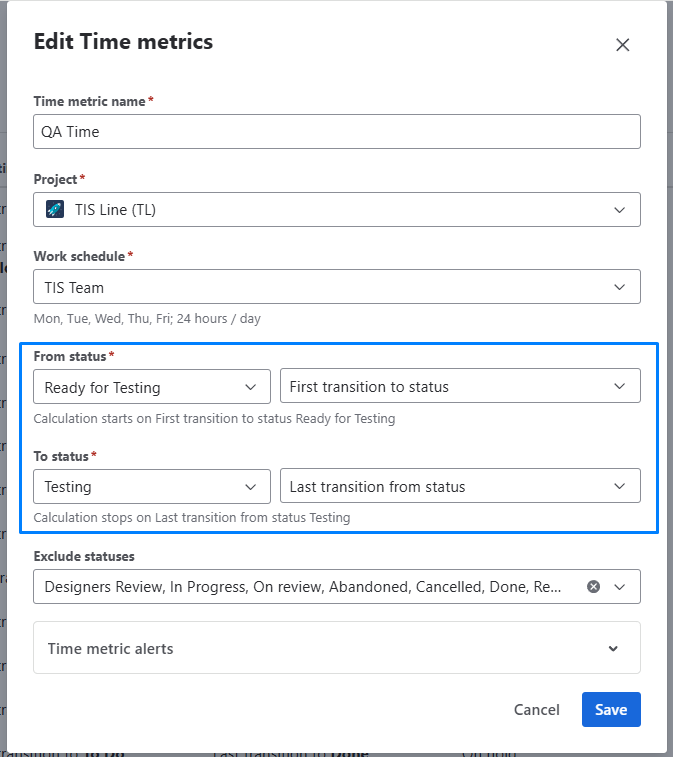
Set Start/Stop Statuses for Calculation:
Start status: Choose the status representing when a work item enters QA (e.g., "In progress", "In QA" "Testing in Progress").
Stop status: Set the status when testing ends (e.g., "Done", "QA Passed", "Ready for Release", or "Rejected").
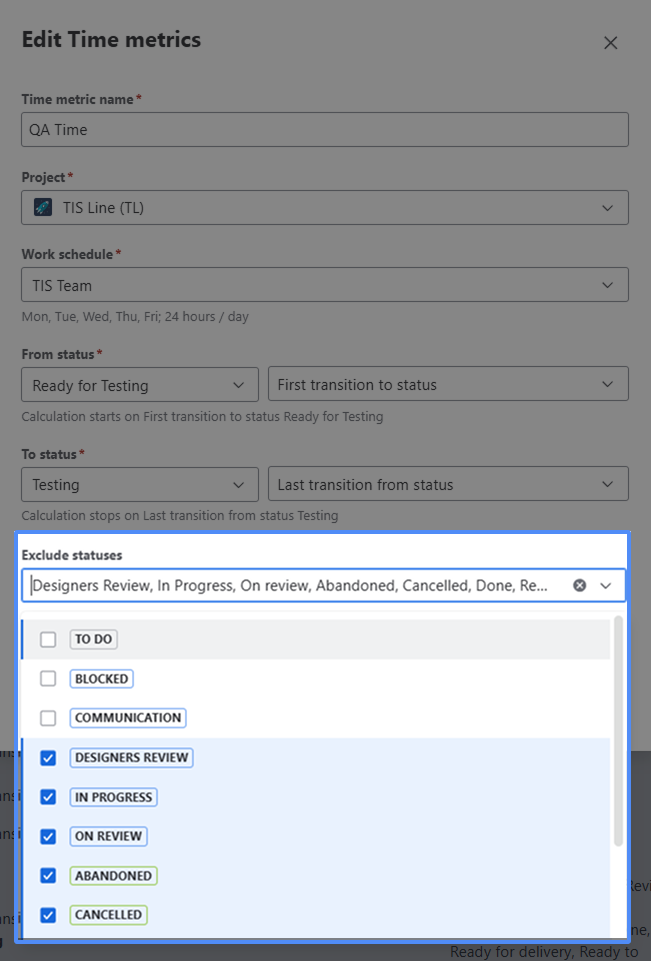
Optional: Configure Pause Statuses: If your team pauses QA for external reviews or additional requirements, configure statuses like "On Hold" to pause the clock when necessary.

Granular Data: Configure first/last transitions to/from statuses for additional data, such as when the work item first entered QA or when it was marked as complete.

Set Warning/Critical Limits: this feature will help you get the visual color tagging on work items to notify you when the time limits have been exceeded:
Warning time limit - yellow
Critical time limit - red

Customizing Reports:
Adjust project types, date ranges, and time formats.
Use the multi-calendar feature to exclude non-working hours or set specific working schedules.
Visualizing Data: View Time in QA in the grid, along with other time metrics like cycle time and lead time.
Exporting Data: Export QA time reports to Excel or Google Sheets to analyze the results further and share insights with team members.
After clicking Save, you will be able to view QA Time on the grid.
Additionally, you can customize your reports by adjusting the app interface fields. Such as:
Type of Project;
Date range;
Time Format;
Multi Calendar (to configure non-working hours and different calendars).
At the work item View Panel, you can visualize transition time for a specific work item (including time metrics).
The app also allows you to Export Time in QA data to Excel or Google Sheets for further analysis or sharing with key stakeholders. This enables you to maintain a competitive edge by delivering products faster and more efficiently.
📈 Outcomes: With the app, you can easily monitor the amount of time work items spend in QA, identify potential bottlenecks, and take proactive measures to streamline your testing process. By tracking Time in QA, you ensure that testing doesn’t become a bottleneck, helping your team deliver higher-quality software faster. |
|---|
If you need help or want to ask questions, please contact SaaSJet Support or email us at support@saasjet.atlassian.net
Haven't used this app yet? Try it now!