
The Time Metrics Tracker app is a versatile tool that you can access throughout Jira. Let's take a closer look at all these locations and features.
Monitoring Workflow with App
Select the installed Time Metrics Tracker from the Apps menu on the Jira sidebar.
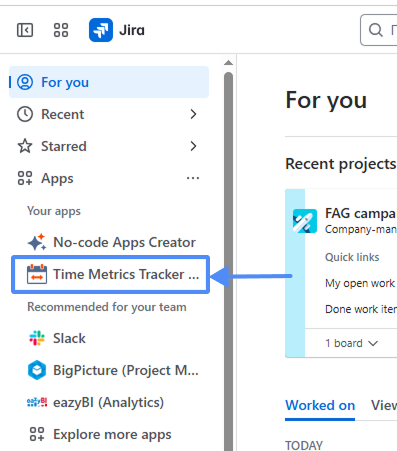
The app will open with all its features for reporting, tracking/config time metrics, managing, and creating work schedules. Users can visualize time distribution based on time metrics using Agile Metrics Dashboards or Scatter Plot Gadgets.
.png?cb=feaf07f04b89fb4a0438fc7aedbe46f0)
Agile Metrics Dashboard Gadget
Agile Metrics Dashboards enables Jira users to monitor customized time metrics reports using data from the Time Metrics Tracker app on the Jira dashboard. It also supports dark mode.
.png?cb=d4bd91e37c10886758ea4711775e8c08)
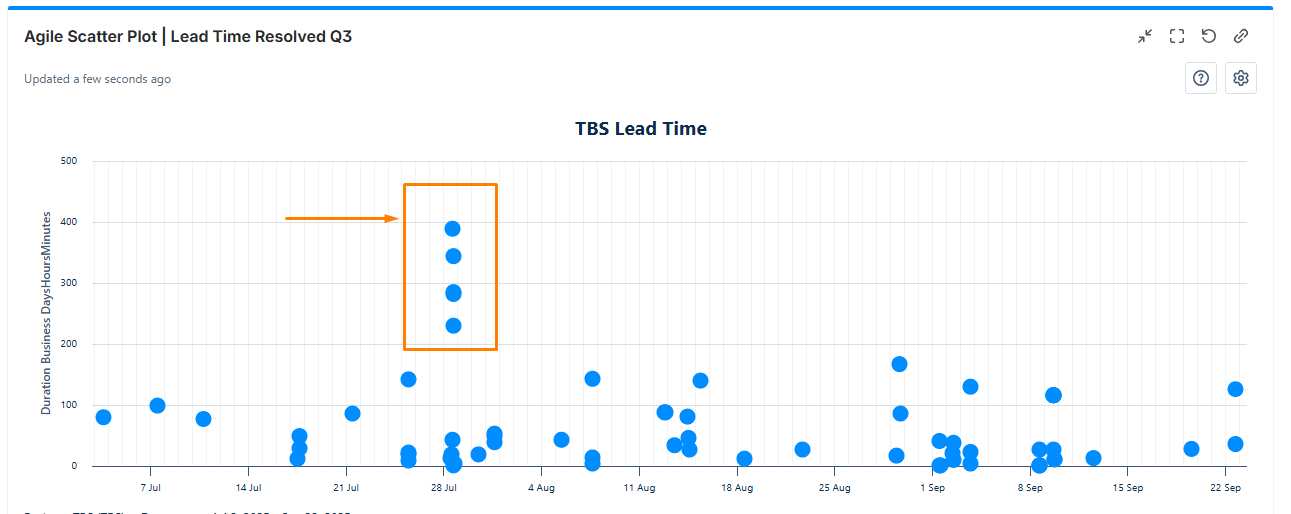
Scatter Plot Gadget
Scatter Plot Gadget lets Jira users visualize work item durations as dots on a chart directly in the Jira dashboard. It helps track trends and spot outliers. It also supports Jira dark mode.
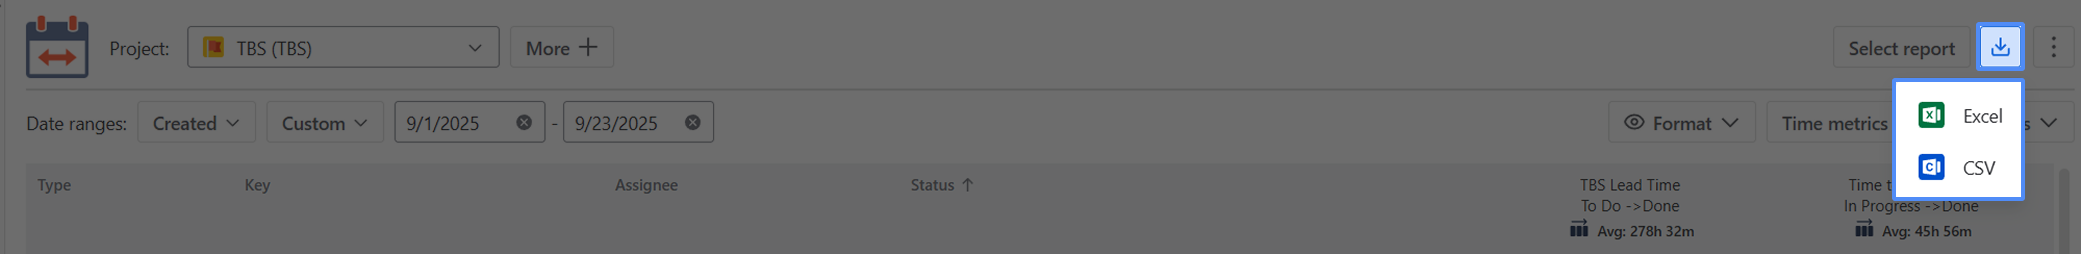
Export Jira Data and Reports
Export Time Metrics Tracker data as XLSX or CSV files and analyze it using Excel or Google Spreadsheets.
If you need help or want to ask questions, please contact us via SaaSJet Support or email support@saasjet.atlassian.net
Haven't used Time Metrics Tracker yet? Then try it now! >>>