
📝 Context: A team dealing with bottlenecks in their workflow and delays due to tasks waiting in queues or for approvals, needing a solution to accurately track and reduce wait times.
|
🤔 User Problem: Tasks sitting in queues or waiting for approvals can cause significant delays, affecting project timelines and delivery speed. Without proper tracking, it's hard to pinpoint where these delays are happening and how long tasks are stuck waiting. This is where Wait Time tracking comes into play, allowing you to measure and manage these delays effectively. |
|---|
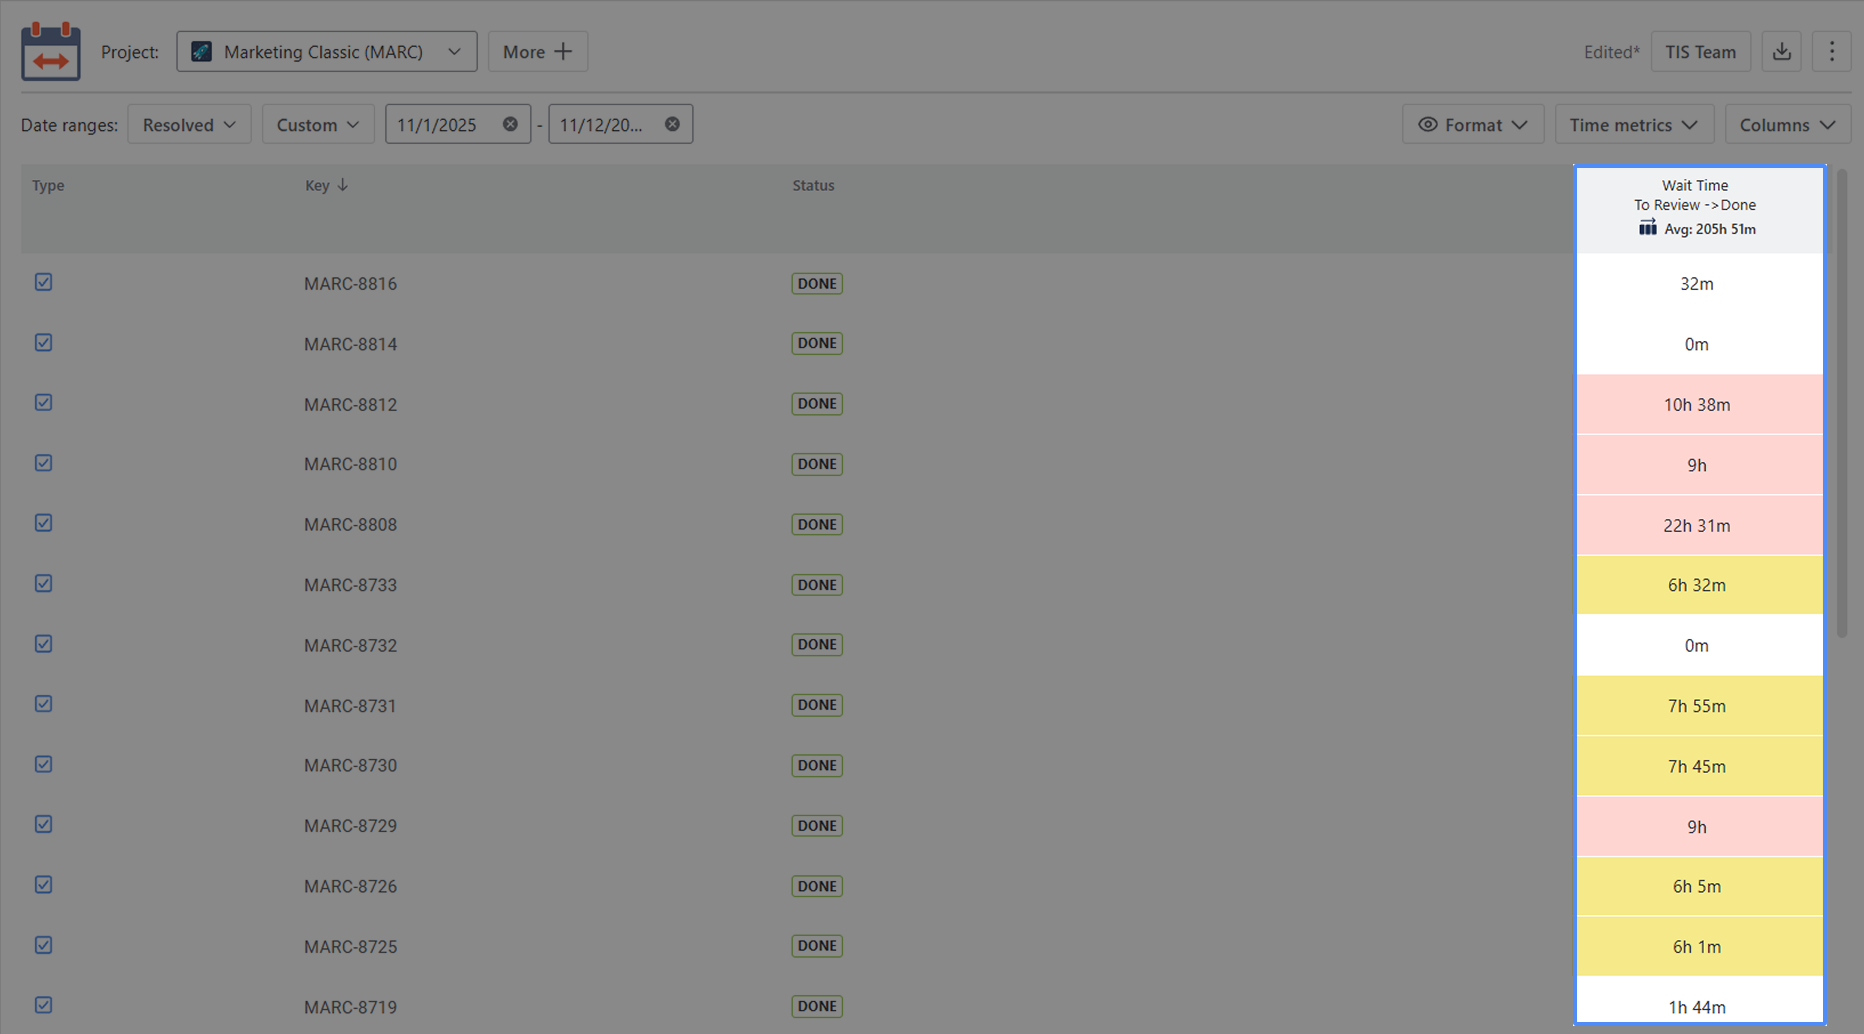
Before we proceed, let’s define Wait Time.
Wait time refers to the period during which a task is idle, waiting for someone to pick it up or for a necessary action, such as approval. Reducing wait time can drastically improve workflow efficiency and speed up project completion.
💡 Solution: Time Metrics Tracker offers an easy way to track Wait Time, helping you visualize how long tasks sit idle and where improvements can be made.
How to configure it?
-
Add a new Time Metrics
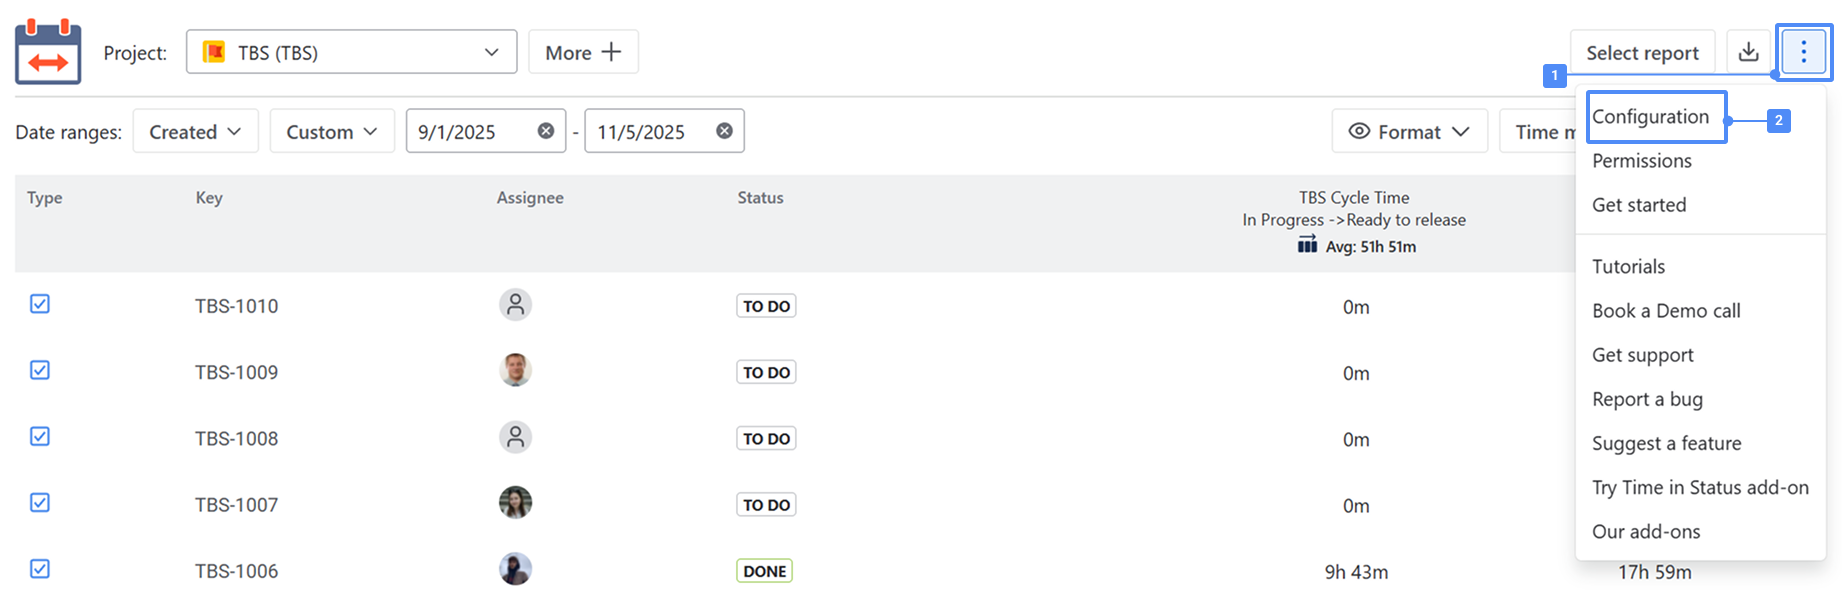
1 — The first method involves using the Configuration button. This approach is particularly useful for modifying existing Status groups.
To add a new statuses group, click Configuration — this button can be found in two places:
1️⃣ In the top-right corner of the report screen:
Click the three-dots menu (⋯) and choose Configuration from the dropdown list.
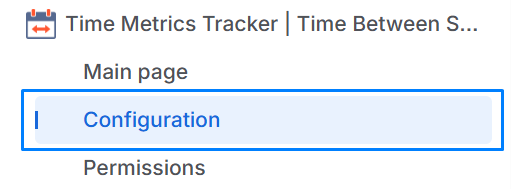
2️⃣ In the left sidebar, directly under the Time Metrics Tracker section of the app — the Configuration item is displayed in the navigation menu.
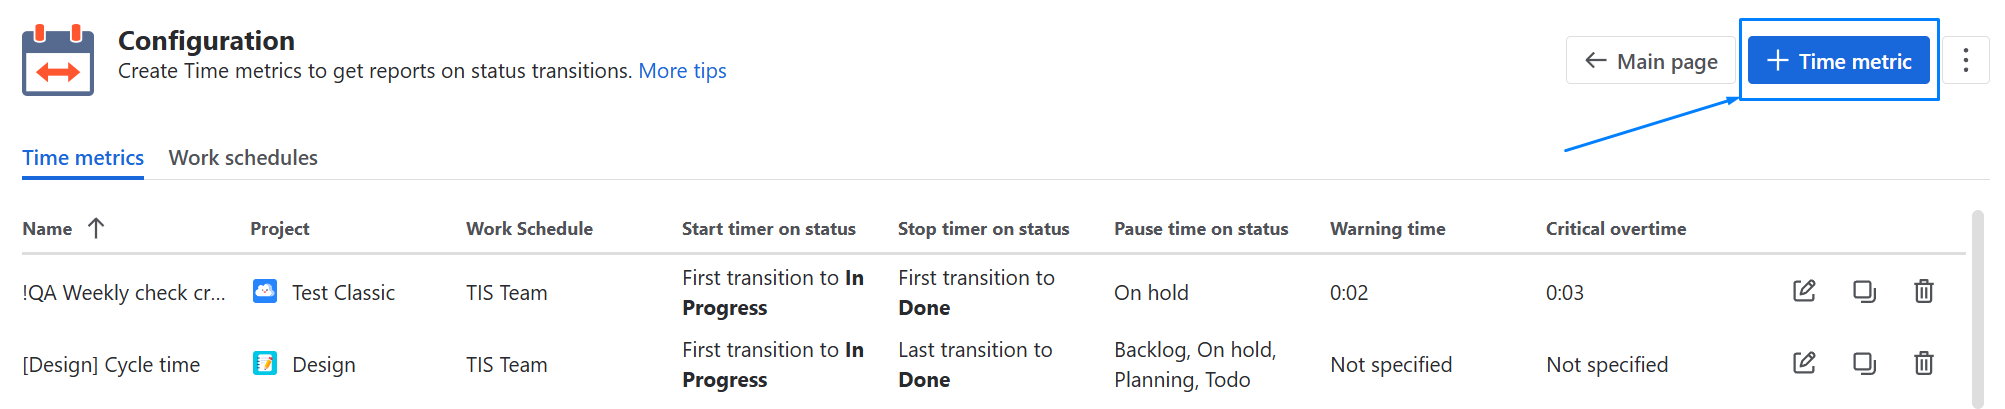
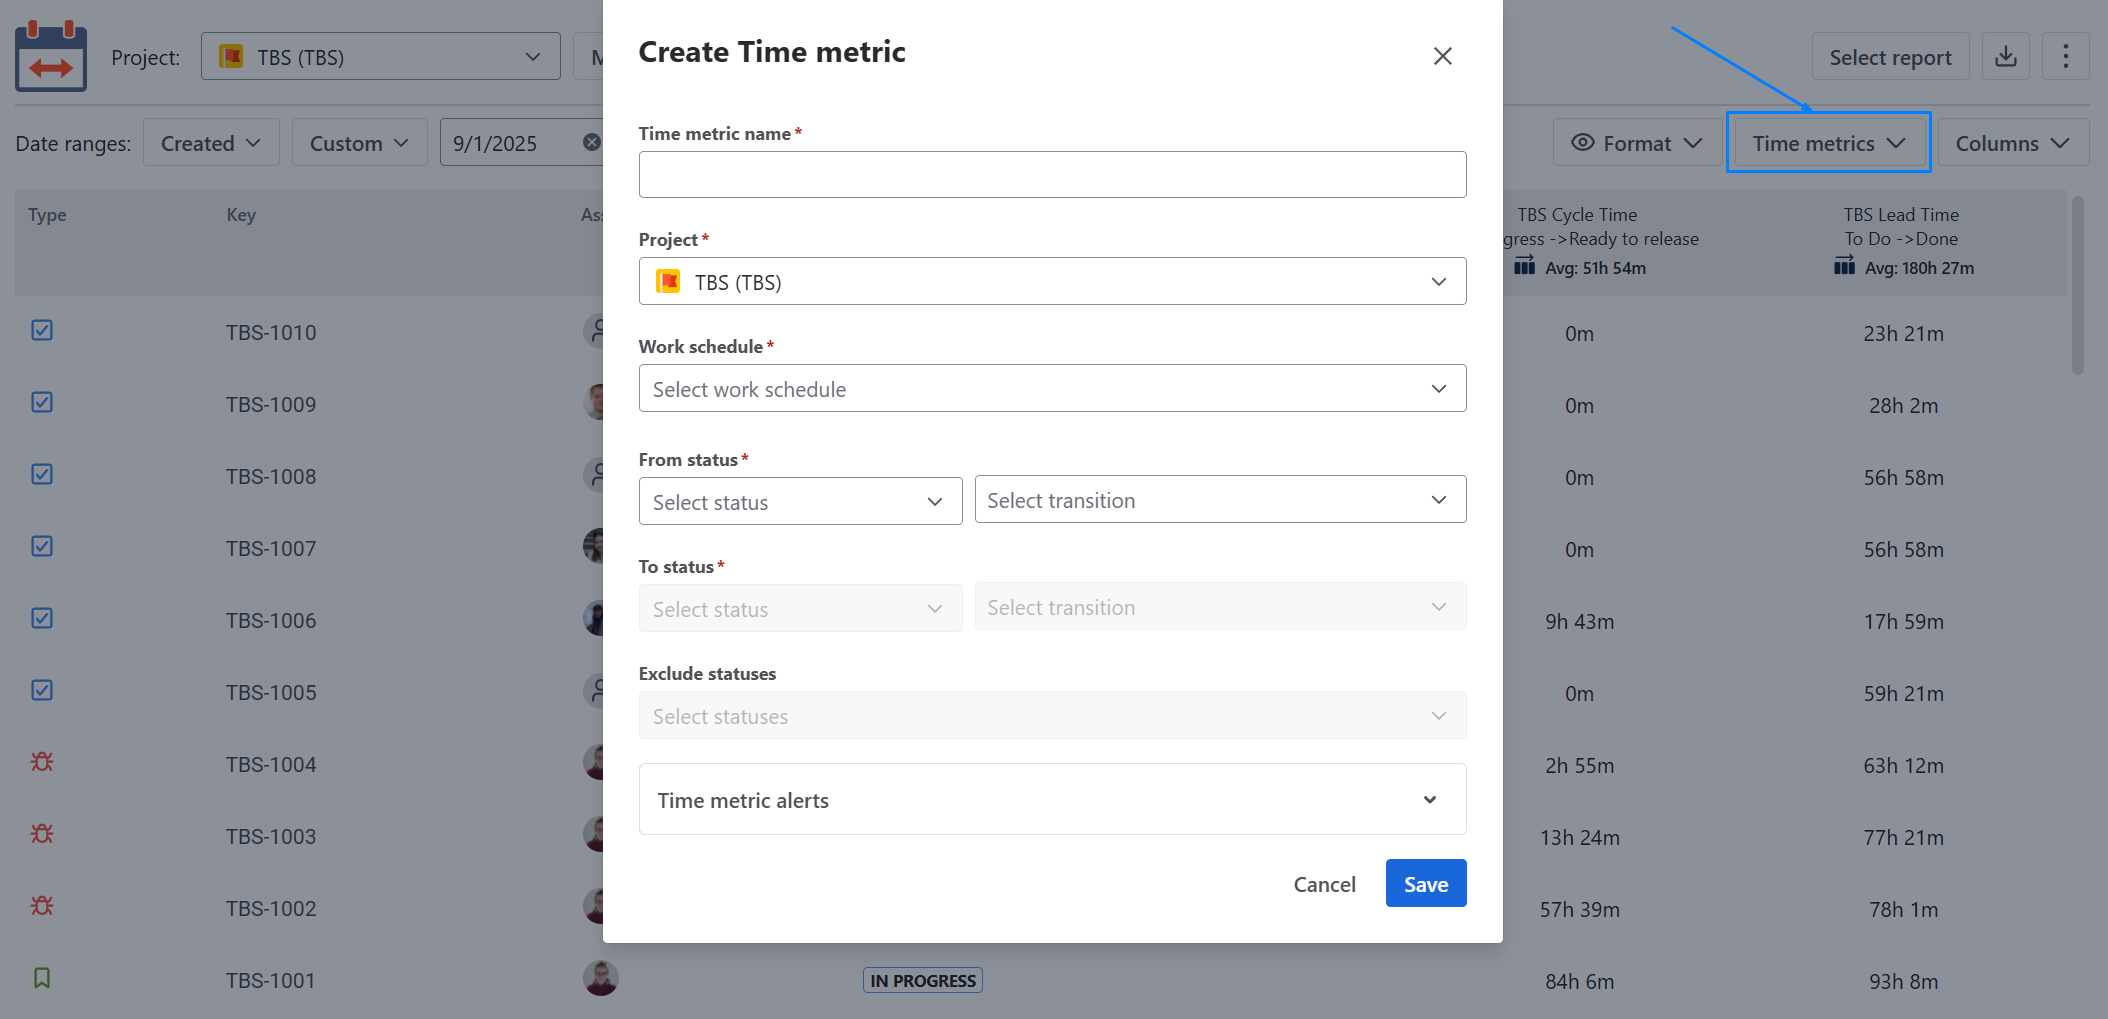
Click + Time metric
2 — The second way is to create group statuses on the grid.
Click the Time Metrics button in the upper-right corner of the table to configure the necessary conditions for calculating a specific time metric.
-
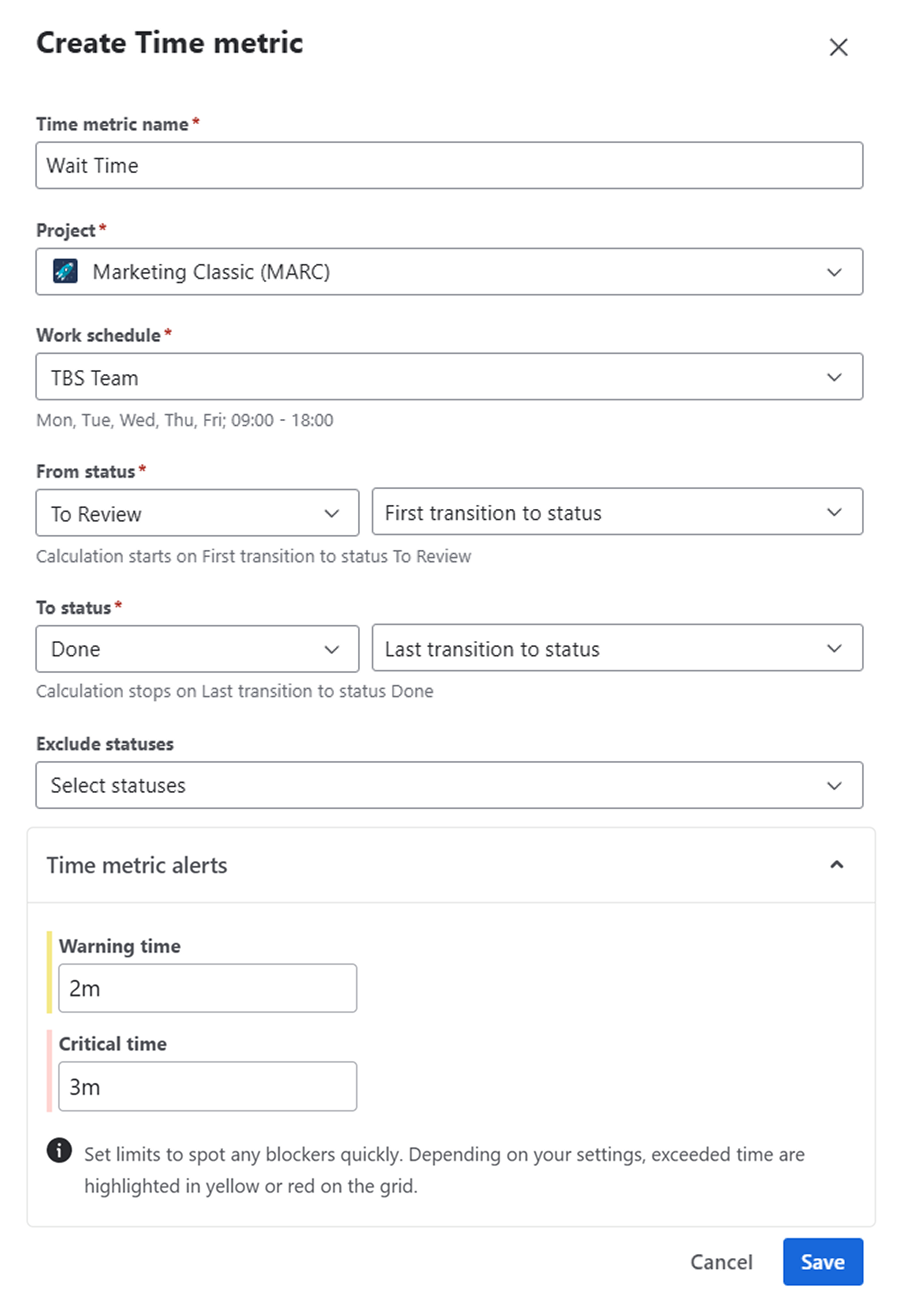
Set start/stop and pause statuses for calculation.
-
Select the first/last transition to/from status to get more detailed time data.
-
You can set up Warning and Critical limits for time metrics, optionally.
After clicking the Save button, you will be able to see the wait time displayed on the grid.
Additionally, you can customize your reports by adjusting the app interface fields. Such as:
-
Type of Project;
-
Date range;
-
Time Format;
-
Multi Calendar (to configure non-working hours and different calendars).
|
📈 Outcomes: You can closely monitor how long it takes to resolve tasks, identify bottlenecks, and optimize your team’s resolution process. Additionally, the data can be exported to Excel or Google Sheets for deeper analysis or sharing with stakeholders. This ensures your team maintains efficiency and meets project deadlines. |
|---|
If you need help or want to ask questions, please contact SaaSJet Support or email us at support@saasjet.atlassian.net
Haven't used this app yet? Try it now!