
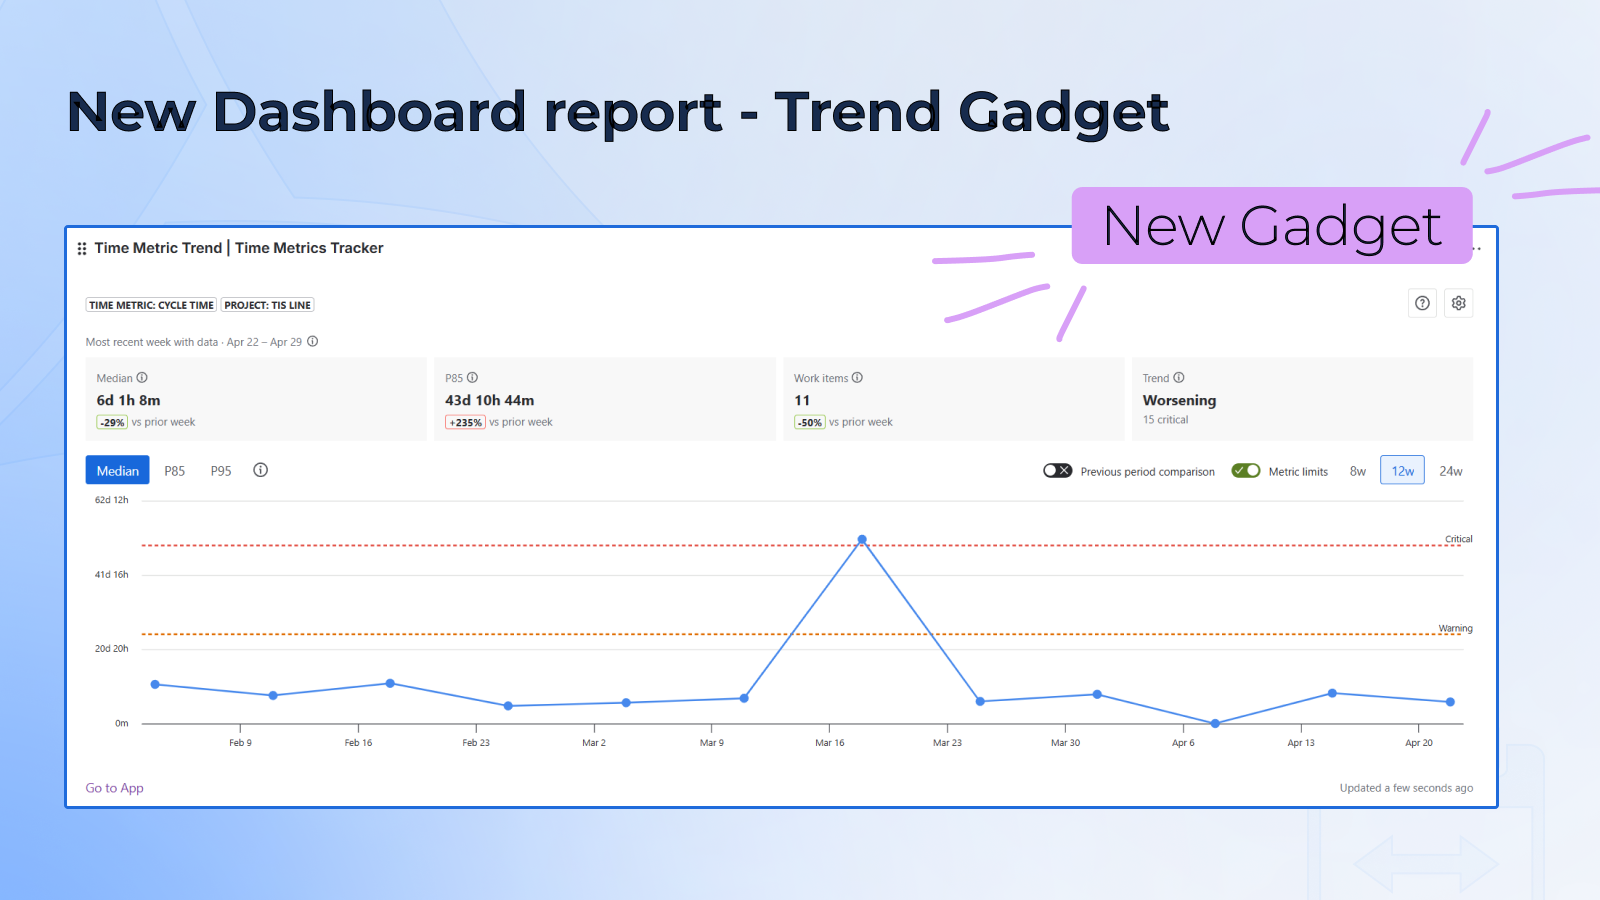
Time Metric Trend Gadget
Time Metric Trend Gadget is a Jira dashboard gadget that shows how one selected time metric changes over time. It helps you quickly understand whether a process is becoming faster, slower, or less stable.
For example, you can use this gadget to track:
-
Cycle Time
-
Code Review time
-
QA / Validation time
-
other time metrics configured
The Trend Gadget helps you:
-
spot process changes faster;
-
understand bottlenecks more clearly;
-
see not only what got worse, but also which work items caused it;
-
understand whether this week was better than the previous one;
-
make your dashboard more useful for day-to-day monitoring.
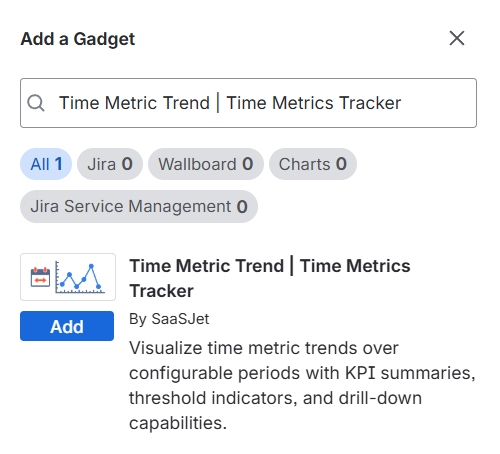
Adding the gadget to your dashboard
-
Go to any Jira Dashboard
-
Click Add gadget
-
Find Time Metrics Trend
-
Add it
-
Configure the gadget
-
Done 🎉
The gadget follows your Jira permissions. If you do not have access to a project or work item, you will not see it in the chart.
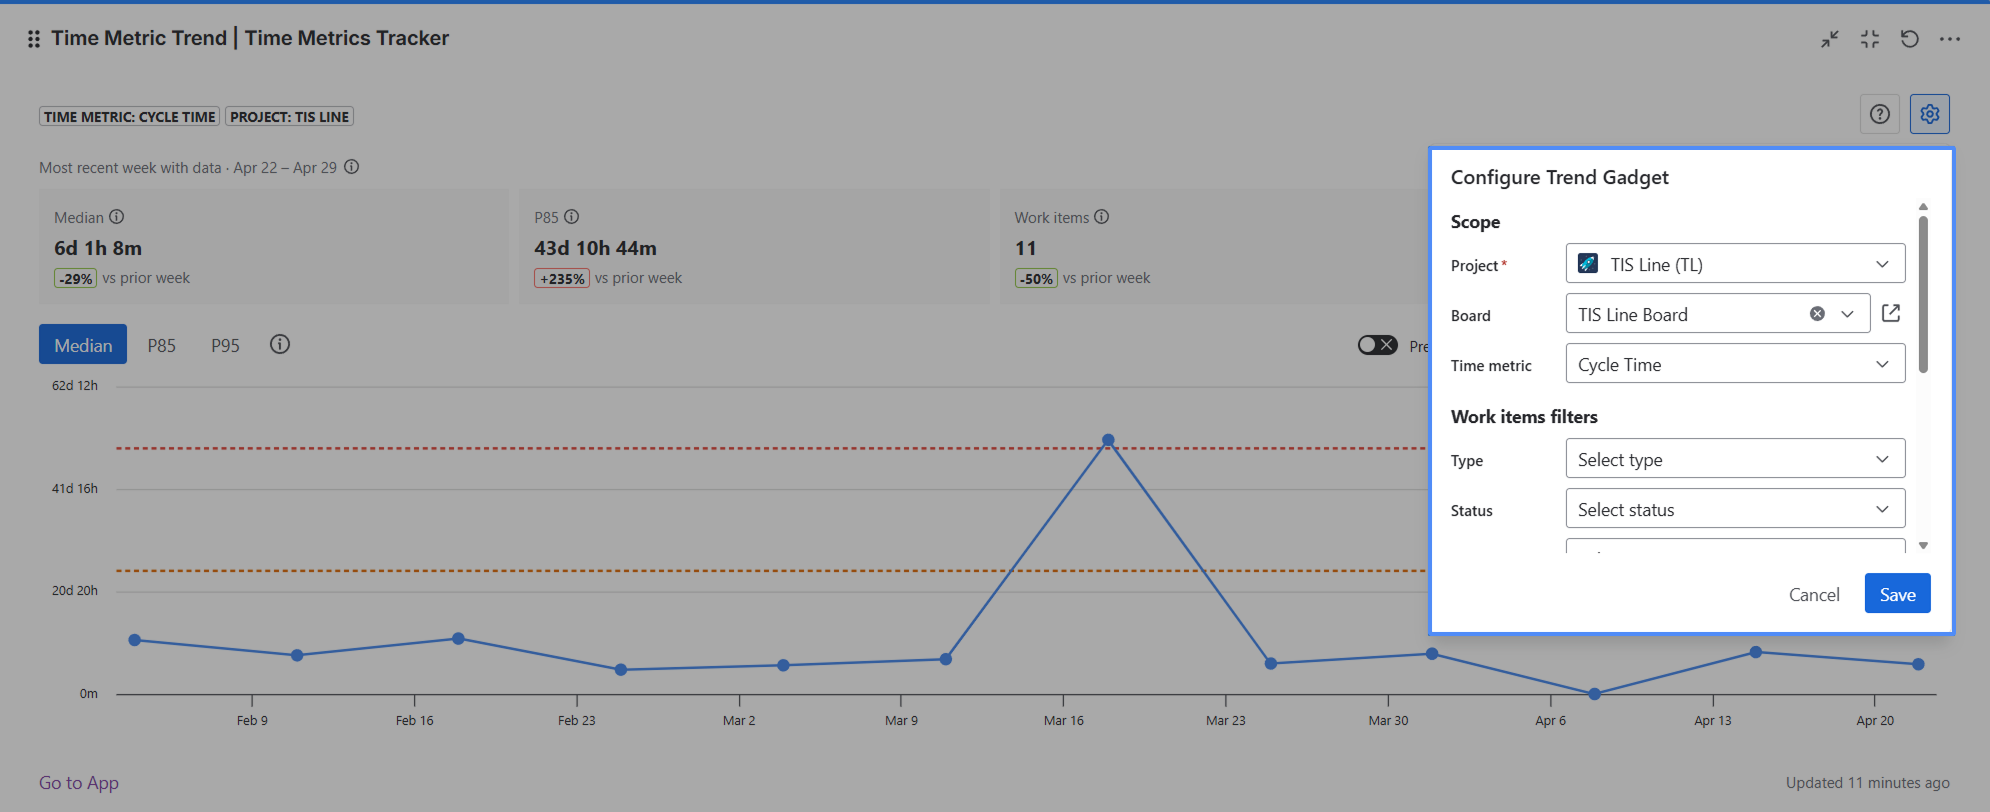
Configuration options
Scope
Choose:
-
Project
-
Board
-
Time metric
Work items filters
You can narrow down the work items using:
-
Work item type
-
Status
-
Assignee
-
Sprint
-
Label
You can also configure:
-
Time range and buckets — how far back the chart looks and how data is grouped;
-
Format — how time is displayed. This changes the display only, not the calculation. Calculations are always based on working time.
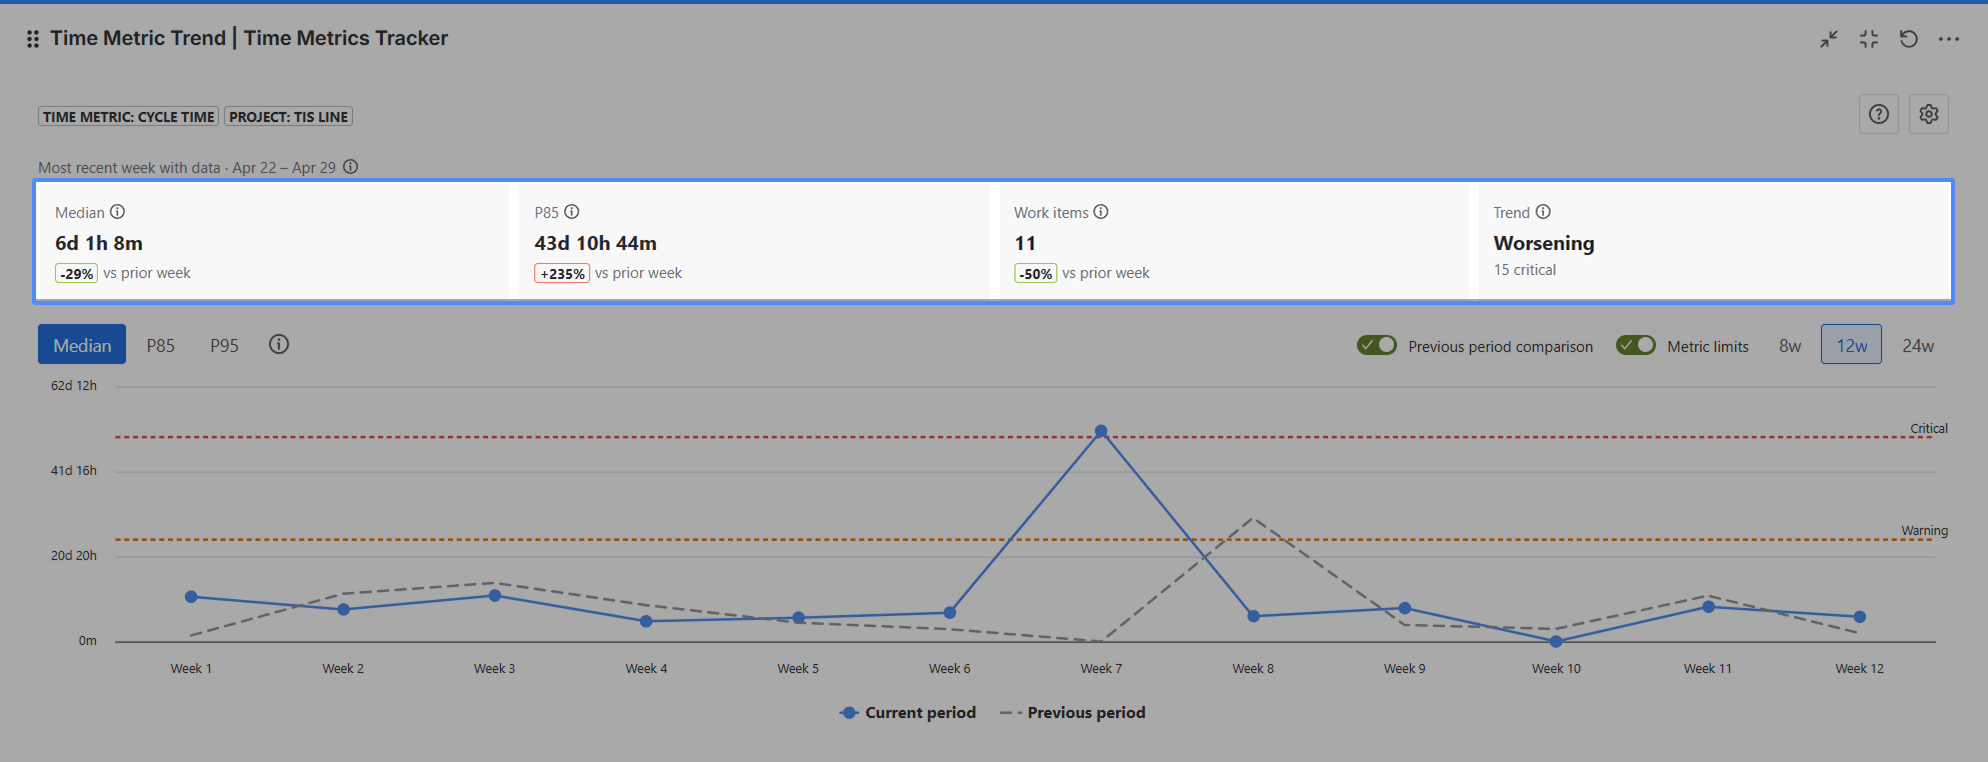
What you see in the gadget
The gadget includes:
-
a header with metric context;
-
KPI cards with quick summaries;
-
a trend chart;
-
previous period comparison, if enabled;
-
Warning / Critical lines, if limits are configured for the metric;
-
a detail modal, opened by clicking a point on the chart.
How to read the chart
What each point means
Each point represents one time bucket. For example, if you choose Range = 12w and Group = weekly, the chart will show 12 weekly buckets.
X-axis
-
Without previous period comparison: shows dates or date ranges
-
With previous period comparison: shows bucket or week numbers such as Week 1, Week 2, Week 3
Y-axis
The Y-axis shows the selected metric:
-
Median
-
P85
-
P95
Median, P85, and P95
Median
Median shows the typical time for the work items in a bucket.
If you sort all work items from fastest to slowest, the median is the value in the middle. Half the items were faster, and half were slower.
Example
A bucket contains 10 work items with these durations:
3, 5, 5, 7, 8, 9, 11, 14, 20, 40
The median is 8.5h — the average of the two middle values, 8 and 9.
How to read it:
Median answers the question: “What does a typical work item look like?”
P85
P85 shows how long it takes for 85% of work items to complete.
Example
Using the same example:
P85 ≈ 17.4h
This means 85% of work items finished in 17.4 hours or less, while the slowest 15% took longer.
How to read it:
P85 helps answer: “How long does it take for most work items?” That is why it is useful for SLA-style tracking.
P95
P95 shows what is happening with the slowest work items.
Example
Using the same example:
P95 ≈ 30h
This means only the worst 5% of work items took longer.
How to read it:
P95 helps you spot the long tail — problematic cases that the median may hide.
Quick cheat sheet
|
Metric |
What it helps you understand |
|---|---|
|
Median |
The typical time for most work items |
|
P85 |
The time 85% of work items finish within |
|
P95 |
Whether there is a problematic long tail in the process |
KPI cards: how to read them
Above the chart, you will see 4 KPI cards:
-
Median — median for the most recent non-empty bucket
-
P85 — P85 for the most recent non-empty bucket
-
Items — total number of work items in the current period
-
Trend — overall direction: Improving, Stable, or Worsening
If previous period comparison is enabled, the cards may also show a delta versus the previous period.
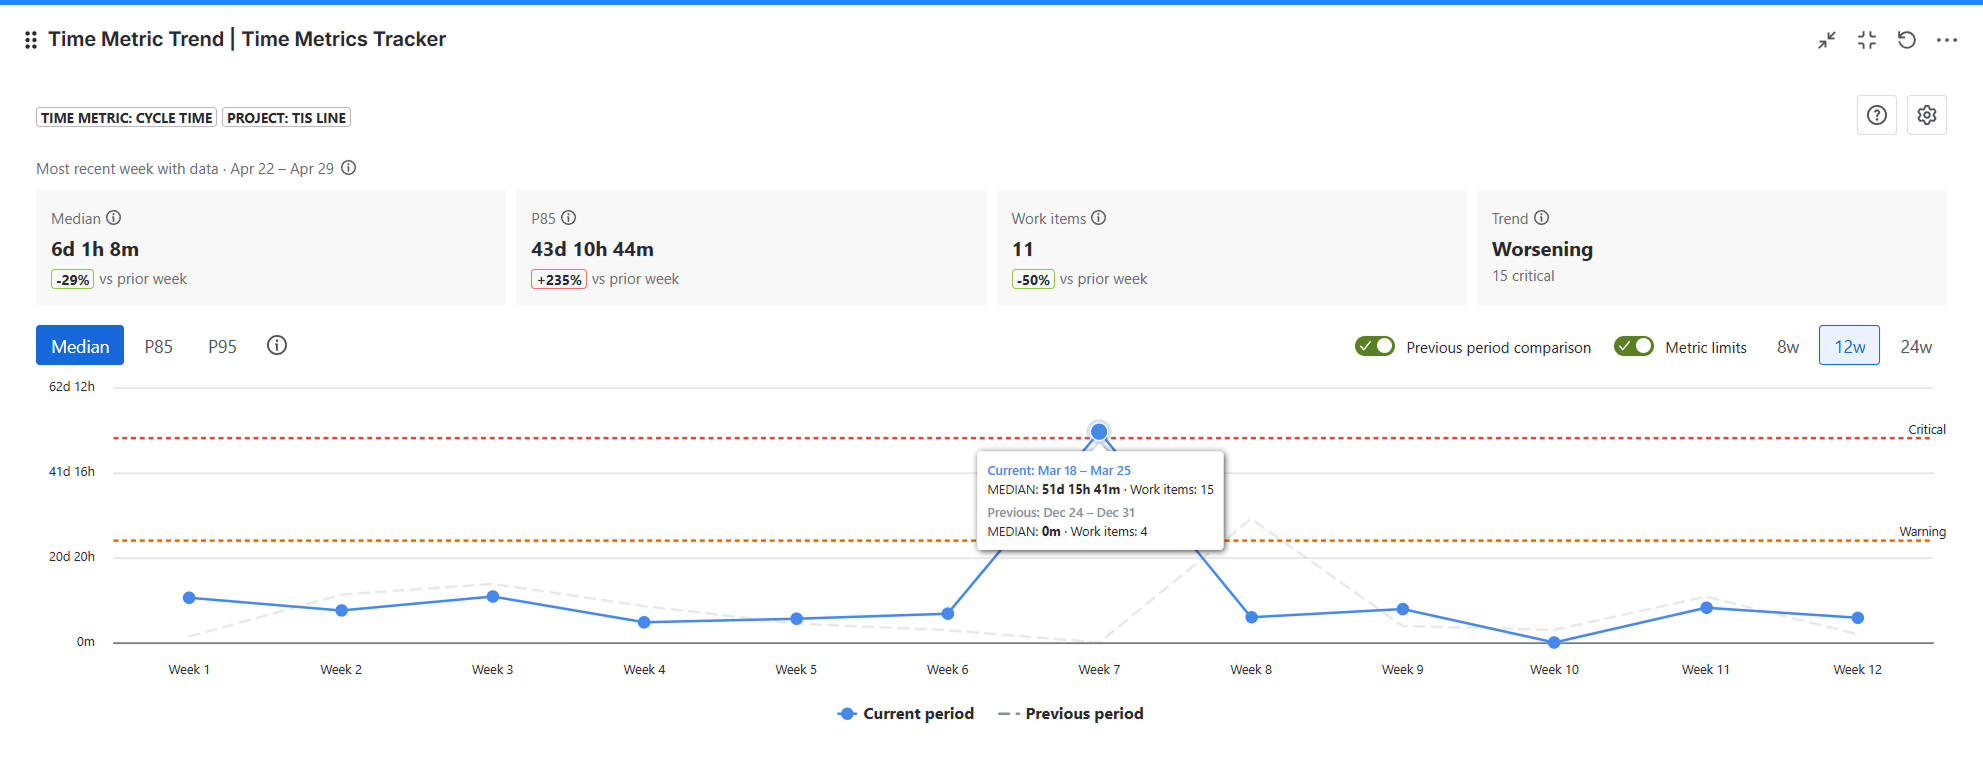
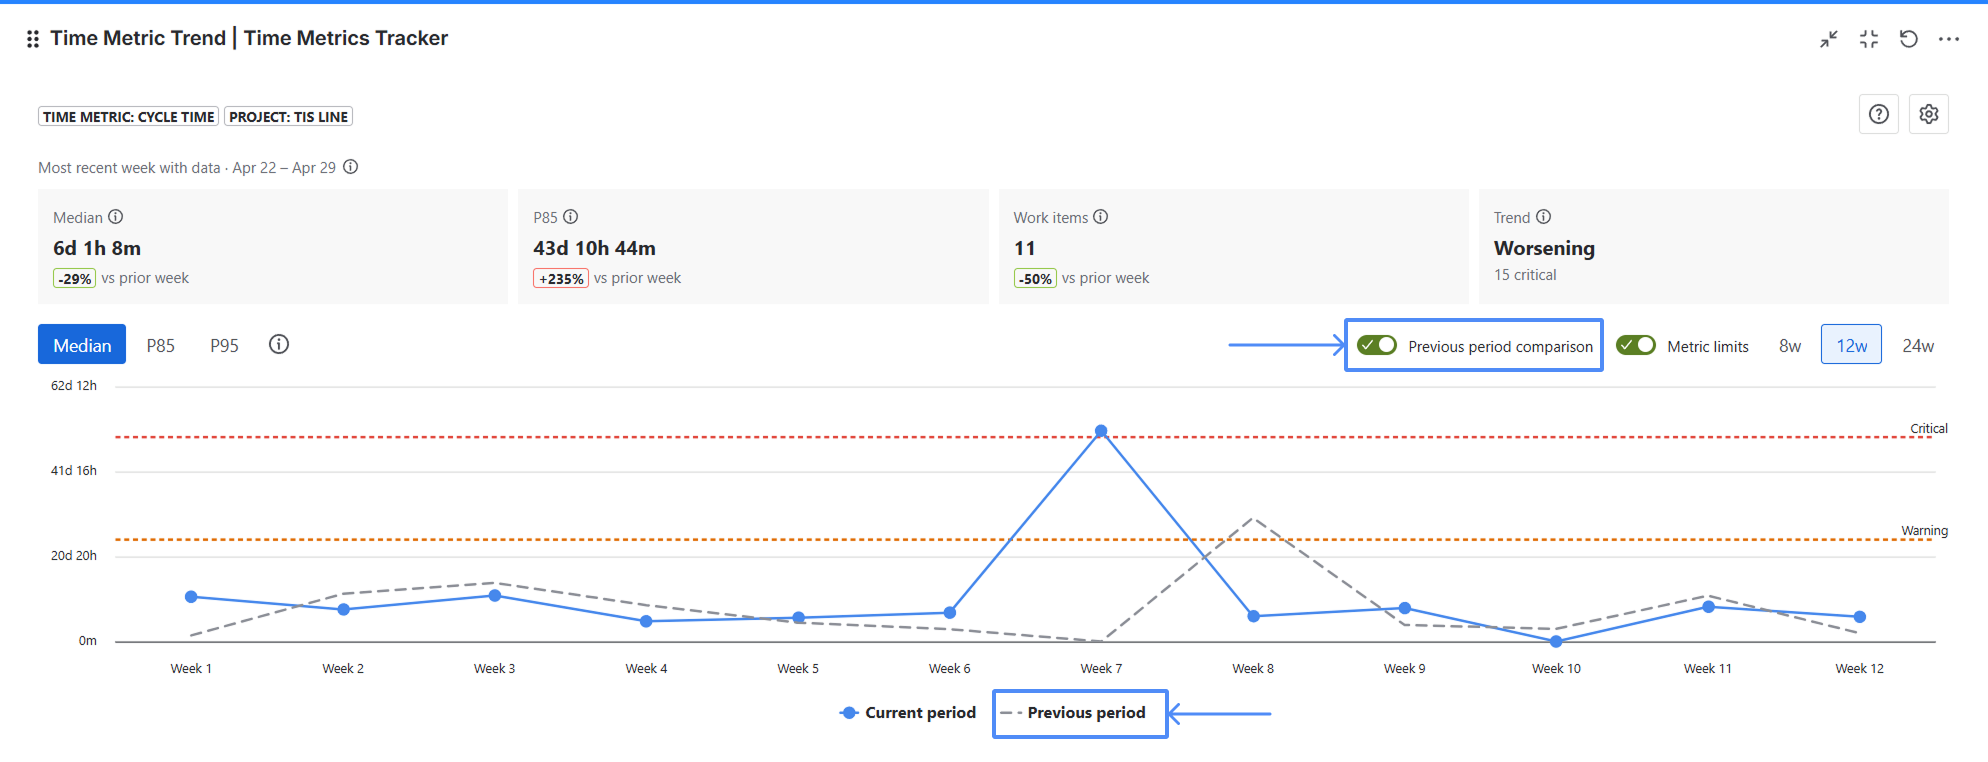
Comparing with the previous period
If you turn on Previous period comparison, the chart shows two lines:
-
Current period
-
Previous period
The previous period is the same length as the current one, but shifted back in time.
Example:
If you choose 12 weeks, the main line shows the last 12 weeks, and the comparison line shows the 12 weeks before that.
Warning and Critical lines
If thresholds are configured for the selected Time Metric, the chart can show two horizontal reference lines:
-
Warning
-
Critical
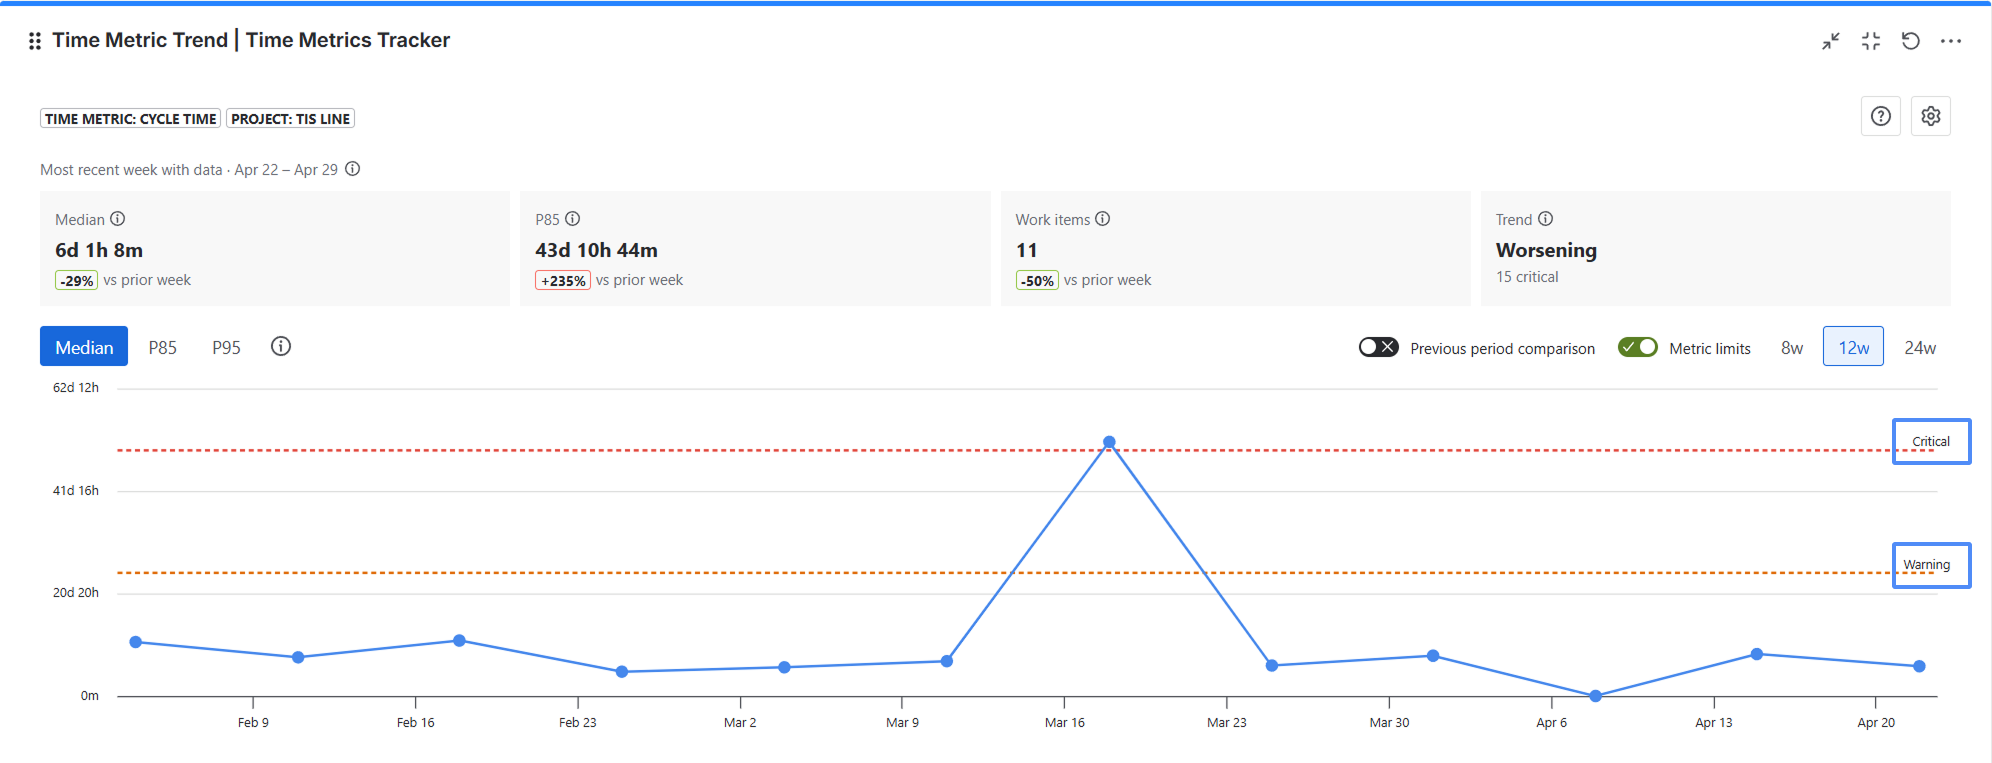
These lines help you quickly see when a bucket’s statistic goes beyond the expected time limit.
If a threshold is not configured, that line is simply not shown.
Detail modal: what opens when you click a chart point
When you click any point on the chart, a Detail modal opens. It shows the work items that belong to that bucket, helping you move from the overall trend to the specific items behind it.
In the modal, you can see:
-
work item
-
summary
-
assignee
-
type
-
metric
-
status
-
completed
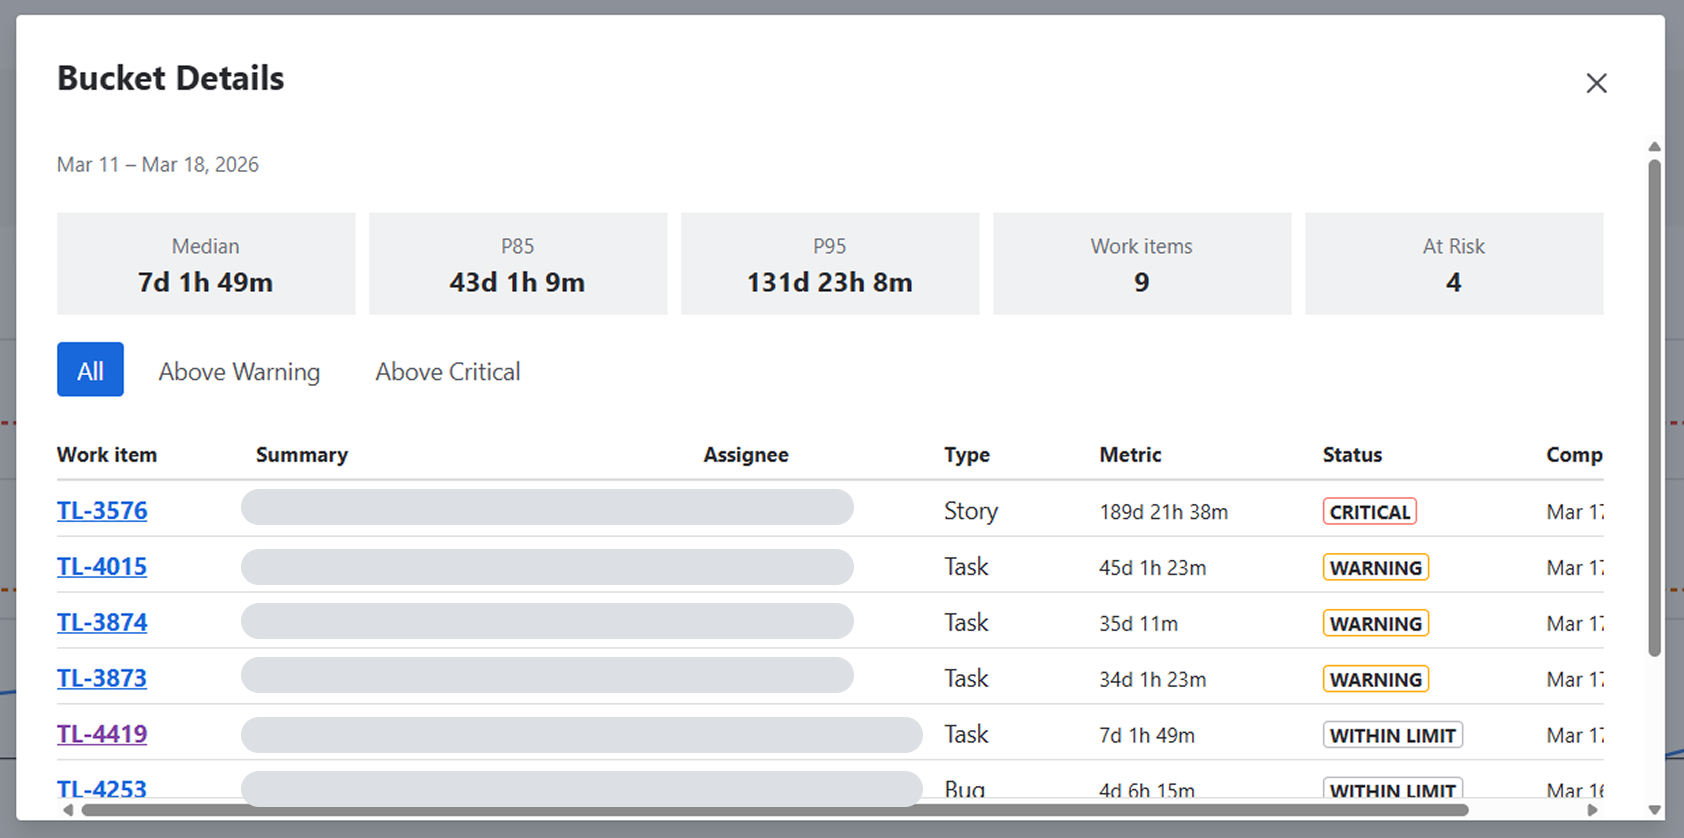
You can also review which items are above warning and above critical.
What to keep in mind when reading the chart
Why the latest bucket may look smaller
The latest bucket is often incomplete, because it ends today rather than after a full week or month. That means it may contain fewer work items, so its statistics may look less stable.
Why the median may jump
If a bucket contains only a small number of work items, the median is affected more strongly by each individual value. That is why the chart may look noisier with small samples.
Why P95 is usually noisier
P95 depends on the slowest work items, so it naturally changes more on small samples.
Conclusion
Time Metric Trend Gadget helps you see more than a single metric value — it helps you understand how the process changes over time. It makes it easier to spot delays, compare periods, and drill down into the work items behind the trend.
If you need help or want to ask questions, please contact us through SaaSJet Support or via email support@saasjet.atlassian.net
Haven't used this app yet? Try it now! >>>