
Scatter Plot Gadget provides a visual representation of work item's duration in a specific time metric. It helps users analyze performance trends, detect outliers, and evaluate workflow efficiency.
How to install Scatter Plot Gadget in Jira on dashboard
First, you must use the latest Time Metrics Tracker app version.
To update the app, follow the update instructions if you've installed an app before the release.
-
In Jira, go to Dashboards
-
Create a new dashboard or select an existing one.
-
Click the Add gadget button on the dashboard.
-
Write "Scatter Plot" in the search box.
-
Select Agile Scatter Plot | Time Metrics Tracker in the search results.
.png?cb=3d069ad11030120a1e9c6167edf39c76)
-
Click the Add button.
How to Configure
First, you need to configure the gadget using the following settings to view the data in the dashboard
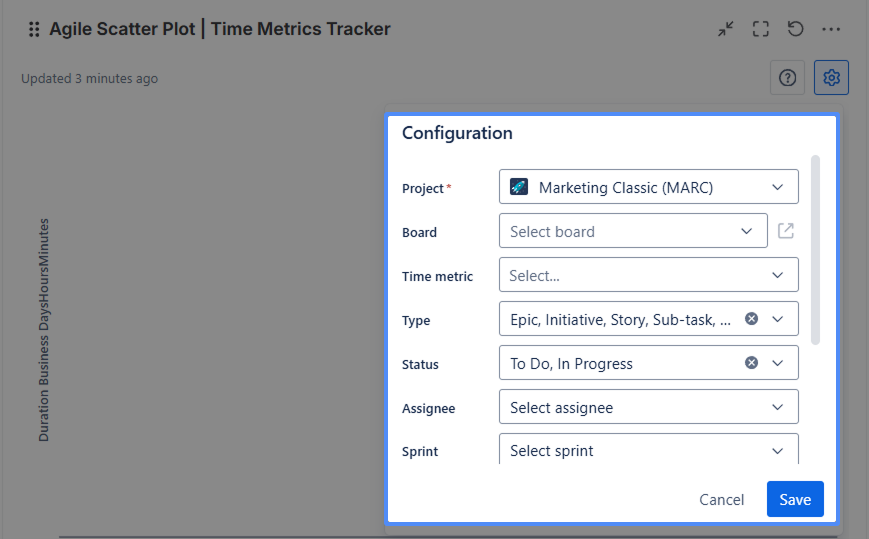
In Gadget Configuration, you can set:
-
Project – select the project you want to report on.
-
Time metrics – choose which time metrics to display. If they have not yet been created for the selected project, the gadget will prompt you to do so.
-
Type – filter work items by type (e.g., Story, Task, Bug).
-
Status – select specific Jira statuses you want to include in the report.
-
Assignee – display metrics based on particular team members.
-
Sprint – focus on tasks within a specific sprint.
-
Label – narrow down work items by assigned labels.
-
Works filter – choose the work items filter: Created, Updated, or Resolved.
-
Date range – customize reporting periods (e.g., Last month, Last 7 days, Custom).
-
Format – select the time format (e.g., Hours:Minutes, Days).
How It Works
-
Each dot on the Scatter Plot represents a Jira work item with its corresponding time metric value.
-
The X-axis represents the timeline (date).
-
The Y-axis represents the duration (time spent in a status or between statuses).
-
You can zoom in on specific areas of the scatter plot by selecting a portion of the chart with the mouse. This allows for a detailed view of specific time ranges or work item clusters.
📌 If You See This Screen…
"Create a Time Metric" Screen
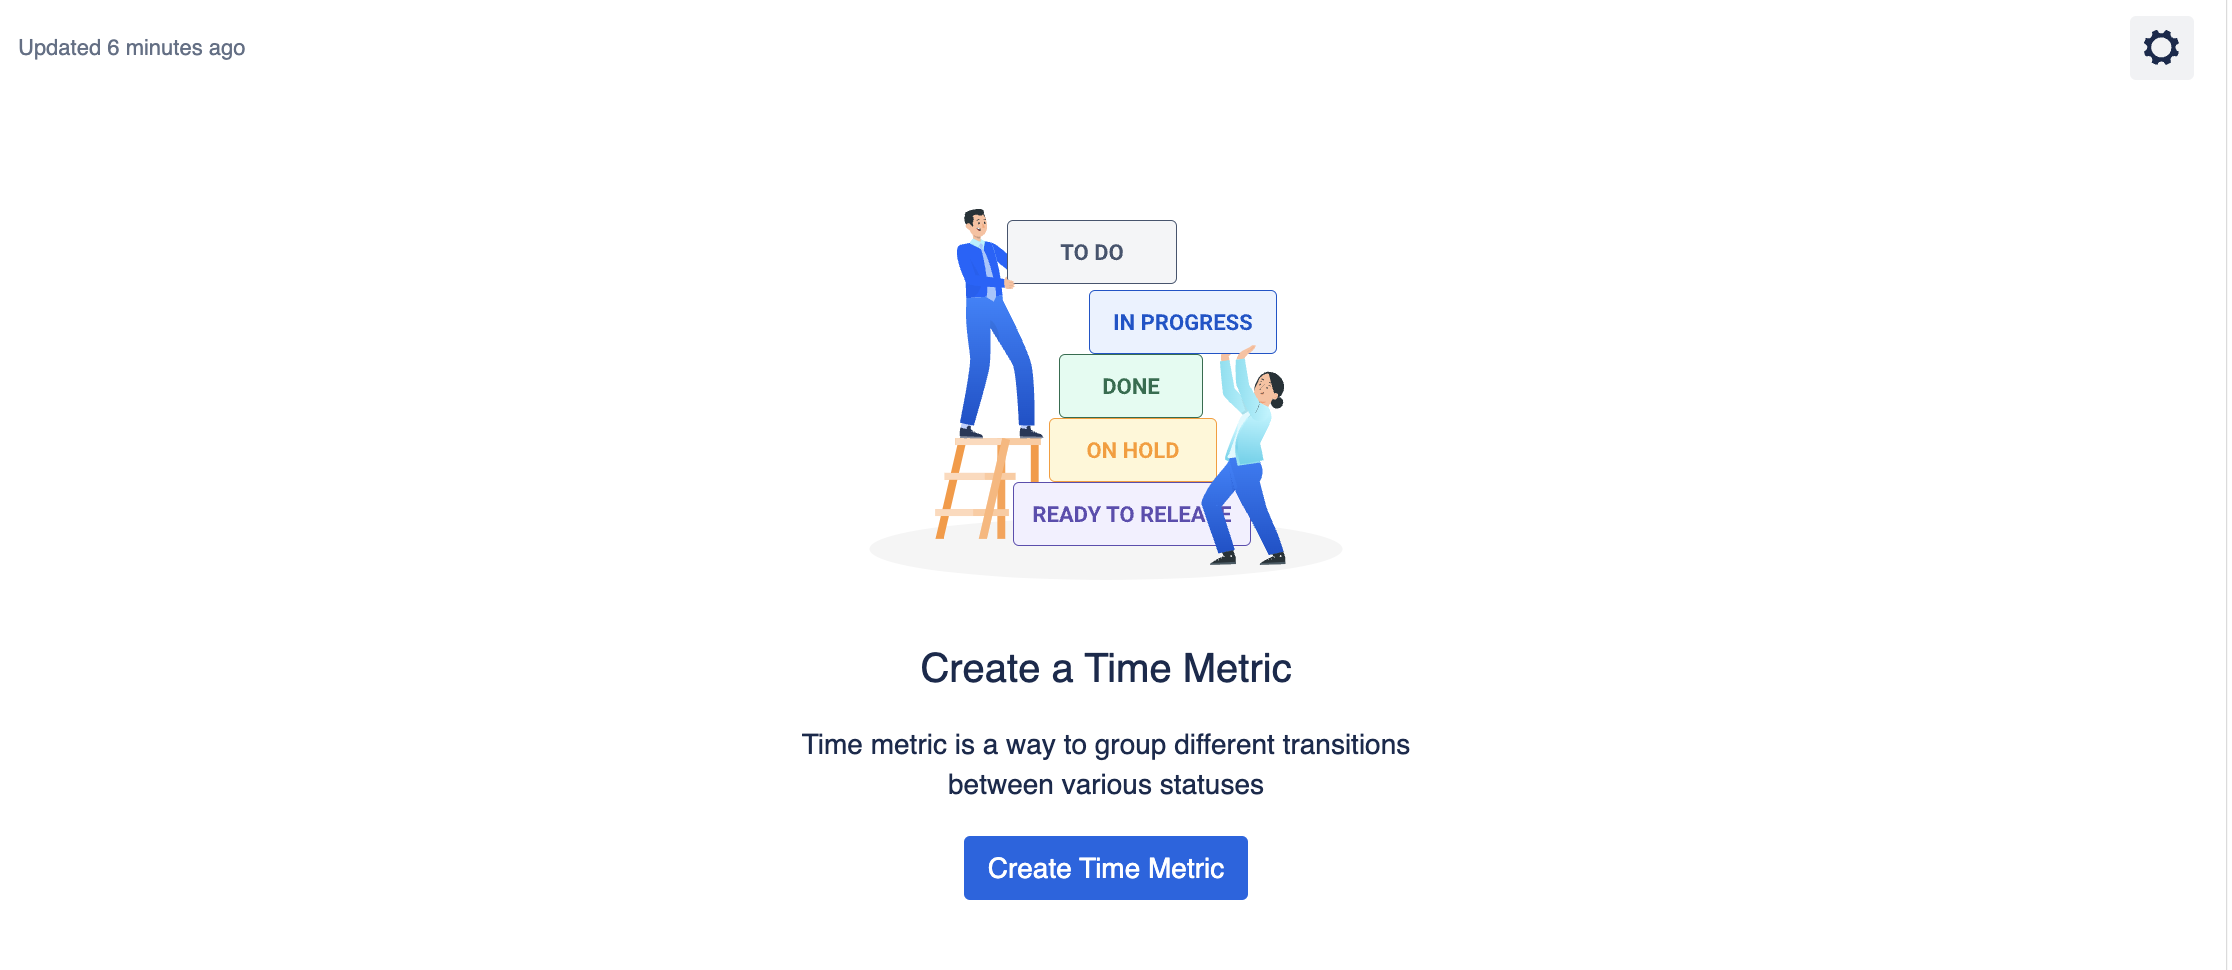
If you see this illustration with the statuses stacked (To Do, In Progress, Done, etc.), it means that no time metrics have been created yet for the selected project.
What to do:
Click the "Create Time Metric" button to define which statuses you want to measure (e.g., Cycle Time = In Progress → Done).
Time Metrics Tracker needs at least one configured time metric to show any data in the gadget.
"No work items Found" Screen
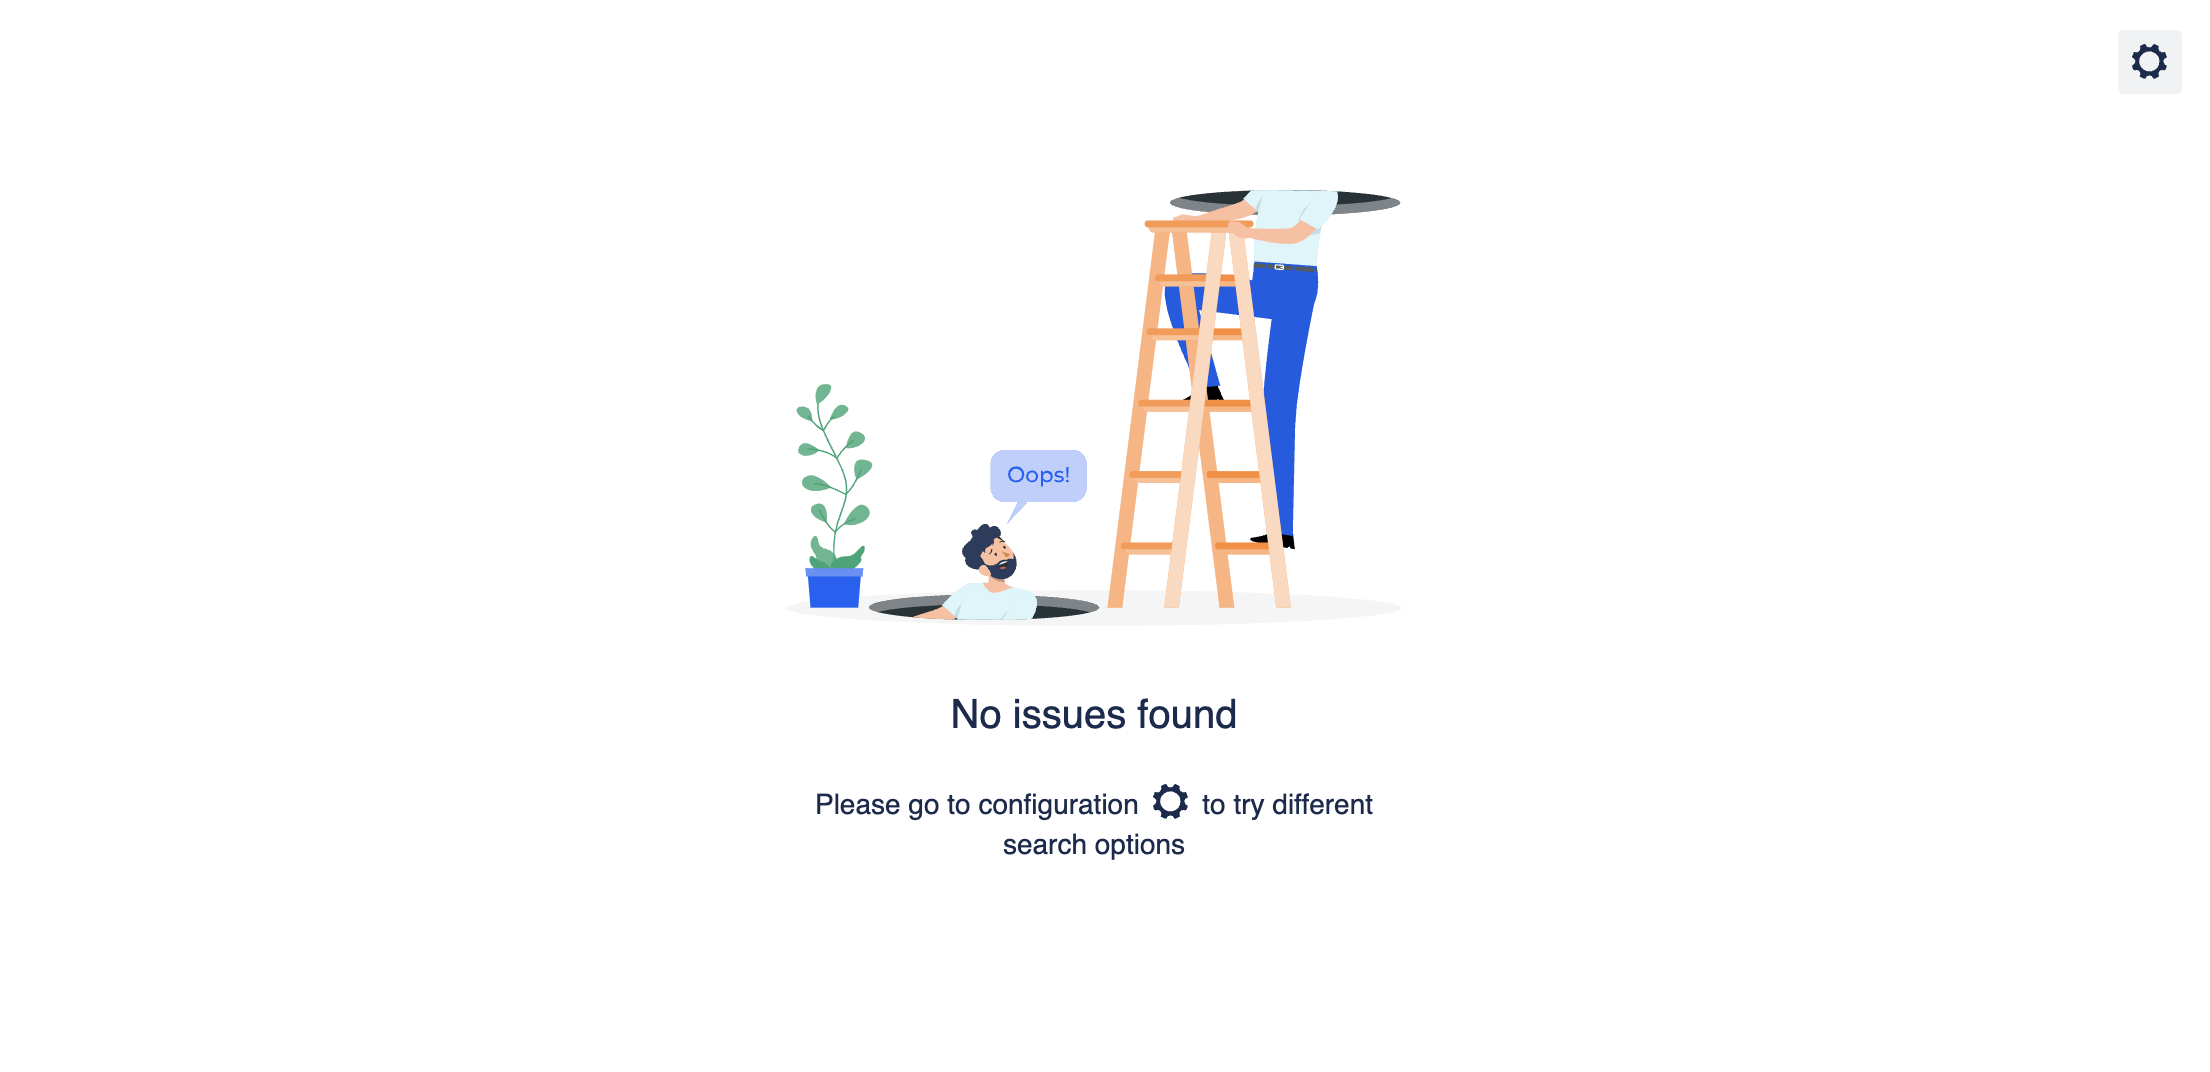
If you see this screen, it means that no Jira work items match your current filter settings.
What to do:
-
Check the selected project
-
Make sure your Time Metric is set up correctly
-
Try adjusting the work item's type, date range, or status filters
-
Go to the gadget configuration settings (gear icon ⚙️) to update your criteria
Key Features
✔ Visual Analysis – Quickly identify trends and anomalies in your workflow.
✔ Custom Metrics – Choose which time metric (e.g., Cycle Time, Lead Time, Time in Progress) to display.
✔ Interactive Zoom – Select a section of the chart with your mouse to zoom in for detailed analysis.
✔ Real-time Updates – The data is updated automatically as new work item data becomes available.
Keep track of every work item with Time Metrics Tracker
Haven’t worked with the app yet? Give it a try>>>