
Time Metrics Tracker for Jira Cloud helps track how long work items stay in each status and generate clear performance reports. This guide explains how to configure, filter, and export those results for analysis.
Filter data
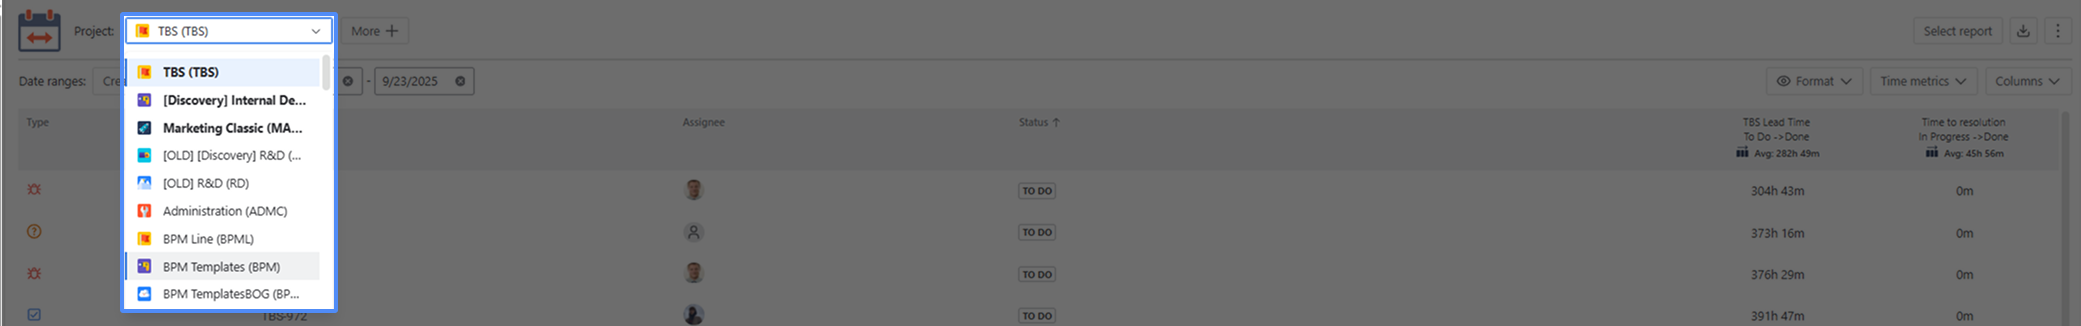
Select the project to filter work items.
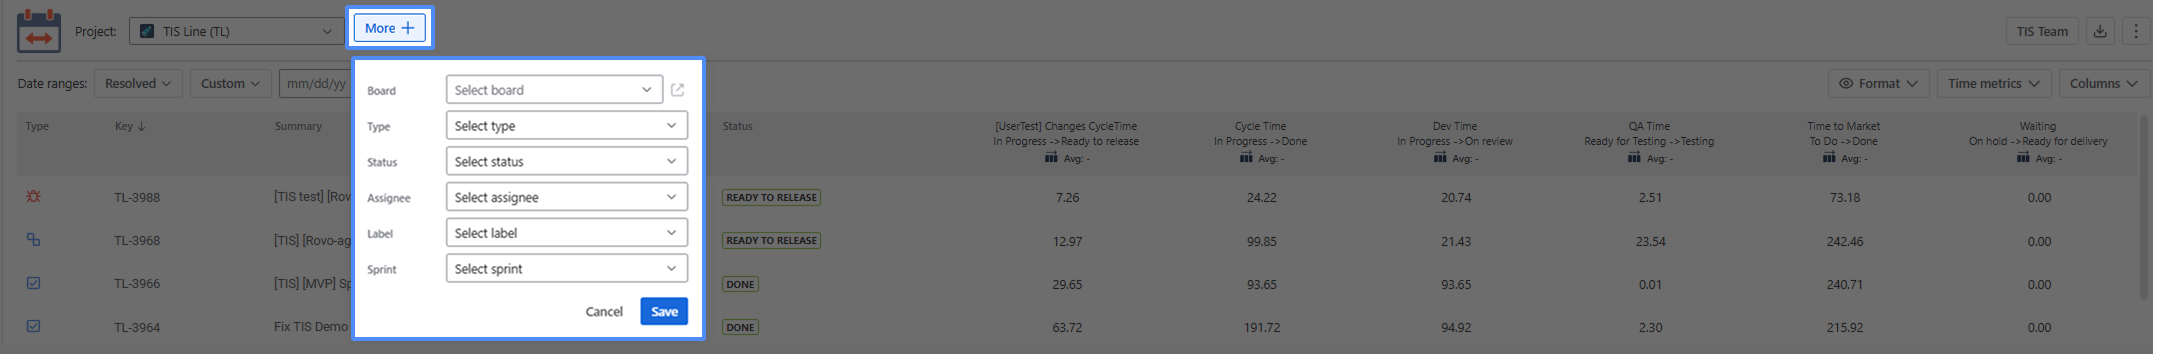
After that, click «More +» and sort the data by:
-
Board – Select board
-
Type – Select type
-
Status – Select status
-
Assignee – Select assignee
-
Label – Select label
-
Sprint – Select sprint
Date Ranges
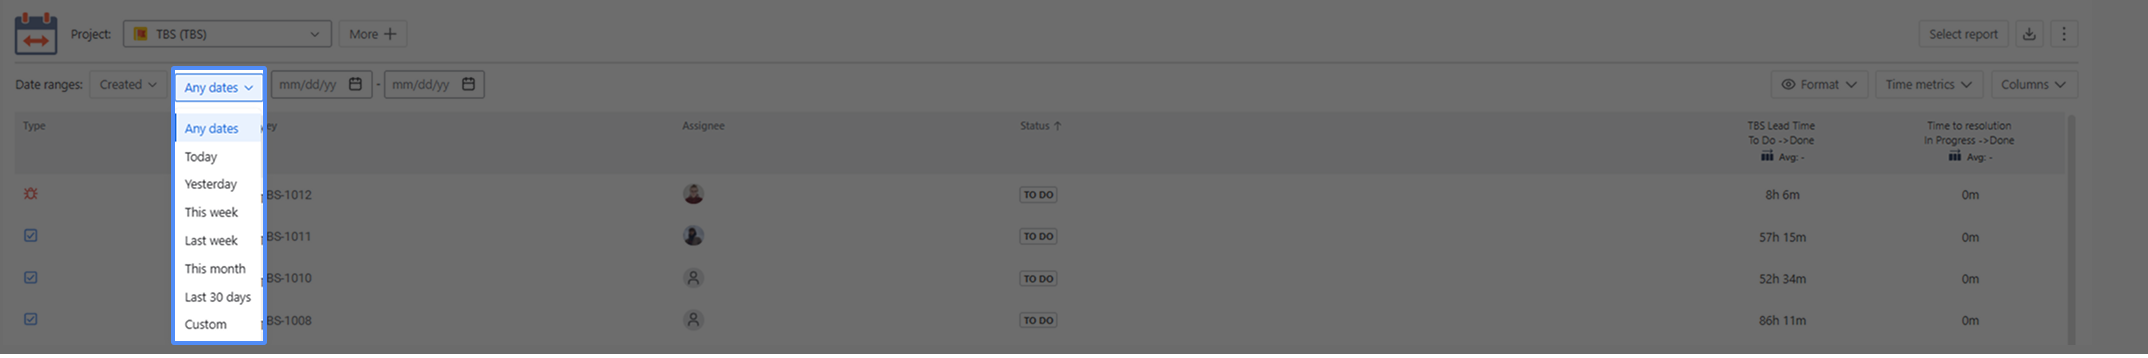
Use the Date ranges functionality to customize report timeframes.

When clicking the first bar, you can select three types of date range:
-
Created - dates when the work item was created;
-
Updated - when they were updated;
-
Resolved - dates when the tasks were finished.
Then, you can choose the period for which you want to get the report.
It can be Date ranges (yesterday, last week, this month, etc.) or you can select the custom time duration From date - To date.
Choose a Time format
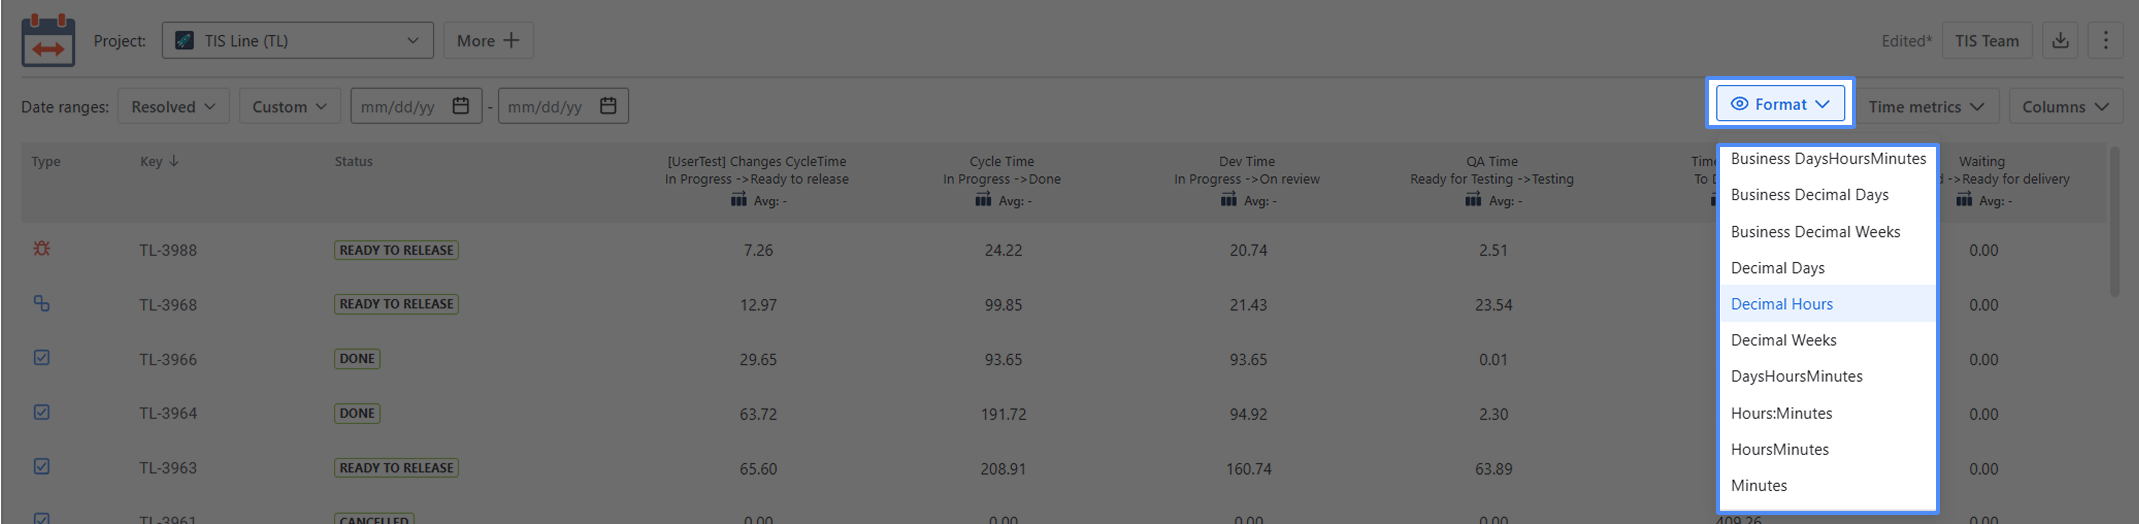
The Format option lets you select the time format of status duration:
-
DHM (Days, Hours, Minutes)
-
HM (Hours, Minutes)
-
h:m (hours:minutes)
-
M (Minutes)
-
Decimal Hours
-
Decimal Days
-
Decimal Weeks
-
Business DHM,
-
Business Decimal Days,
-
Business Decimal Weeks.
*Please note, to export data for analysis, choose one of the Decimal time formats. It will enable you to perform calculations on the exported data and build charts.
Reports
The Time Metrics Tracker report contains columns with information about work items (Type, Key, Summary - are constant; Assignee, Status, Time between statuses, etc. - may change at "Columns" menu) and a column with the time between statuses of every work item (which you have configured at the configuration).
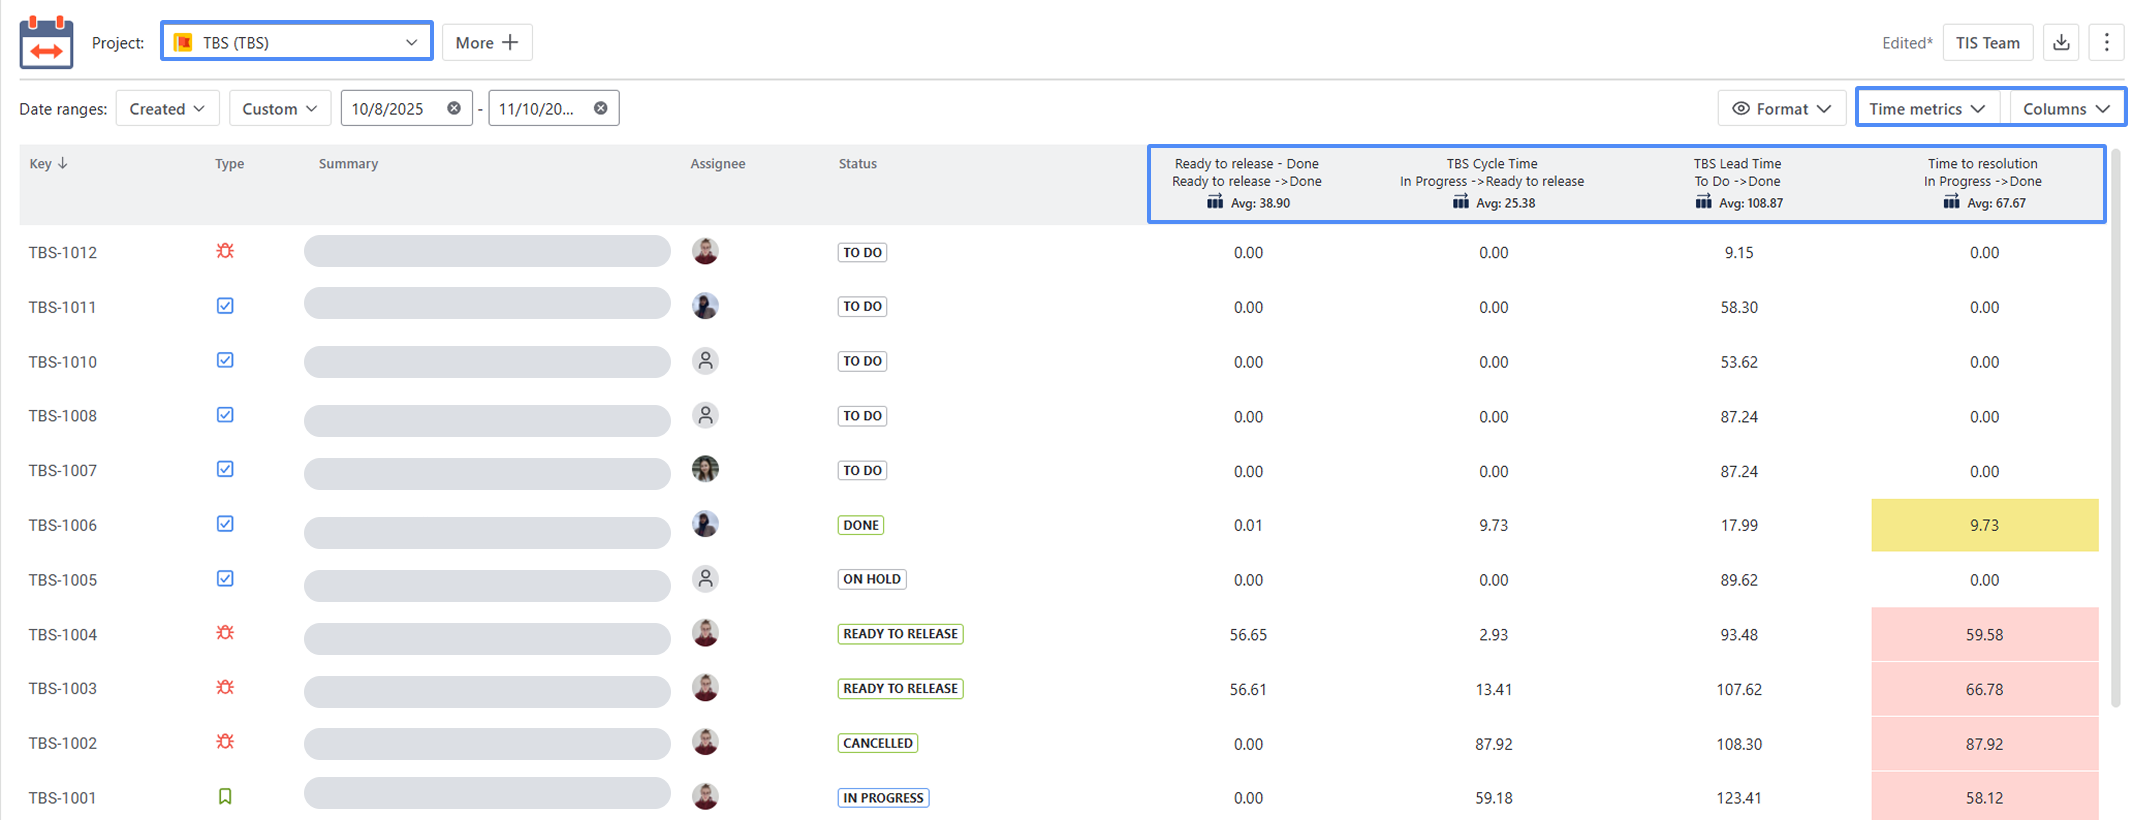
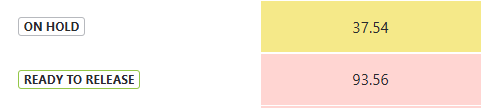
Colors for warning:
Warning time limit - yellow
Critical time limit - red
Export
Export Time Between Statuses data as XLSX or CSV files and analyze it using Excel or Google Spreadsheets.
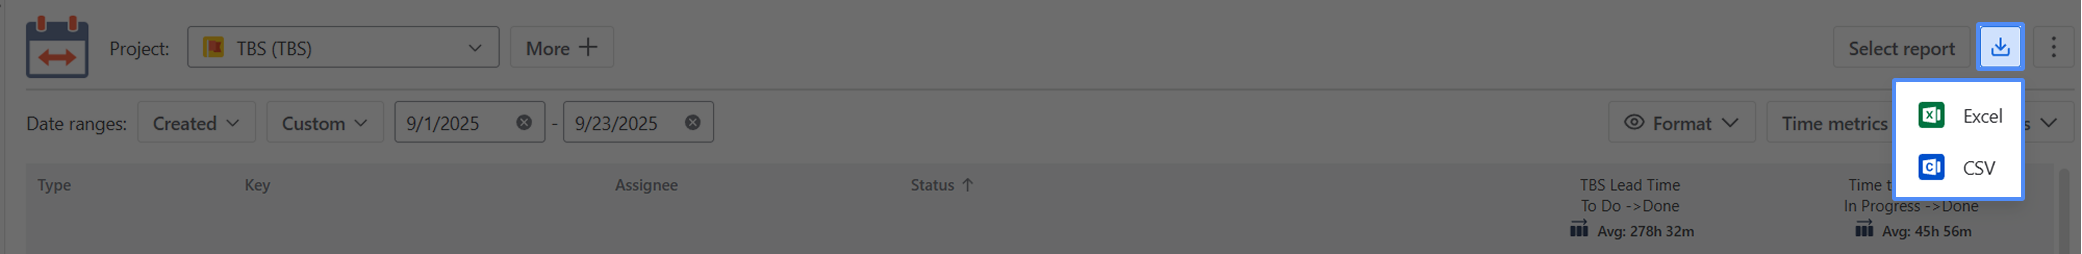
*Please note, to extract data for analysis, choose one of the Decimal time formats. It will enable you to perform calculations on the exported data and build charts.
If you need help or want to ask questions, please contact us through a SaaSJet Support or via email support@saasjet.atlassian.net
Haven't used Time Metrics Tracker yet? Then try it now! >>>