
See how long work items will stay in statuses right on the dashboard your team already uses.
Overview
The Forecast by Time in Status gadget brings Forecast data directly to your Jira dashboard.
Forecast uses historical data from similar completed work items to estimate how much time unfinished work is expected to spend across selected workflow statuses. Use the gadget to monitor this expected time alongside the time already spent and spot work items that are taking longer than expected.
Before you begin
-
The Forecast gadget is available with the Advanced edition of Time in Status.
-
You need access to Time in Status reports and dashboard gadgets.
-
Create at least one Forecast configuration on the Forecasts page before configuring the gadget.
-
A Work schedule is required for the calculation.
Set up the Forecast gadget
-
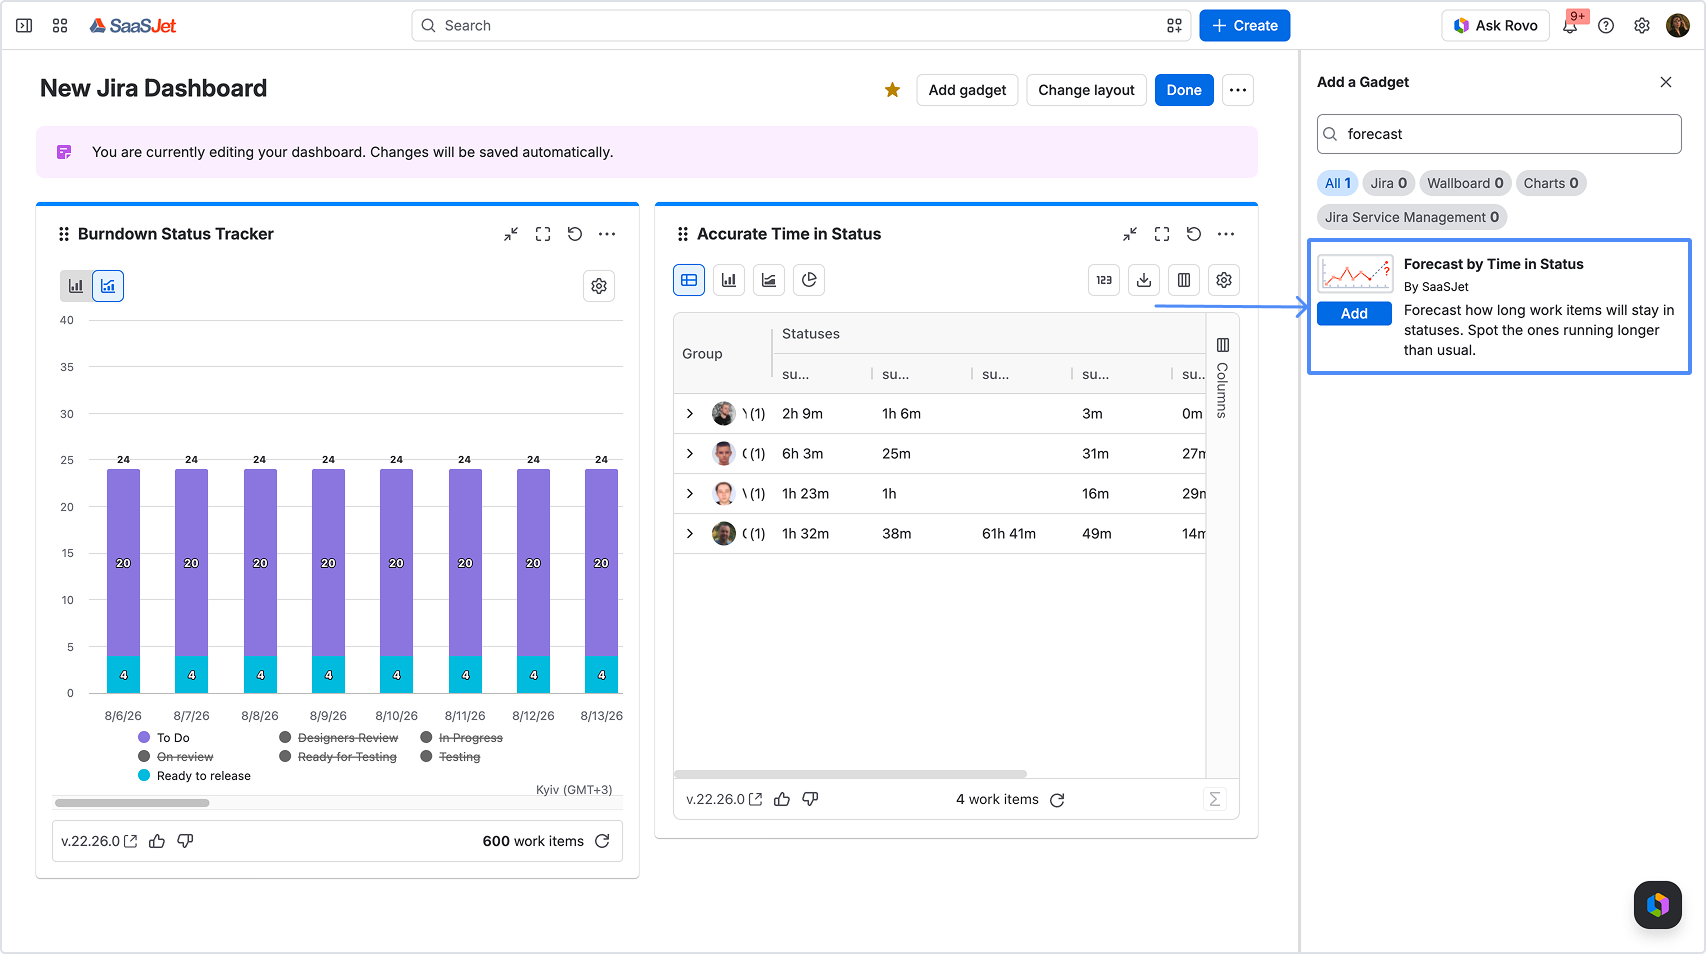
Open your Jira dashboard and click Add gadget.
-
Search for Forecast by Time in Status and add it to the dashboard.
-
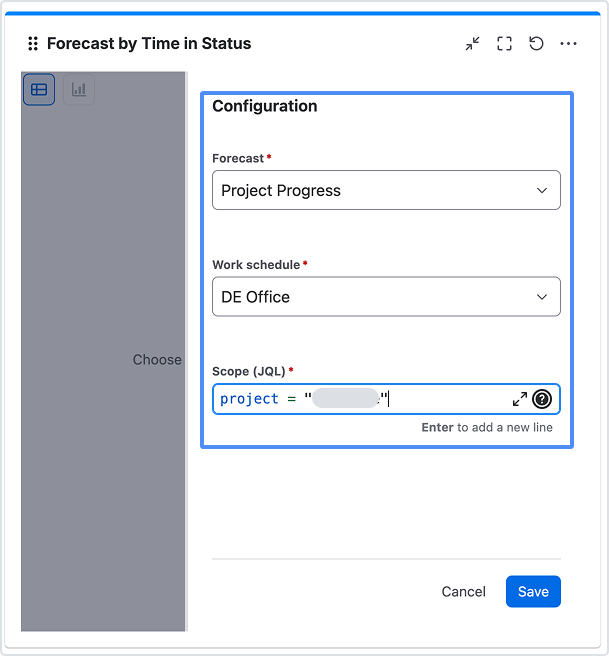
Open Configuration in the gadget.
-
Select a saved Forecast.
The selected Forecast determines:
-
-
-
the statuses included in the forecast;
-
the historical data used for comparison;
-
the Compare by fields;
-
the target end date field, if configured.
-
-
5. Select a Work schedule.
Time in forecast statuses is calculated according to this schedule, excluding configured non-working time.
-
Enter the Scope (JQL) to define the work items you want to display.
-
Select Save.
Understand the forecast
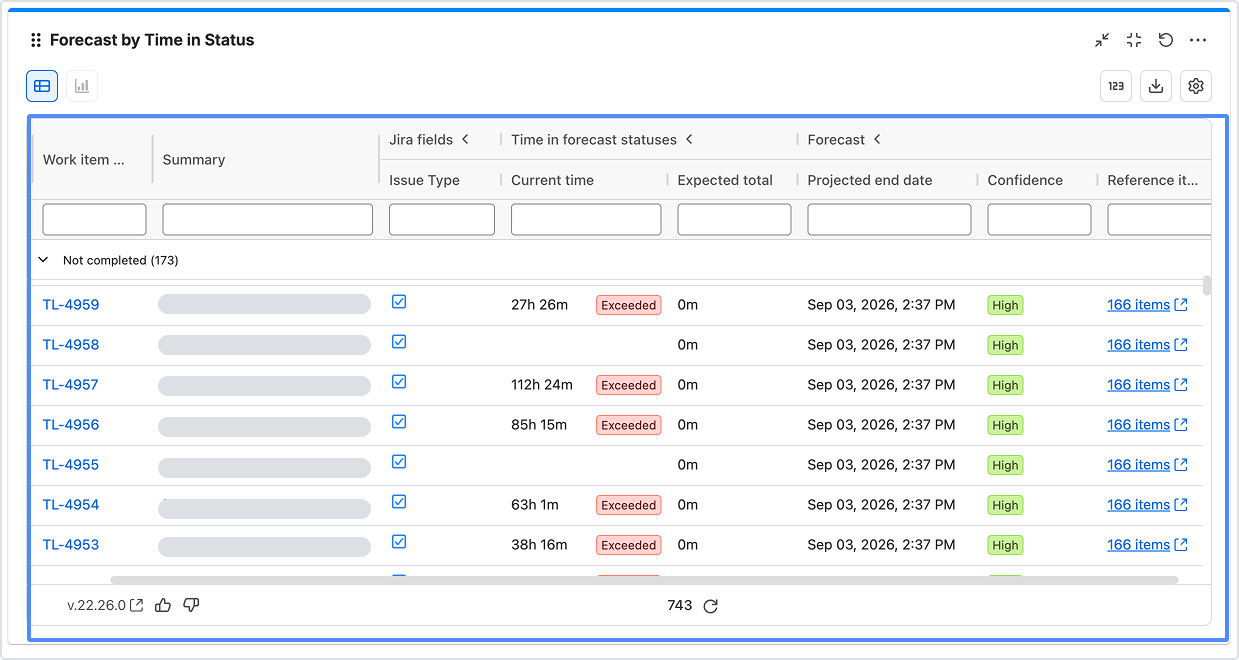
For every not-completed work item, Time in Status finds comparable completed work items using the Compare by fields configured in the selected Forecast.
For example, if Work Type and Assignee are selected, a work item is compared with completed work items that have matching values for both fields.
The Expected total is based on the median total time those comparable work items spent across all selected forecast statuses.
Forecast columns
|
Column |
What it shows |
|---|---|
|
Current time |
Time the work item has already spent across the selected forecast statuses |
|
Expected total |
Expected total time across the forecast statuses, based on comparable completed work |
|
Target end date |
Date from the Jira field selected as the target end date in the Forecast configuration |
|
Projected end date |
Projected date calculated from the remaining expected time and the selected work schedule |
|
Variance |
Difference between the projected end date and the target end date |
|
Confidence |
Confidence level based on the number of comparable completed work items |
|
Reference items |
Number of completed work items used for the forecast |
If no target end date field is configured, Target end date and Variance are not displayed.
For completed work items, the gadget shows the actual accumulated time across the forecast statuses. Forecast values are not calculated for completed work.
Confidence levels
Confidence shows how much comparable historical data supports the forecast.
|
Comparable completed work items |
Confidence |
|---|---|
|
Fewer than 2 |
Forecast not available |
|
2–11 |
Low |
|
12–29 |
Medium |
|
30 or more |
High |
Forecast uses strict comparison groups. If fewer than two comparable completed work items are available, the comparison criteria are not automatically broadened.
When available, select the value in Reference items to open the Jira work items used as the comparison group.
Filtering, format, and export
You can:
-
use column filters to narrow the work items displayed in the table;
-
change the Format used for duration values;
-
Refresh the gadget to recalculate the forecast using the latest data;
-
expand or collapse the Not completed and Completed groups;
-
export the gadget data to CSV or XLSX.
Changing the duration format changes how values such as Current time and Expected total are displayed without recalculating the forecast.
When no forecast appears
The gadget may display the following states depending on its configuration and available data:
-
No work items found — your scope JQL matched nothing. Adjust the query.
-
No work items to forecast — everything in scope is complete.
-
Not enough history to forecast — lengthen the reference period, widen the reference JQL, or use fewer Compare by fields.
-
Forecast not found — the forecast this gadget used was deleted. Select another one.
-
Couldn't load the forecast — data could not be retrieved. Refresh to retry.
Limitations
-
-
Chart view is not available yet. The Chart option is visible but disabled.
-
At least two comparable completed work items are required to calculate a forecast.
-
Comparison criteria are not automatically relaxed when there is not enough historical data.
-
Expected total is calculated across all selected forecast statuses; the gadget does not provide a separate expected value for each status.
-