
The Time in Status report shows the total time an item has stayed in each status.
-
Choose the Time in Status report
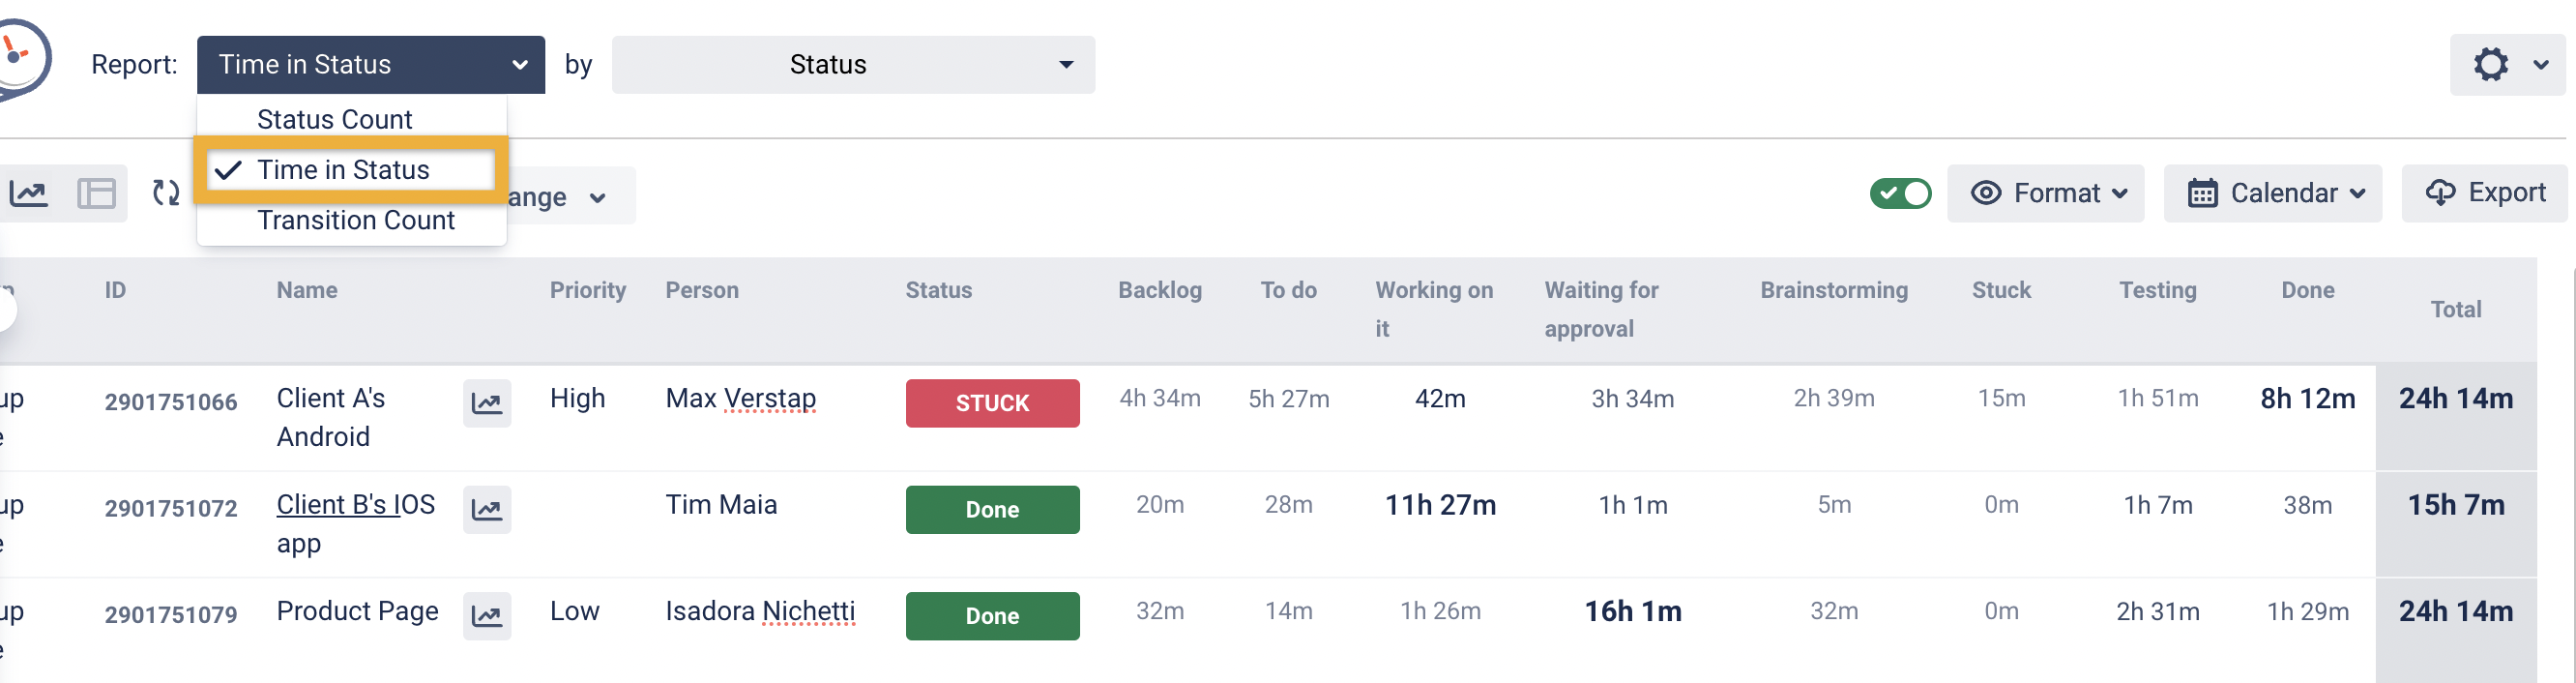
-
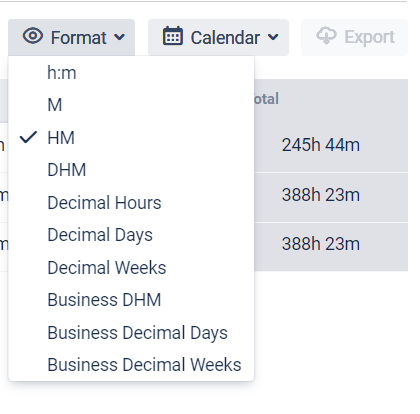
Choose the time format type that will be represented on the grid.
-
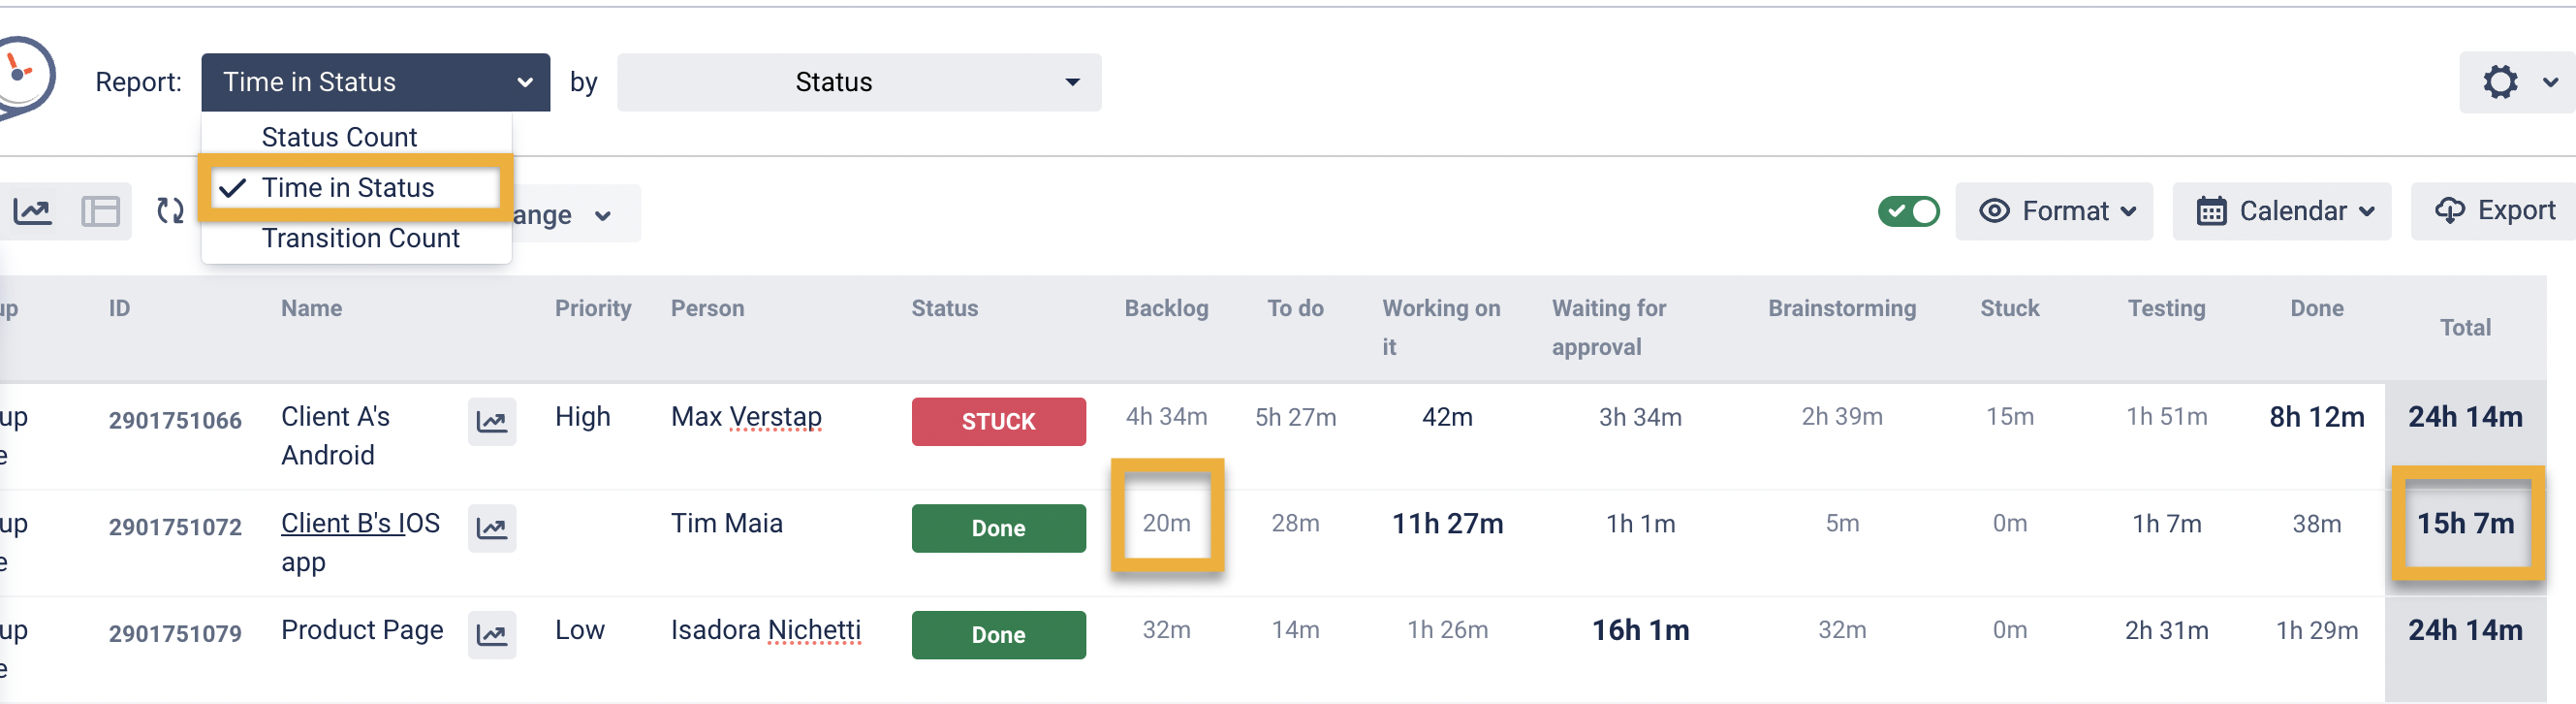
Get all the data on the grid as it’s shown below.
The time in status data that is displayed on the grid calculates in such a way:
For example, the Item was in the Backlog Status for 20 minutes, then moved to the To Do Status. After a while, the Item moved to the Working on it Status and stayed there for 11 hours 27 minutes until it moved to another Status. So the time in the To-Do Status for this Item is 15 hours and 7 minutes.
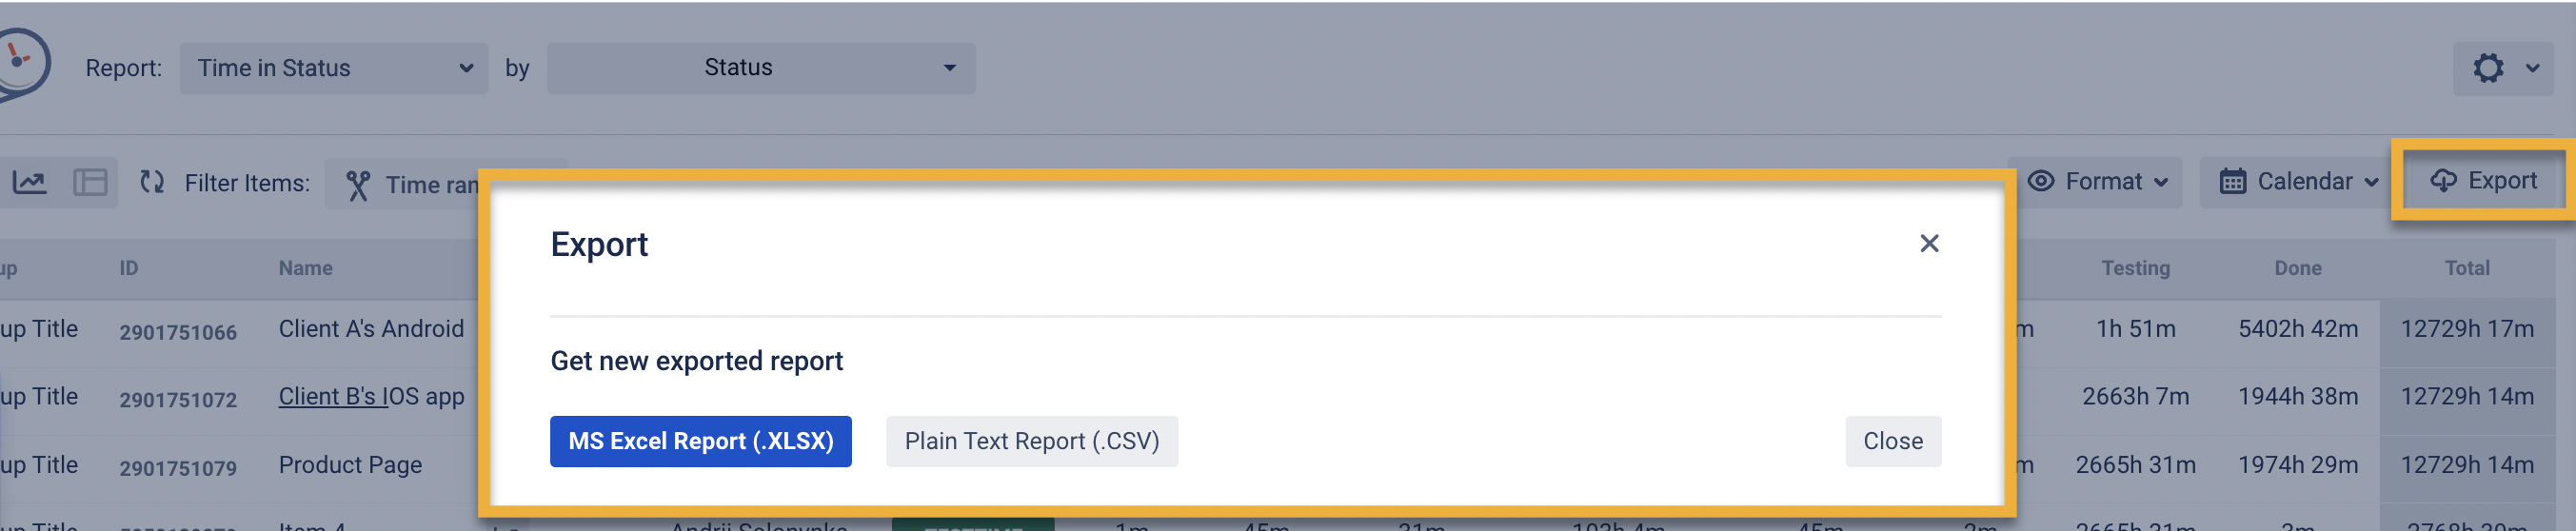
Don't forget that you can export reports in .xlsx and .csv formats.
If you need help or want to ask questions, please contact SaaSJet Support or email us at support@saasjet.atlassian.net
Haven't used this add-on yet? Try it now >>> Time in Status app for Monday.com