
The Average time option shows the average amount of time tasks spend in each status.
Using the Time in Status report, sales representatives can analyze how much time leads spend in each status and automatically calculate the average time spent in every stage.
Step 1. Open the Time in Status report
-
Navigate to your table
-
Open the Time in Status view.
-
In the report configuration, select:
-
Report: Time in Status
-
Group by: Status
.png?cb=861d2217b6bd6f111462fd6b445eb734)
The report will display how much time each lead spent in every status of the pipeline.
Step 2. Configure the report view
To customize how the report is displayed:
-
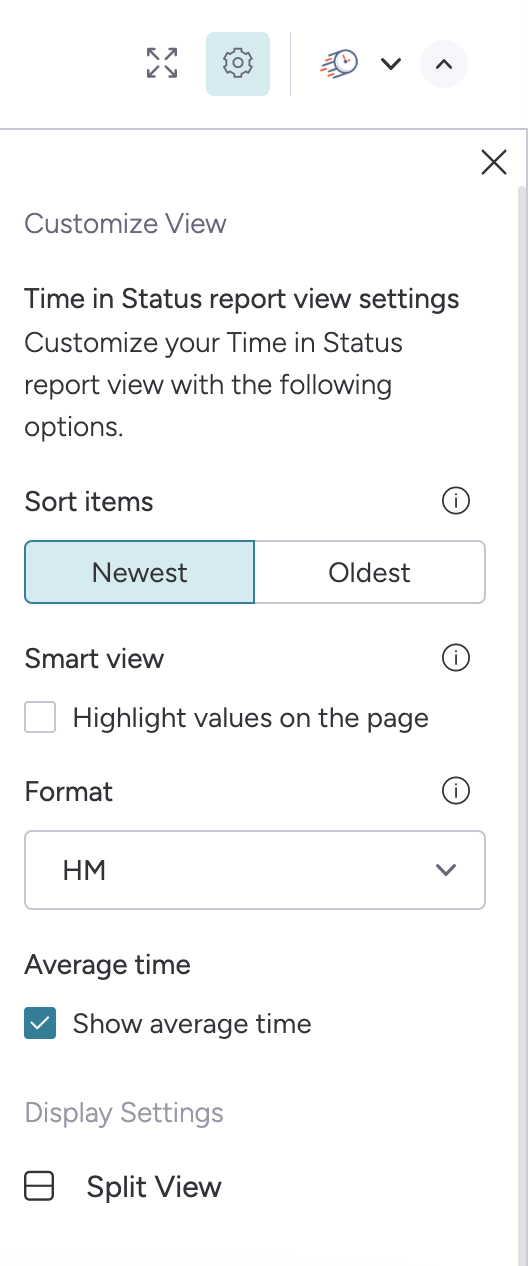
Click the gear icon in the top-right corner of the report.
-
In the Time in Status report view settings, you can configure:
-
Sort items (Newest or Oldest)
-
Smart view options
-
Time format (for example, Hours and Minutes)
Step 3. Enable Average Time calculation
To analyze pipeline efficiency, you can enable the Average time option.
-
Open the report settings using the gear icon.
-
Enable Show average time.
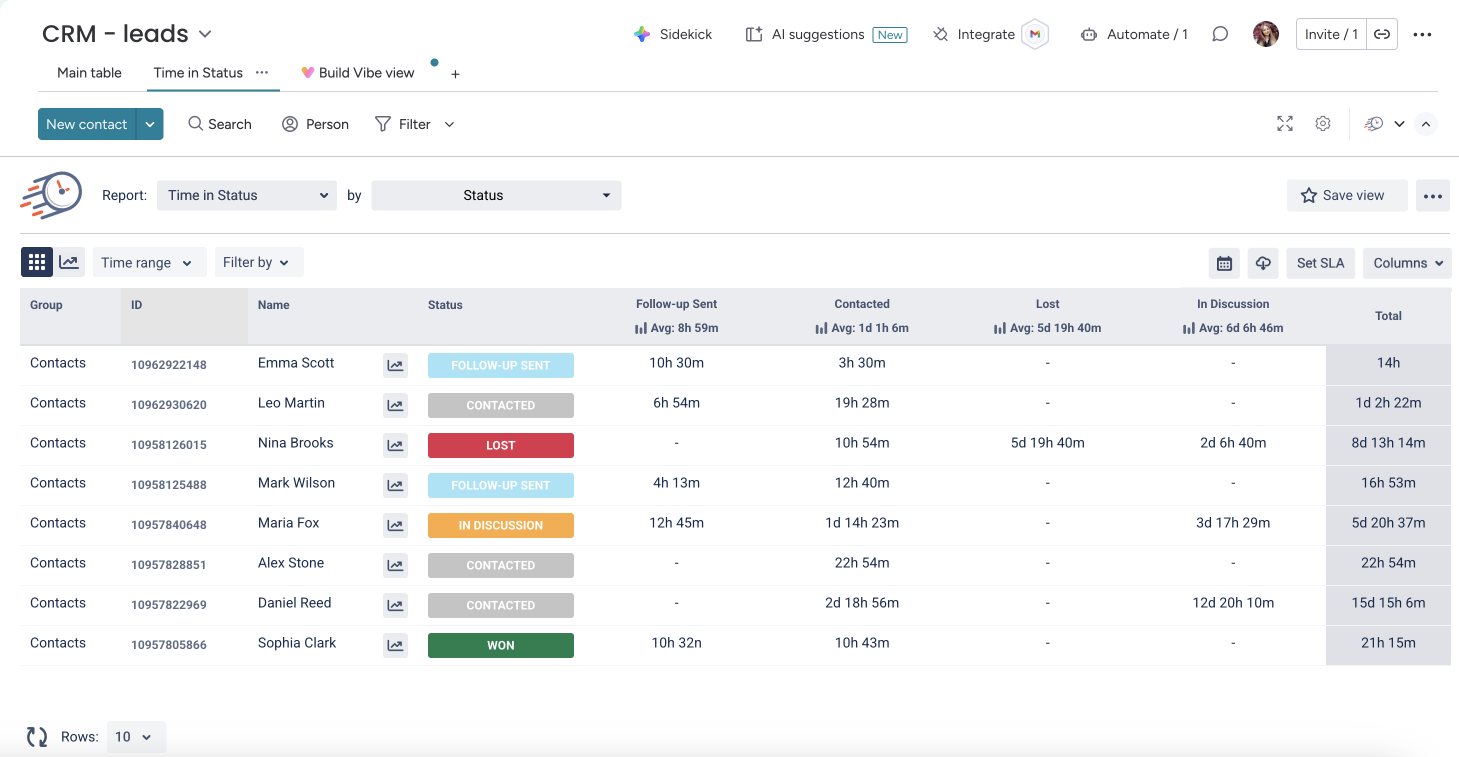
Once enabled, the report will display the average time leads spend in each status in the column headers.
How the average time is calculated
The system calculates the average time using the following logic:
-
It counts the number of items that have been in a particular status.
-
It sums the total time those items spent in that status.
-
It divides the total time by the number of items that actually had time recorded in that status.
Only items that were in the selected status are included in the calculation.
Example
If there are 5 leads in the report, but only 3 of them were in the "Contacted" status, the average time will be calculated based only on those 3 leads.
The system will:
-
Sum the time those leads spent in the Contacted status.
-
Divide the total time by 3.
The resulting value will be displayed in the column header as Avg: [time value].
Result
With the Average time option enabled, sales teams can quickly identify:
-
which stages take the longest
-
where leads are getting stuck
-
how efficiently the pipeline is moving
This helps teams optimize their sales process and improve overall conversion performance.