
Utilize charts for a single Work Item to view its specific statistics.
Reports were a chart for one Work item is available:
-
State Count
-
Time in State
-
Transition Count
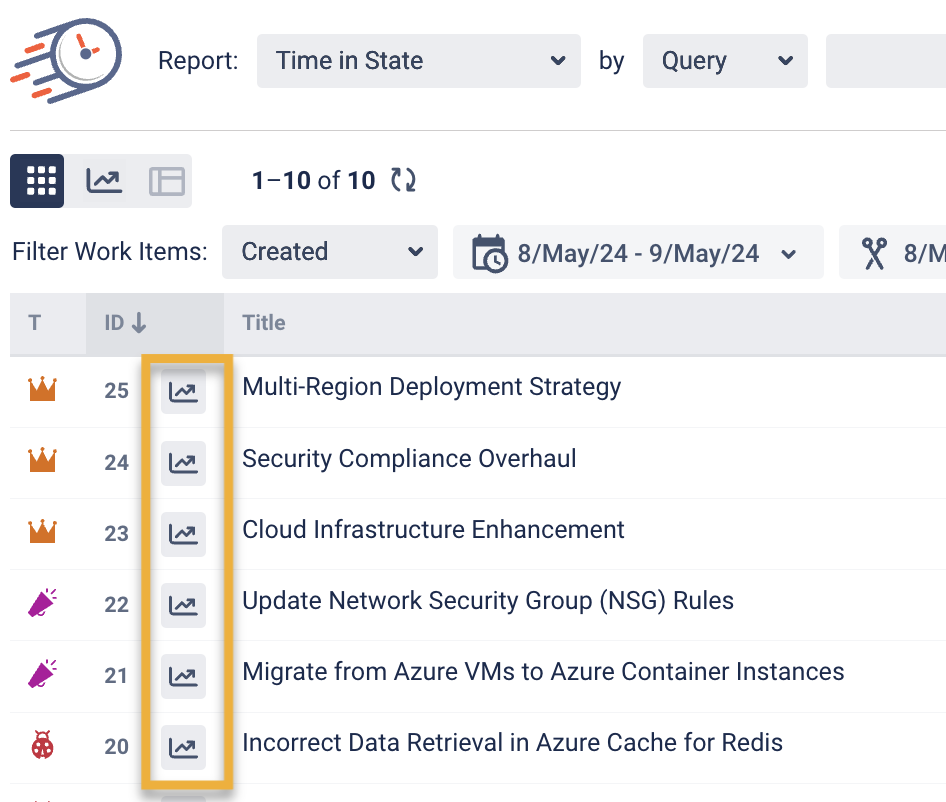
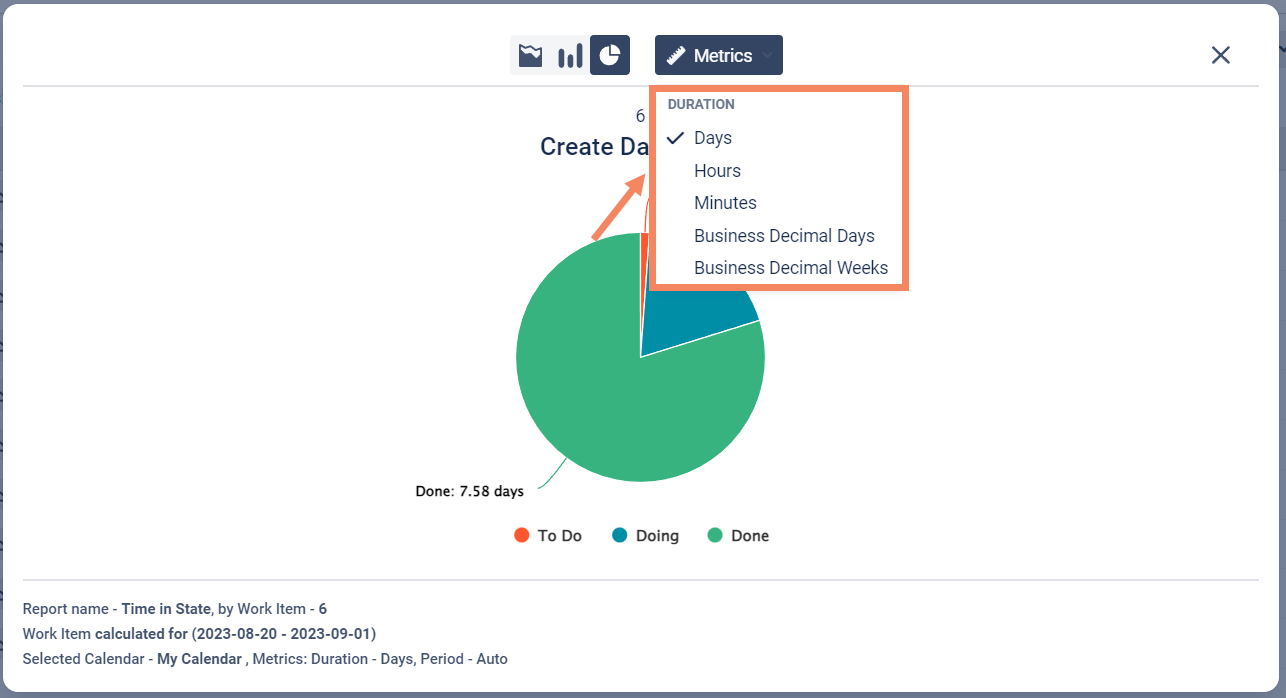
To show the chart, select the needed report and click icons near the line name.
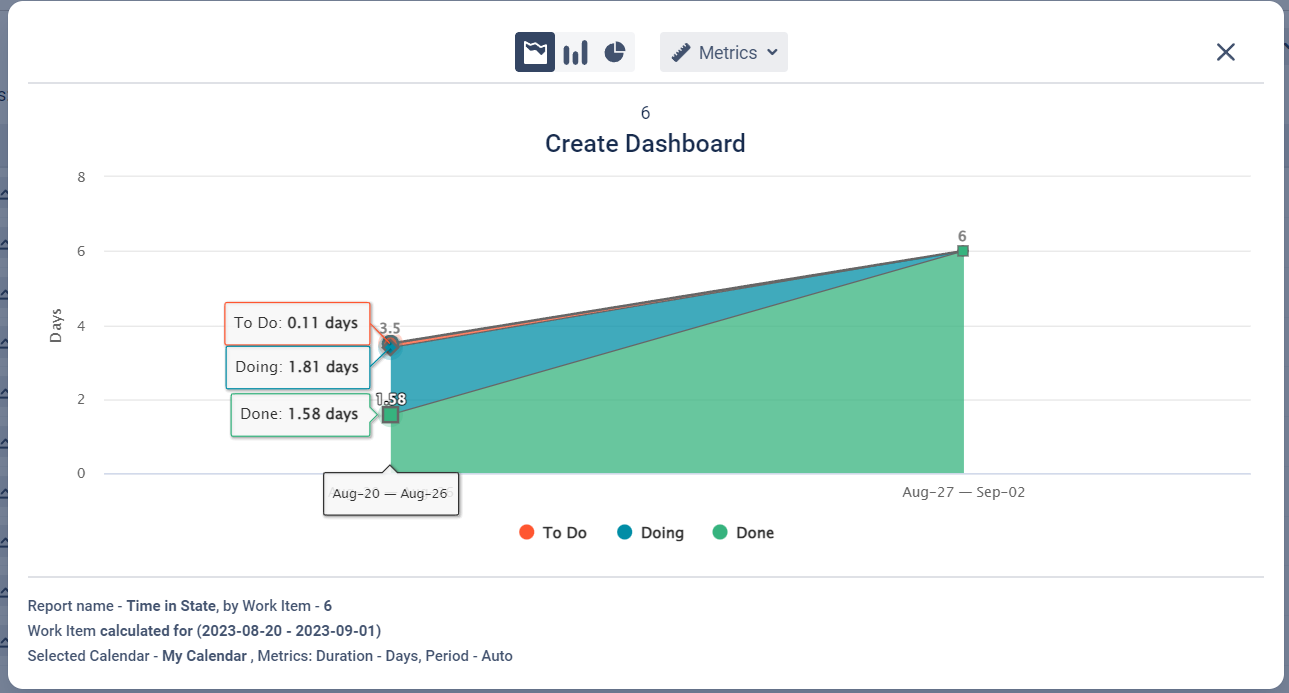
Here are three types of charts:
-
area chart;
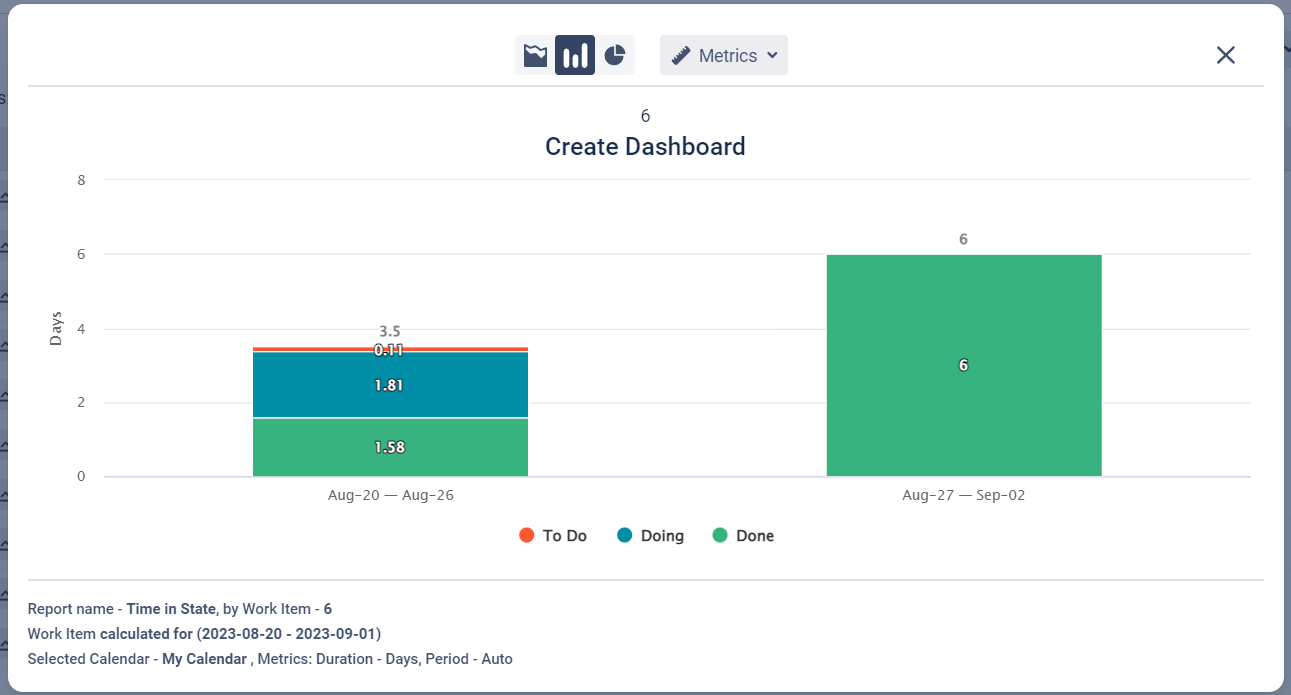
-
column chart;
-
pie chart.
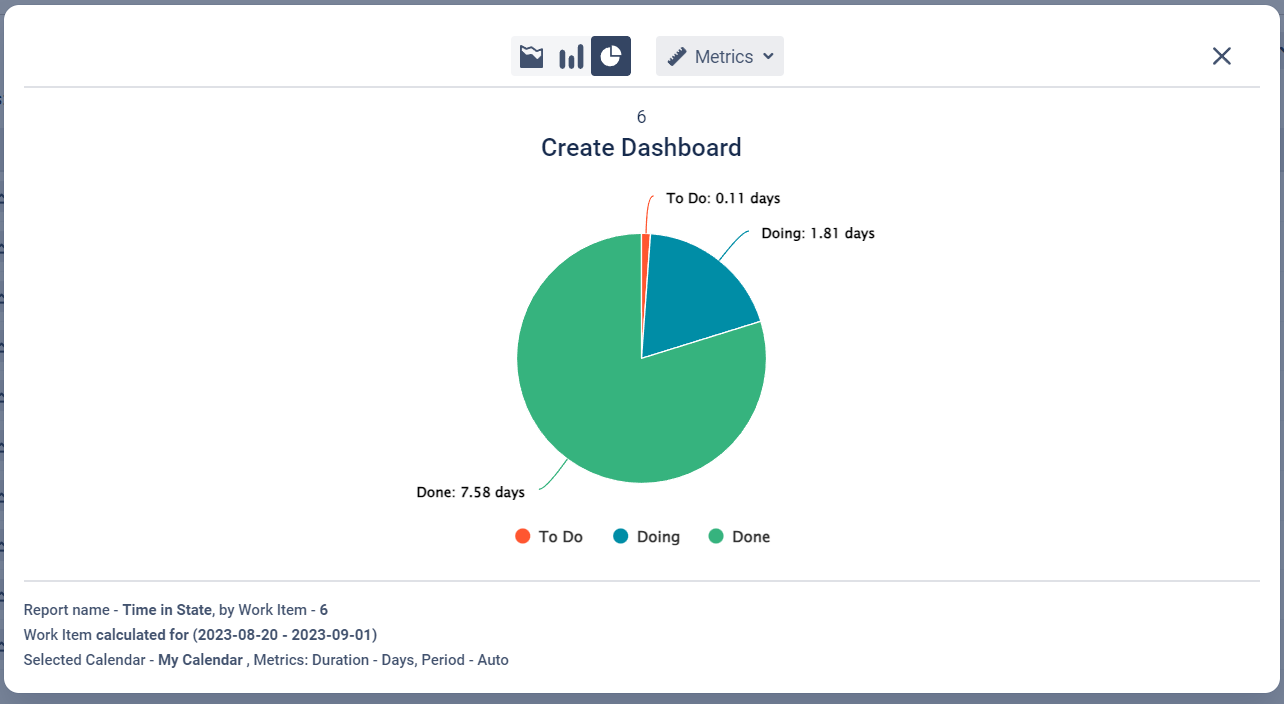
Also, you can change the Metrics of charts.
If you need help or want to ask questions, please contact SaaSJet Support or email us at support@saasjet.atlassian.net
Haven't used this add-on yet? Try it now >>>Time in State for Azure DevOps