Reporting Page Settings Time in State for Azure DevOps
This page will walk you through the various settings available on the Reporting Page.
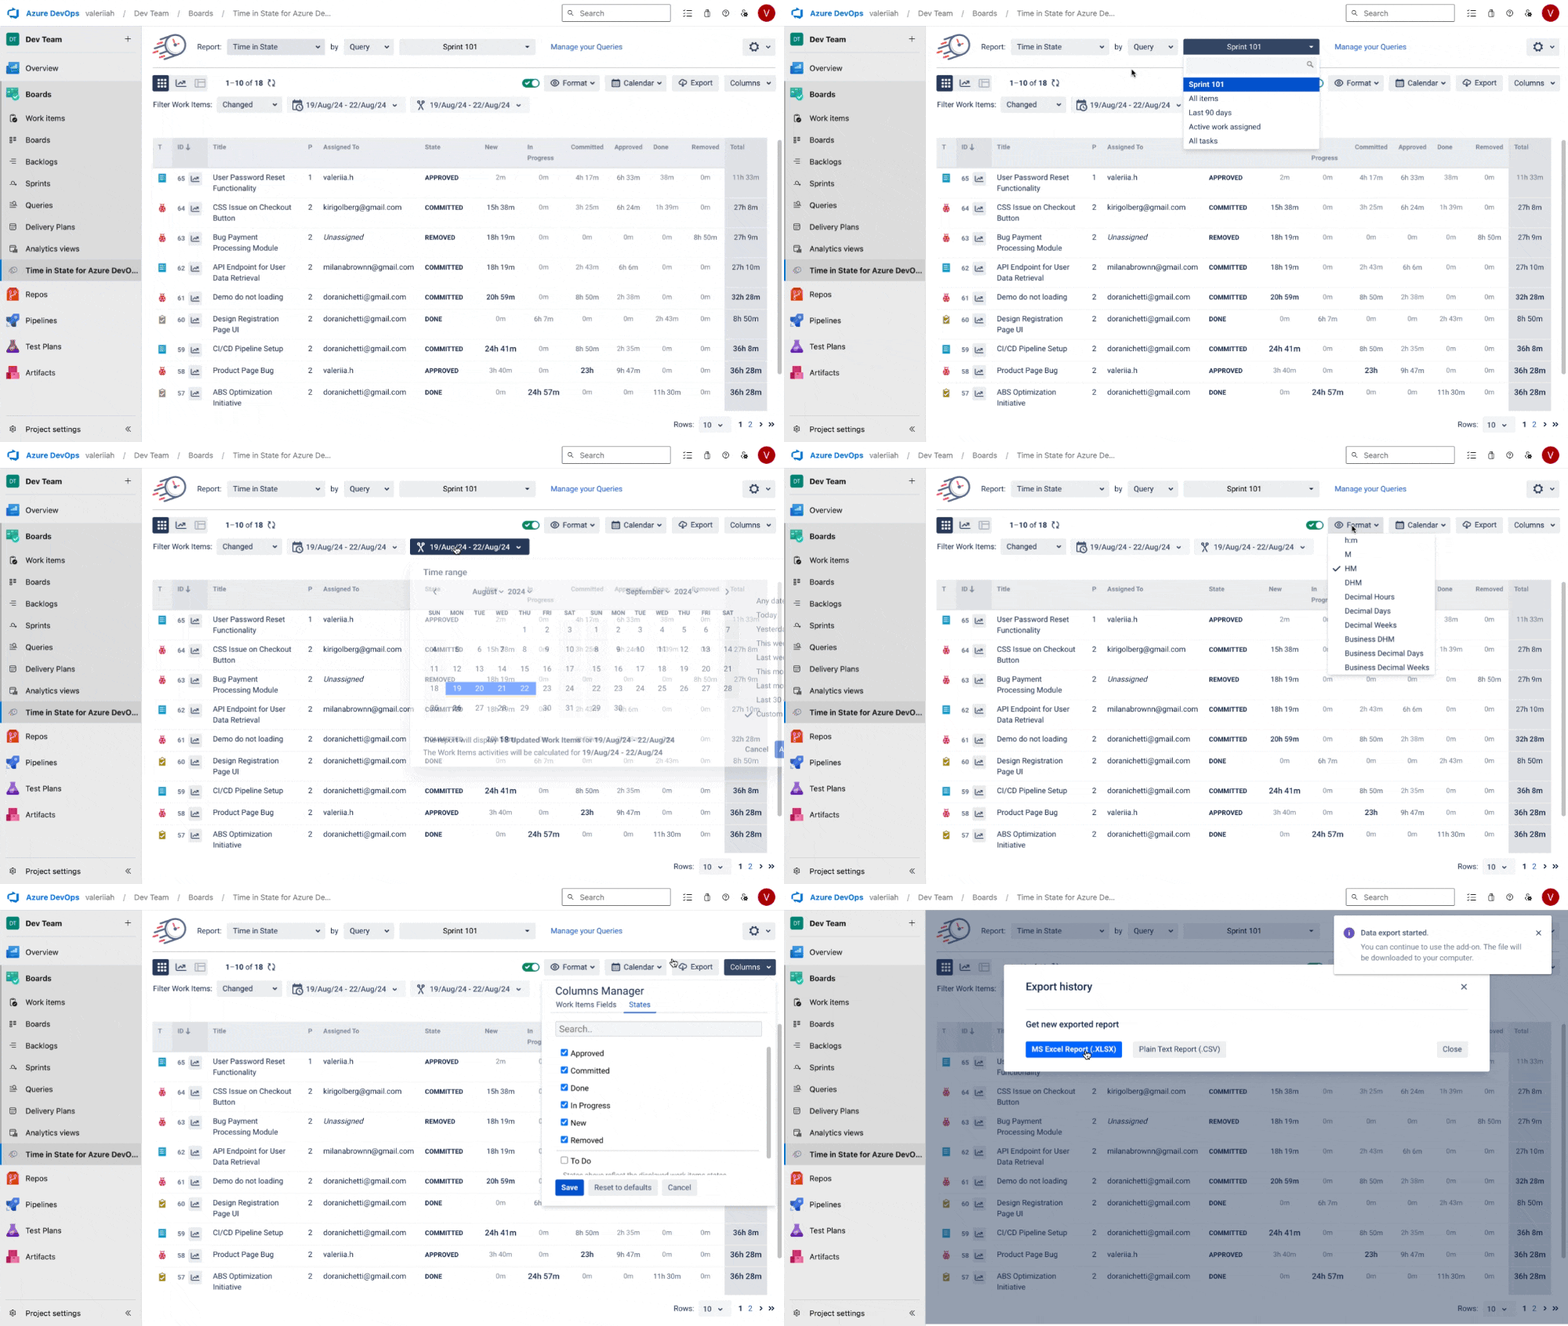
Report generation
Choose a report type you want to generate (see the list of reports below).

When generating the reports, you can filter data by Query.

Filter Work Items
From the drop-down list, you can select three date ranges that allow sorting Work Items depending on the dates of creating, updating, or solving issues.
Created
Changed
Closed

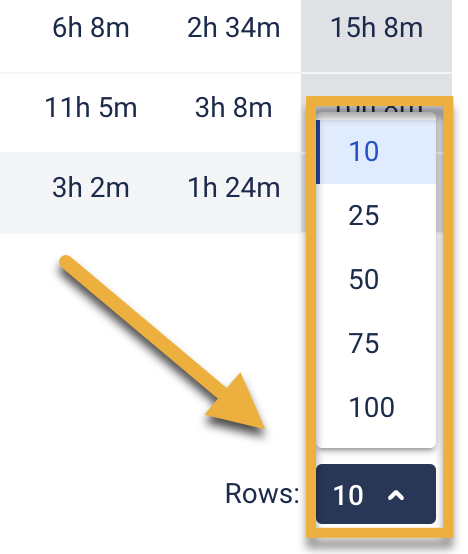
Choose how many rows will be displayed on the grid in the drop-down list.
Work Items and Time Range Periods
More information >> Work Items and Time Range Periods in Azure Time in State

Time format
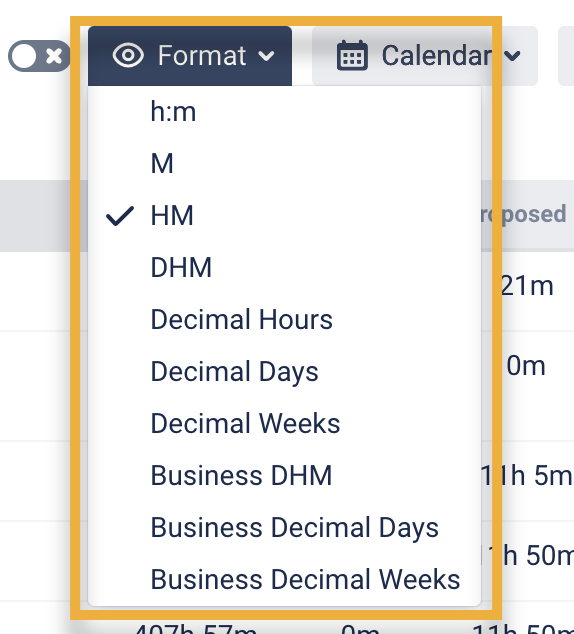
The Format option lets you select the time format how the status duration will be displayed:
DHM (Days, Hours, Minutes),
HM (Hours, Minutes),
h:m (hours: minutes),
M (Minutes),
Decimal Hours,
Decimal Days,
Decimal Weeks,
Business DHM,
Business Decimal Days,
Business Decimal Weeks.
Choose Calendar
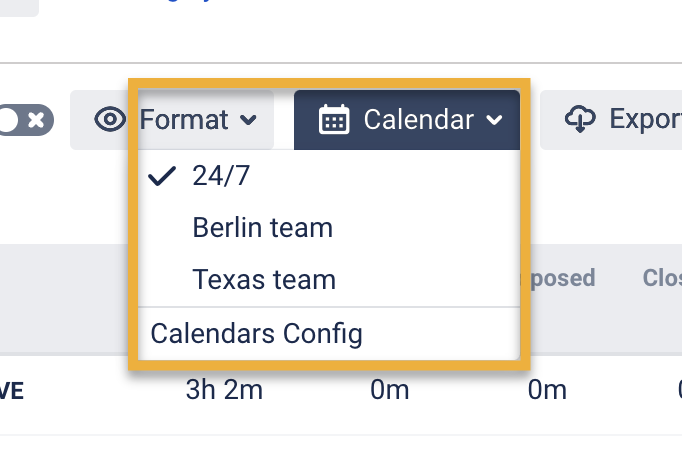
You can choose a custom calendar you've added previously or a default 24/7 to generate data.
Column Manager
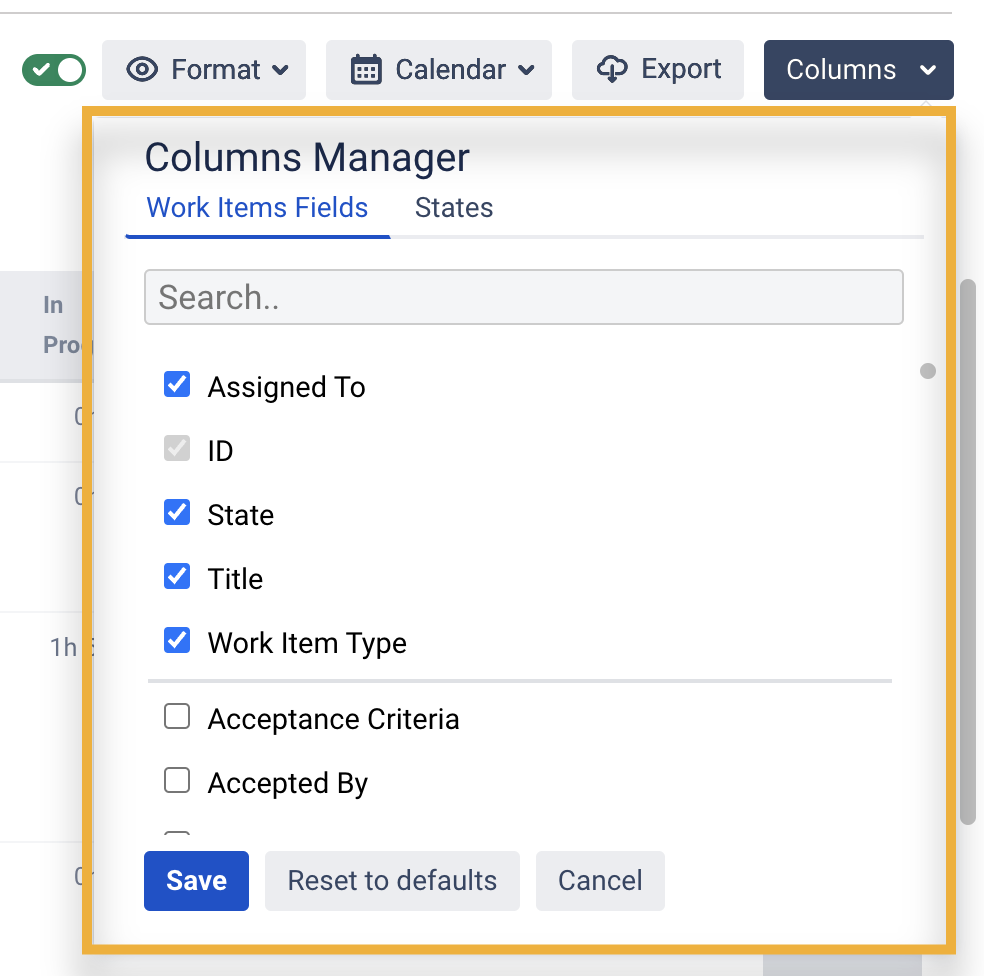
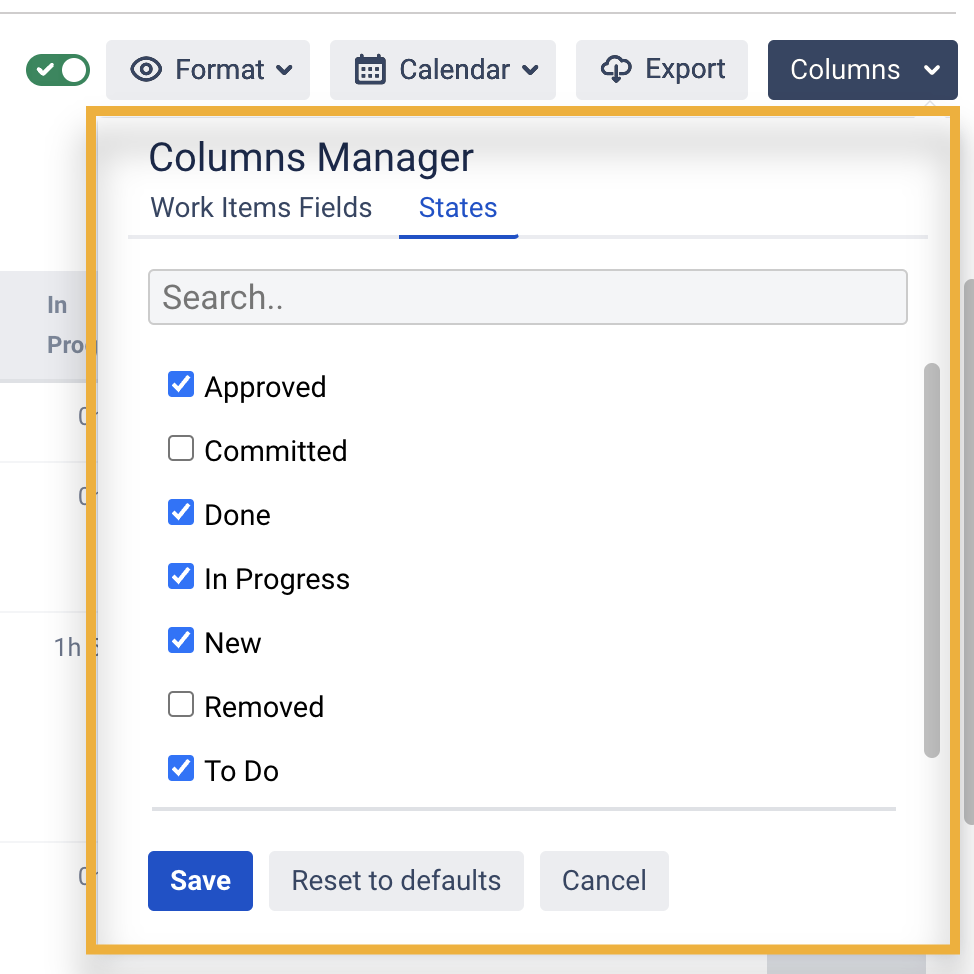
In the Column Manager, you have the ability to control which items are displayed in the report. You can manage Work Items and States.
Under Work Items, you have the ability to manage items such as "Assigned to," "Priority," "ID," etc.
Under States, you can choose which states will be included in the report calculation.
If you opt to exclude a state from the calculation, it will also be reflected in the Total column
Export
Don't forget that you can export reports for further analysis.

To extract data for analysis, please choose one of the Decimal time formats (Decimal Hours, Decimal Days or Decimal Weeks). It will enable you to perform calculations on the exported data and build charts.
Business DHM, Business Decimal Days and Business Decimal Weeks formats show data according to your determined business days.
Sorting Data
Click the column to sort the values in descending or ascending order. You can sort any column.
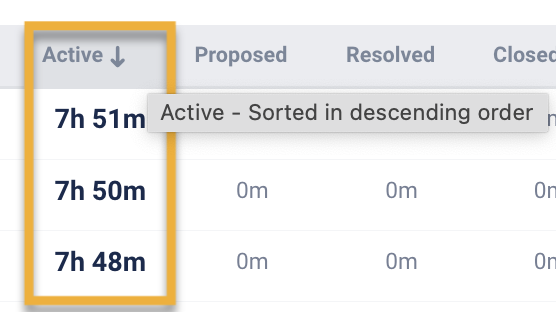
Chart Reports
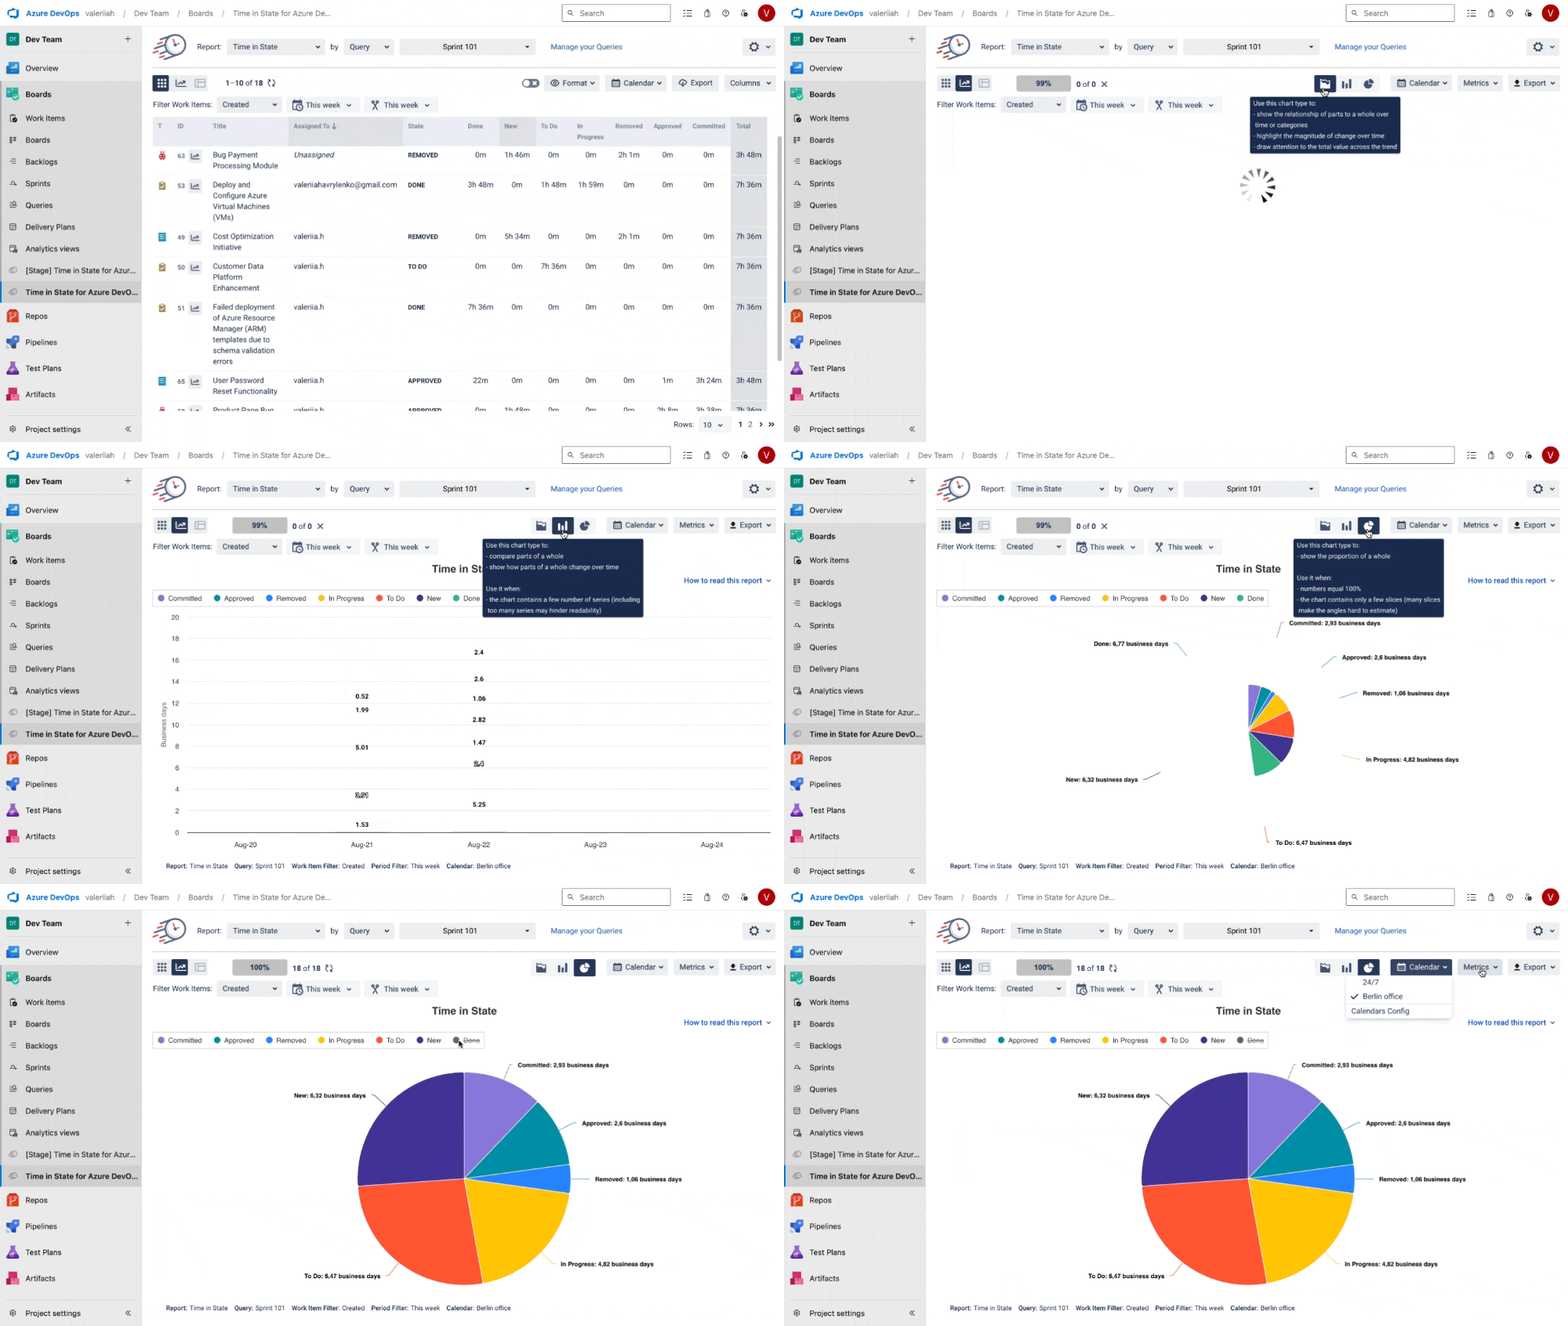
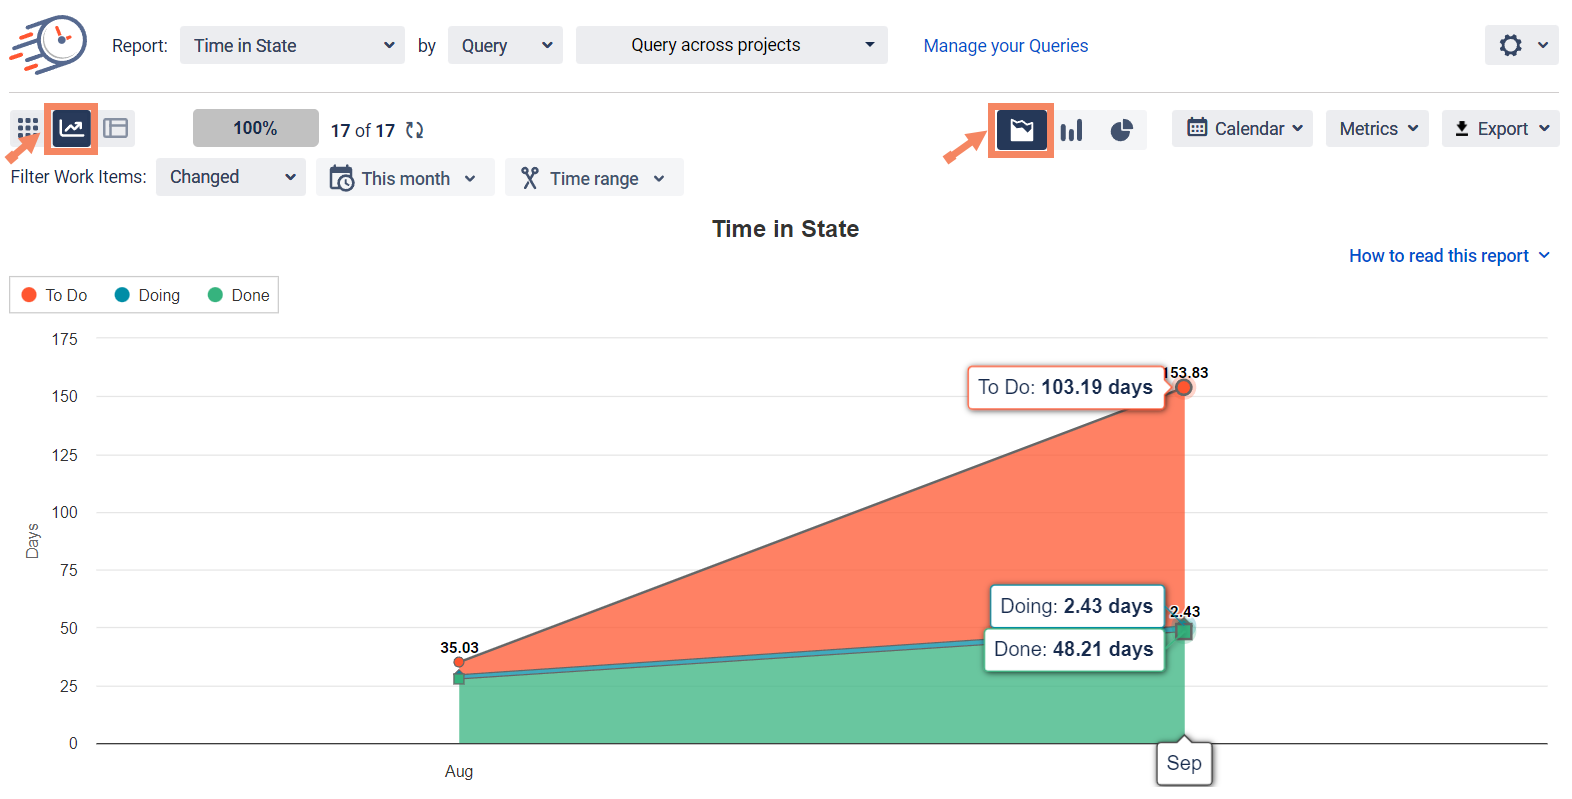
All reports are available as Grid and Charts.
Three types of graphs are available: Pie, Bar and Area Charts.
To try it out go to Chart Reports View.
If you need help or want to ask questions, please contact SaaSJet Support or email us at support@saasjet.atlassian.net
Haven't used this add-on yet? Try it now >>>Time in State for Azure DevOps