
You can create your custom time metrics and generate reports based on them.
Adding a new Time metric
There are two ways to do this:
1 — The first quick way is to create a Time metric on the grid.
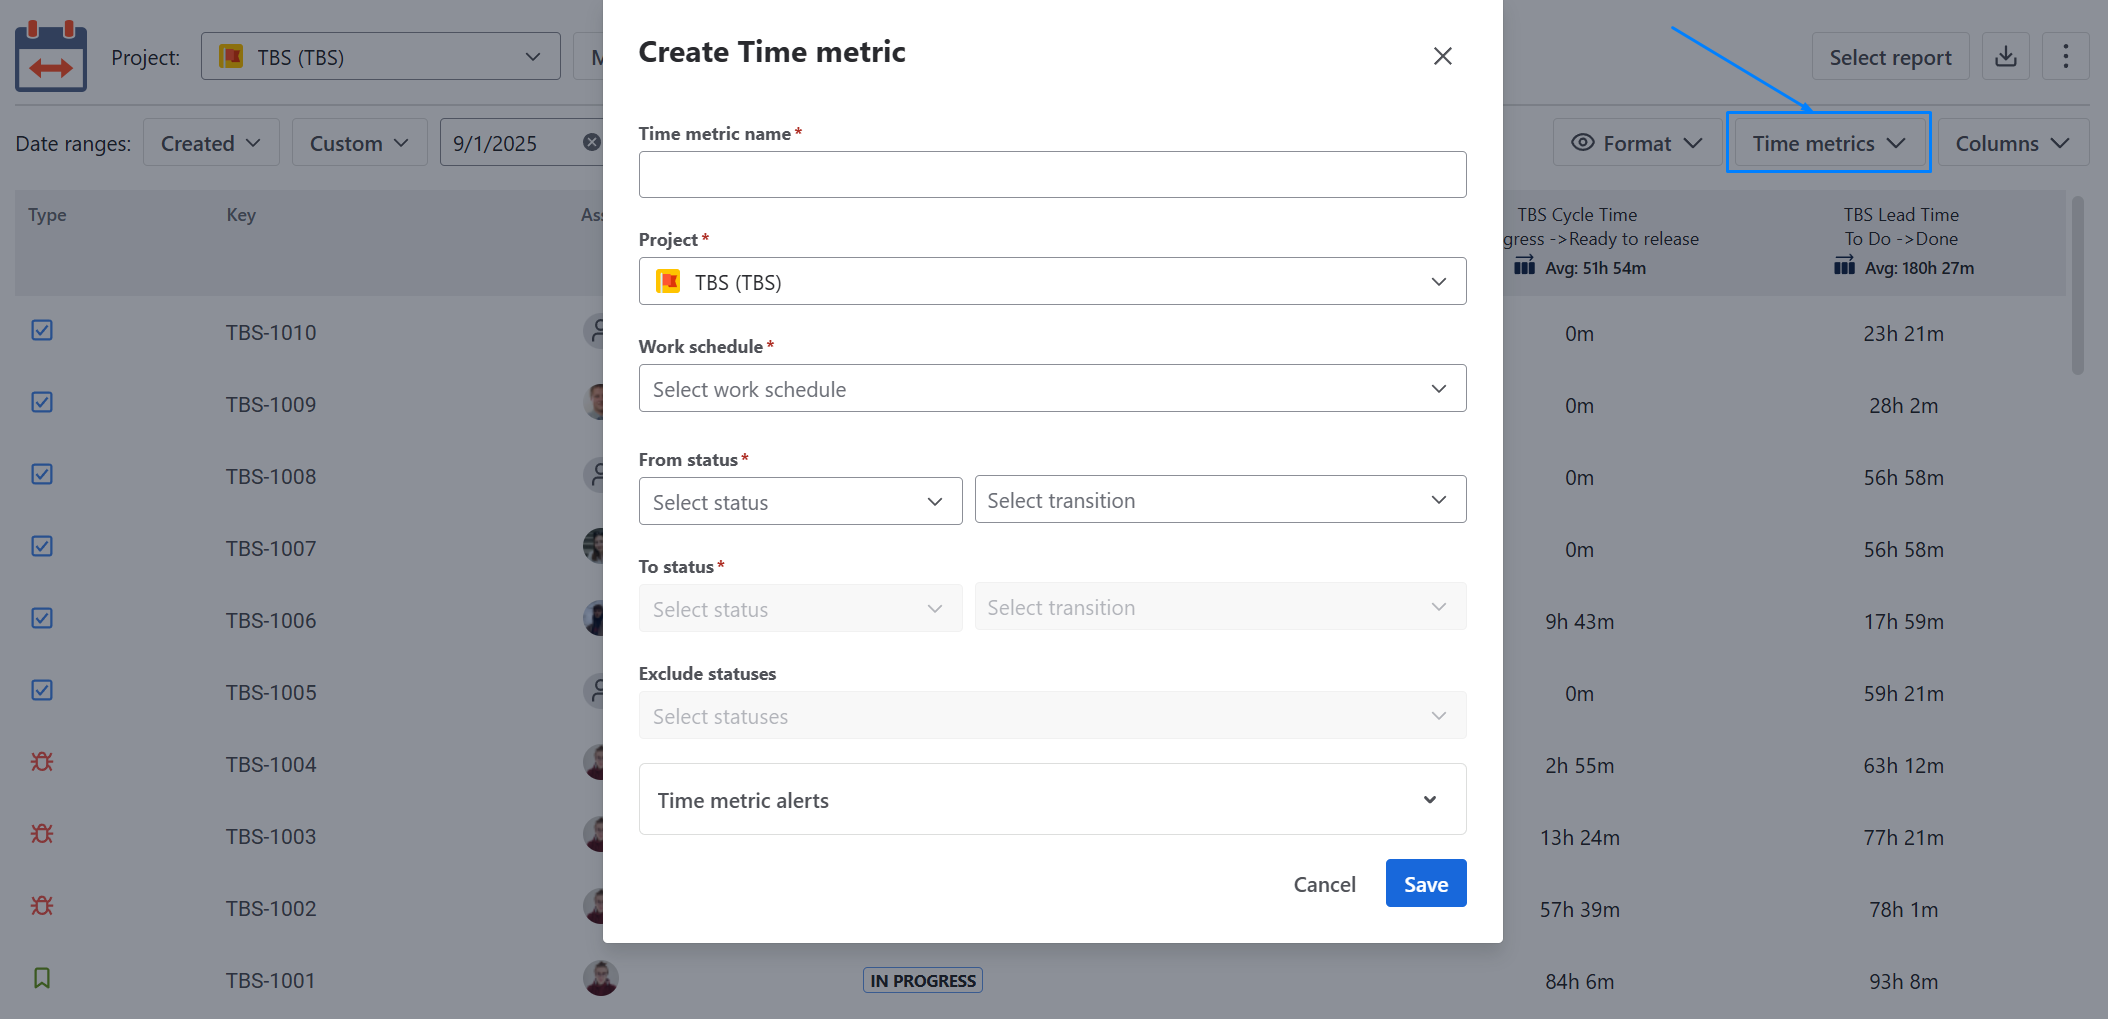
Click on the Time metric button in the upper right corner of the table to configure the conditions necessary to calculate a particular time metric.
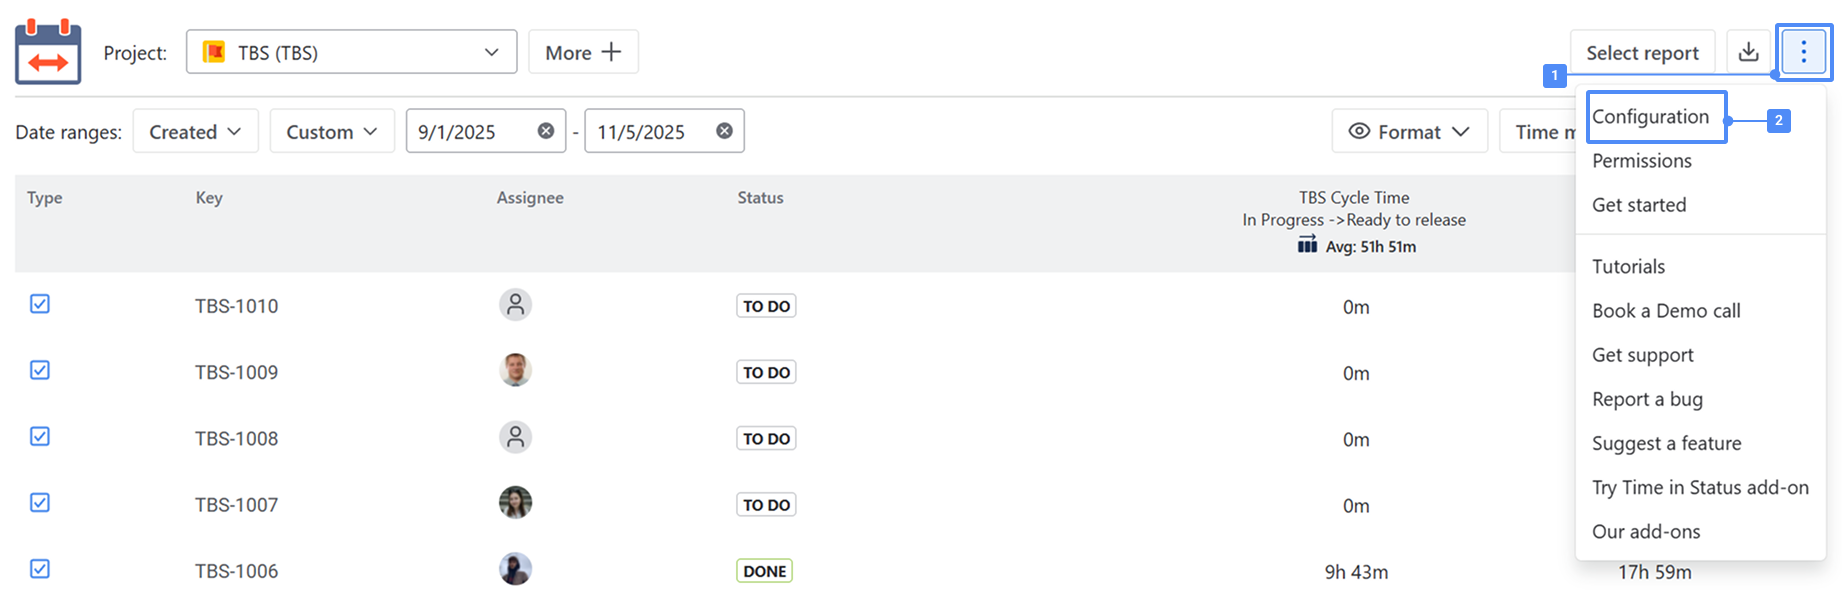
2 — The second way is to use the Configuration button. However, this method is more helpful for editing existing Time metrics.
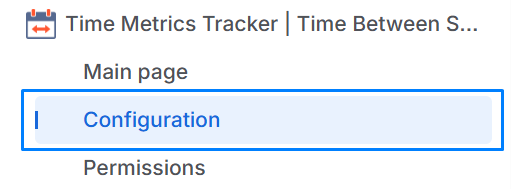
To add a new time metric, click Configuration — this button can be found in two places:
1️⃣ In the top-right corner of the report screen:
Click the three-dots menu (⋯) and choose Configuration from the dropdown list.
2️⃣ In the left sidebar, directly under the Time Metrics Tracker section of the app — the Configuration item is displayed in the navigation menu.
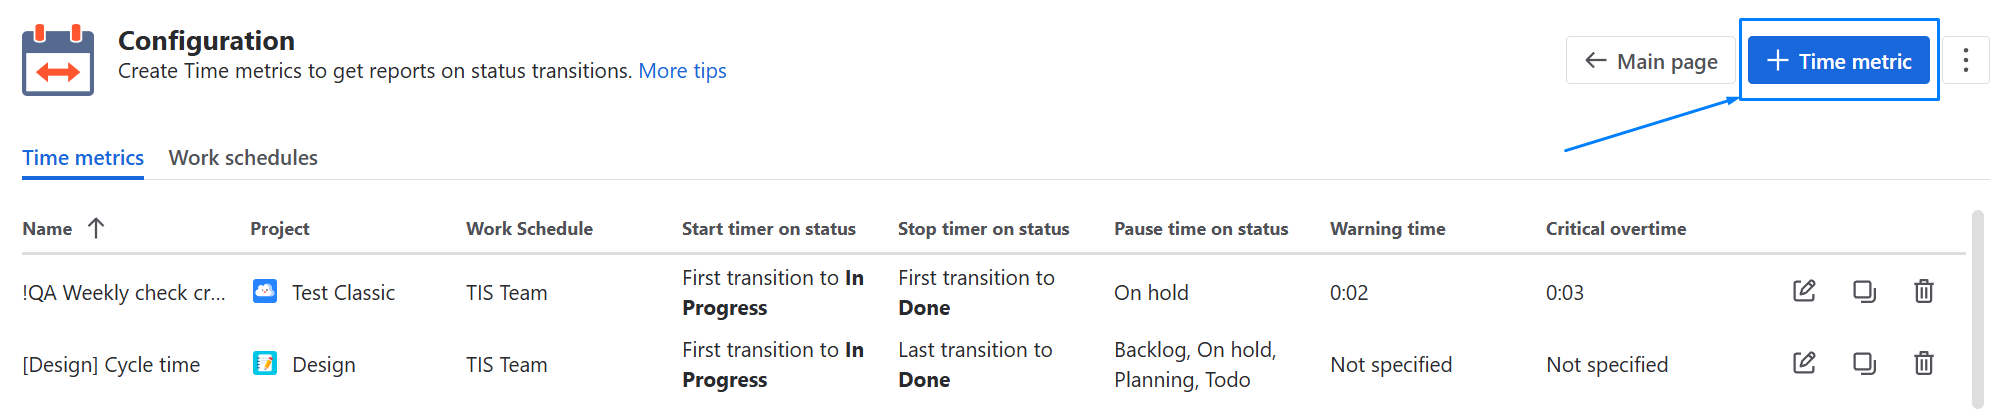
Click + Time metrics
Enter a Time metric name — a name for this metric, up to 60 characters (e.g. "Lead Time" or "Time in Review"). It's used as the column and filter label for this metric in the report.
Select the required project and set the work schedule according to which the time metrics will be calculated.
If you haven't set up a schedule yet, the app provides a Default work schedule (Mon–Fri, 09:00–17:00) so you can start right away. See Manage Work Schedule to customize it.
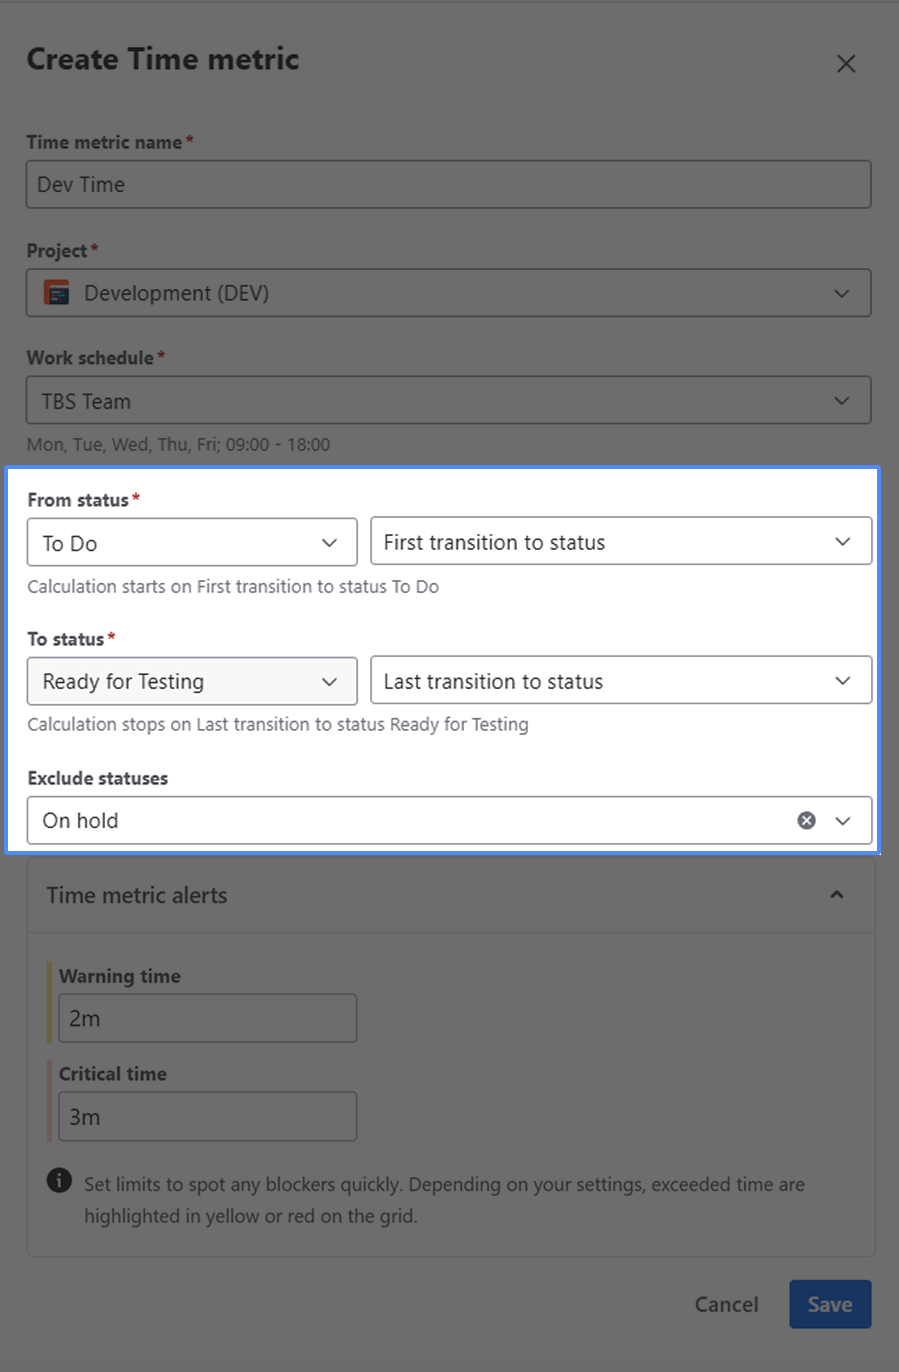
Next, define when the calculation should start and stop by selecting the required transitions to/from a status.
For both the From status and To status, you can choose which transition should be used for the calculation. This is important because an issue can change status multiple times without being resolved.
Understanding transition types
|
Transition type |
Meaning |
|---|---|
|
First transition to status |
The first time the issue entered this status. |
|
Last transition to status |
The most recent time the issue entered this status. |
|
First transition from status |
The first time the issue left this status. |
|
Last transition from status |
The most recent time the issue left this status. |
For example:
-
Lead time: From = First transition to
To Do, To = Last transition toDone. This measures the time from when the issue was first added to the queue until it was most recently marked as done. -
Cycle time: From = First transition to
In Progress, To = First transition toDone. This measures the time from the start of active work until the issue was first completed, ignoring later reopens.
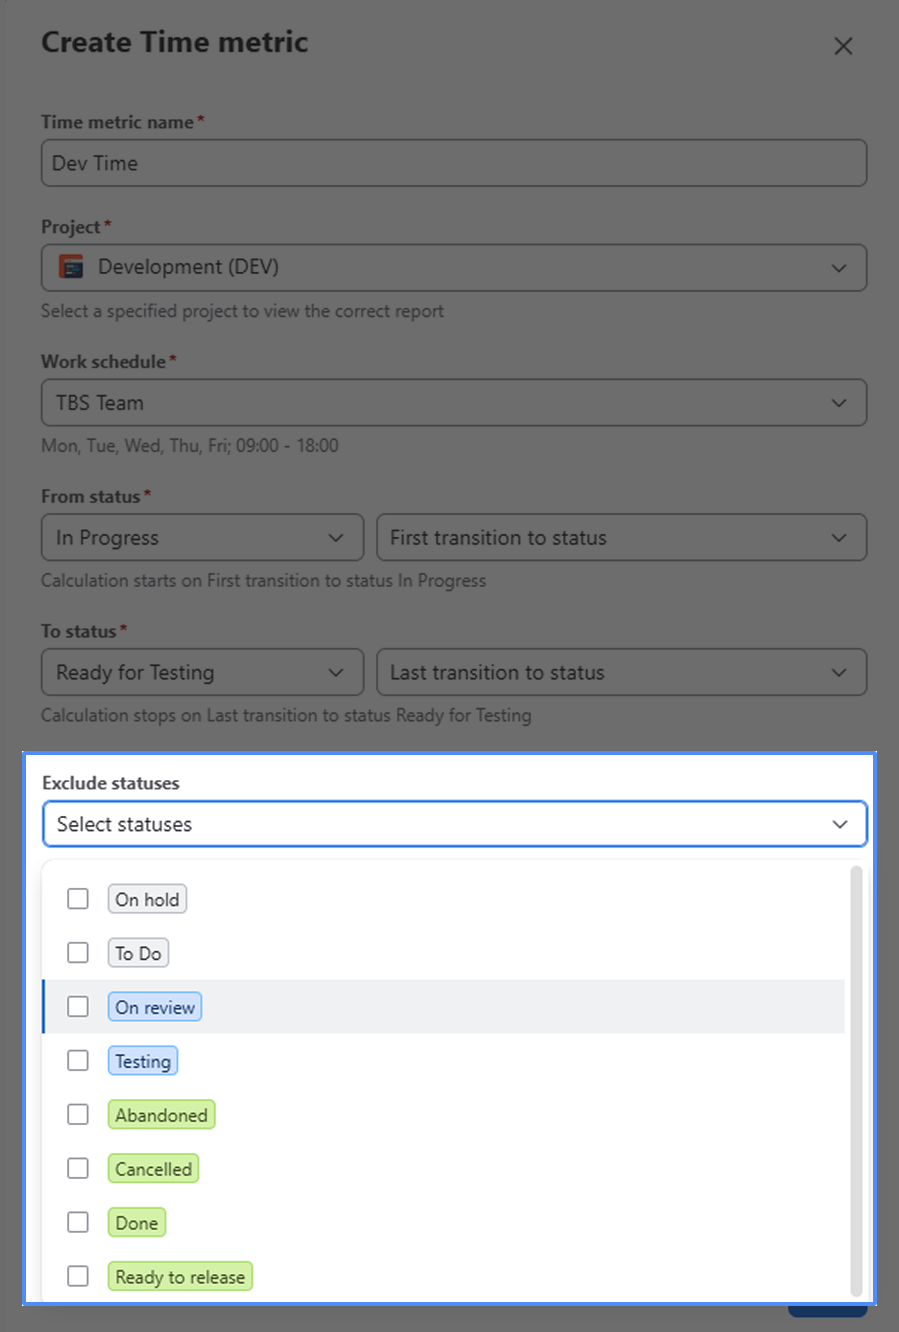
You can also choose one or more statuses on which the calculation should pause. The time spent in the selected pause status is excluded from the calculated metric.
Using the same status for From and To
You can select the same status for both From and To when you need to measure the time between two occurrences of that status.
For example, an issue may move to In Progress, leave it, and then return to In Progress later. By selecting the appropriate transition types, you can measure the time between these two entries.
The selected transition types determine which occurrence of the status starts and ends the calculation. The form automatically shows only transition combinations that can be used for the selected statuses.
Time metric alerts
After you customize your calculation preferences, set the Warning and Critical time limits
-
Warning time — the time after which an issue is marked with a warning. For example,
1h 30m. -
Critical time — the time after which an issue is marked as critical. For example,
4h 30m.
Use combinations of hours and minutes, such as 4h 15m, 2h, or 30m. Leave a field blank if you do not want to set that threshold.
.png?cb=0598bbb4666edaacb6786ade3f8dcb41)
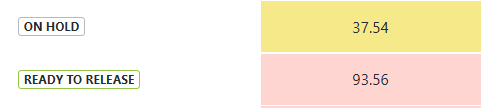
When an issue exceeds a configured threshold, it is highlighted in the report grid:
-
Yellow — the issue exceeds the Warning time.
-
Red — the issue exceeds the Critical time.
If both fields are left blank, the time metric works normally without any alerts.
Note: Time metric alerts currently provide visual highlighting only. They do not send notifications or affect the time calculation.
Managing Time metrics
To manage Time metrics, click Configuration
Each metric in the list has three actions:
-
Edit (pencil icon) — reopens the form pre-filled with the metric's current settings so you can adjust them.
-
Copy — duplicates the metric. The copy is named "‹original name› - Copy", so you can quickly create a variant for a different status range.
-
Delete (trash icon) — asks for confirmation before removing the metric. Once deleted, a metric can't be restored.

Displaying Time metrics on the report
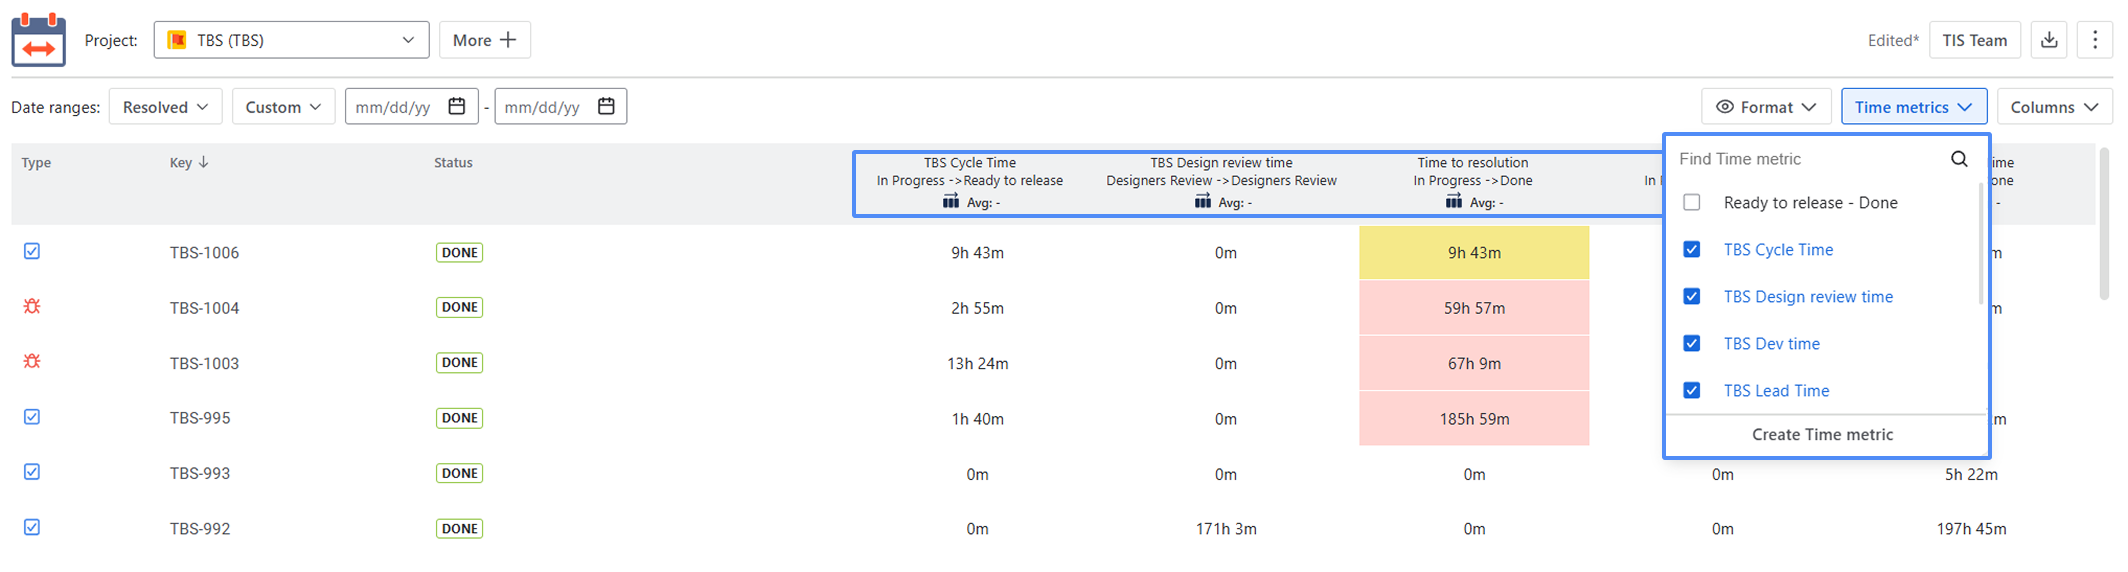
To select the time metric to display on the report, click Time metric and select the checkboxes for all the KPI’s you want to display.
If you need help or want to ask questions, please contact us through SaaSJet Support or via email support@saasjet.atlassian.net
Haven't used this app yet? Try it now!