
The Average time report shows the average time work items have been staying in statuses during a specific period.
-
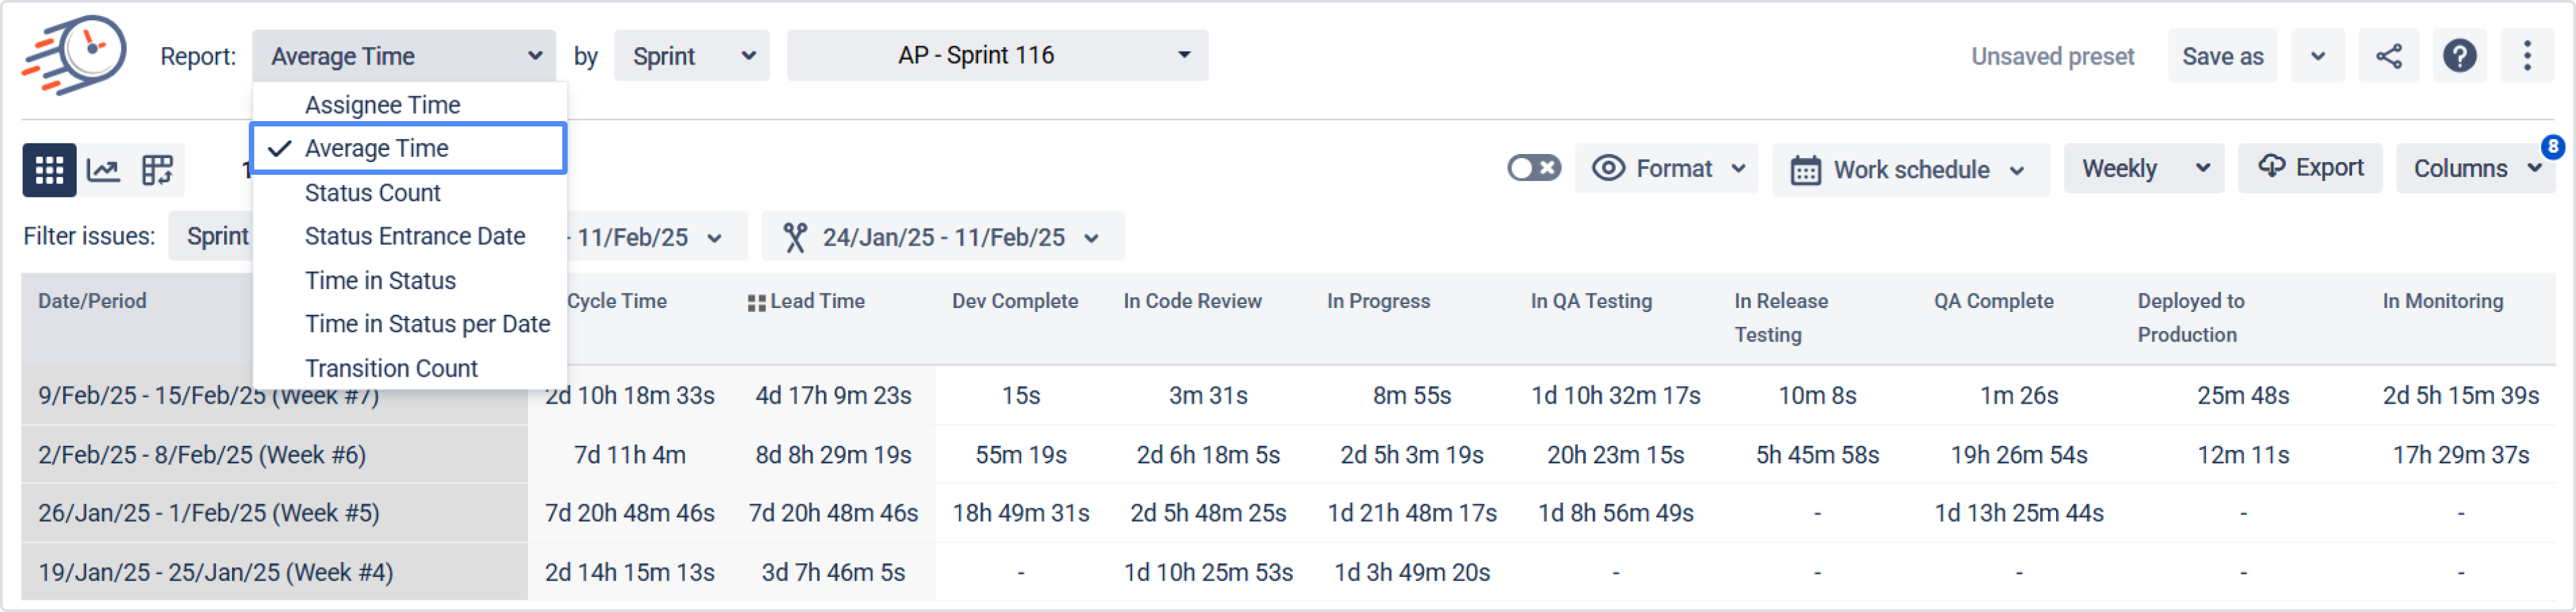
Choose the Average time report;
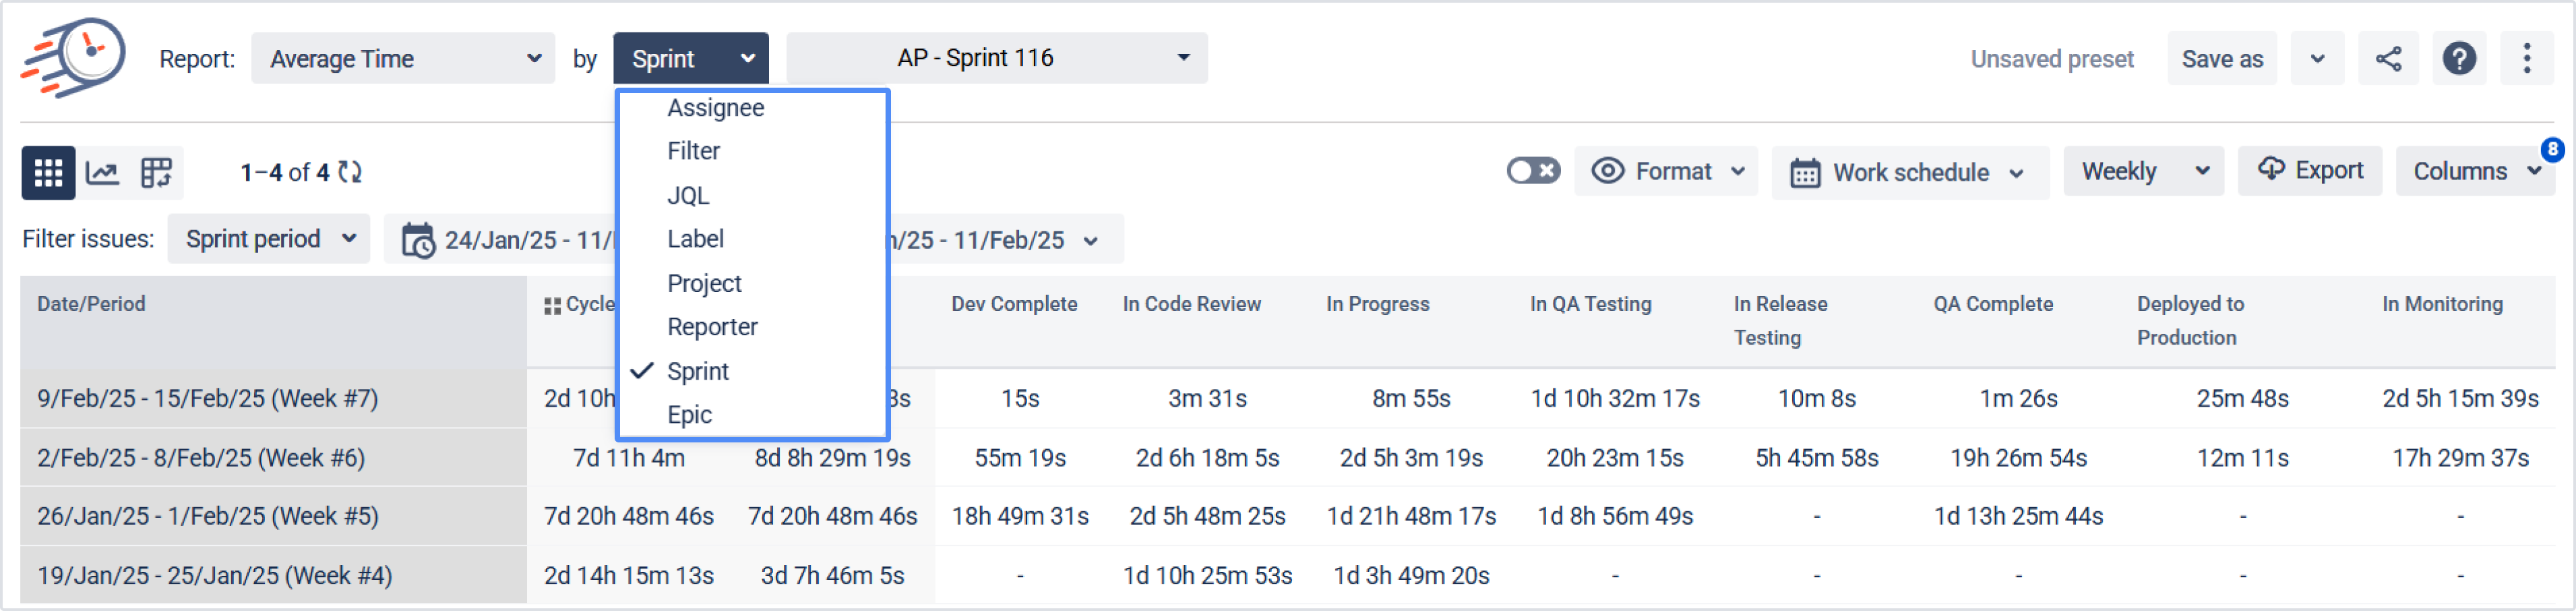
2. Filter by the category you need;
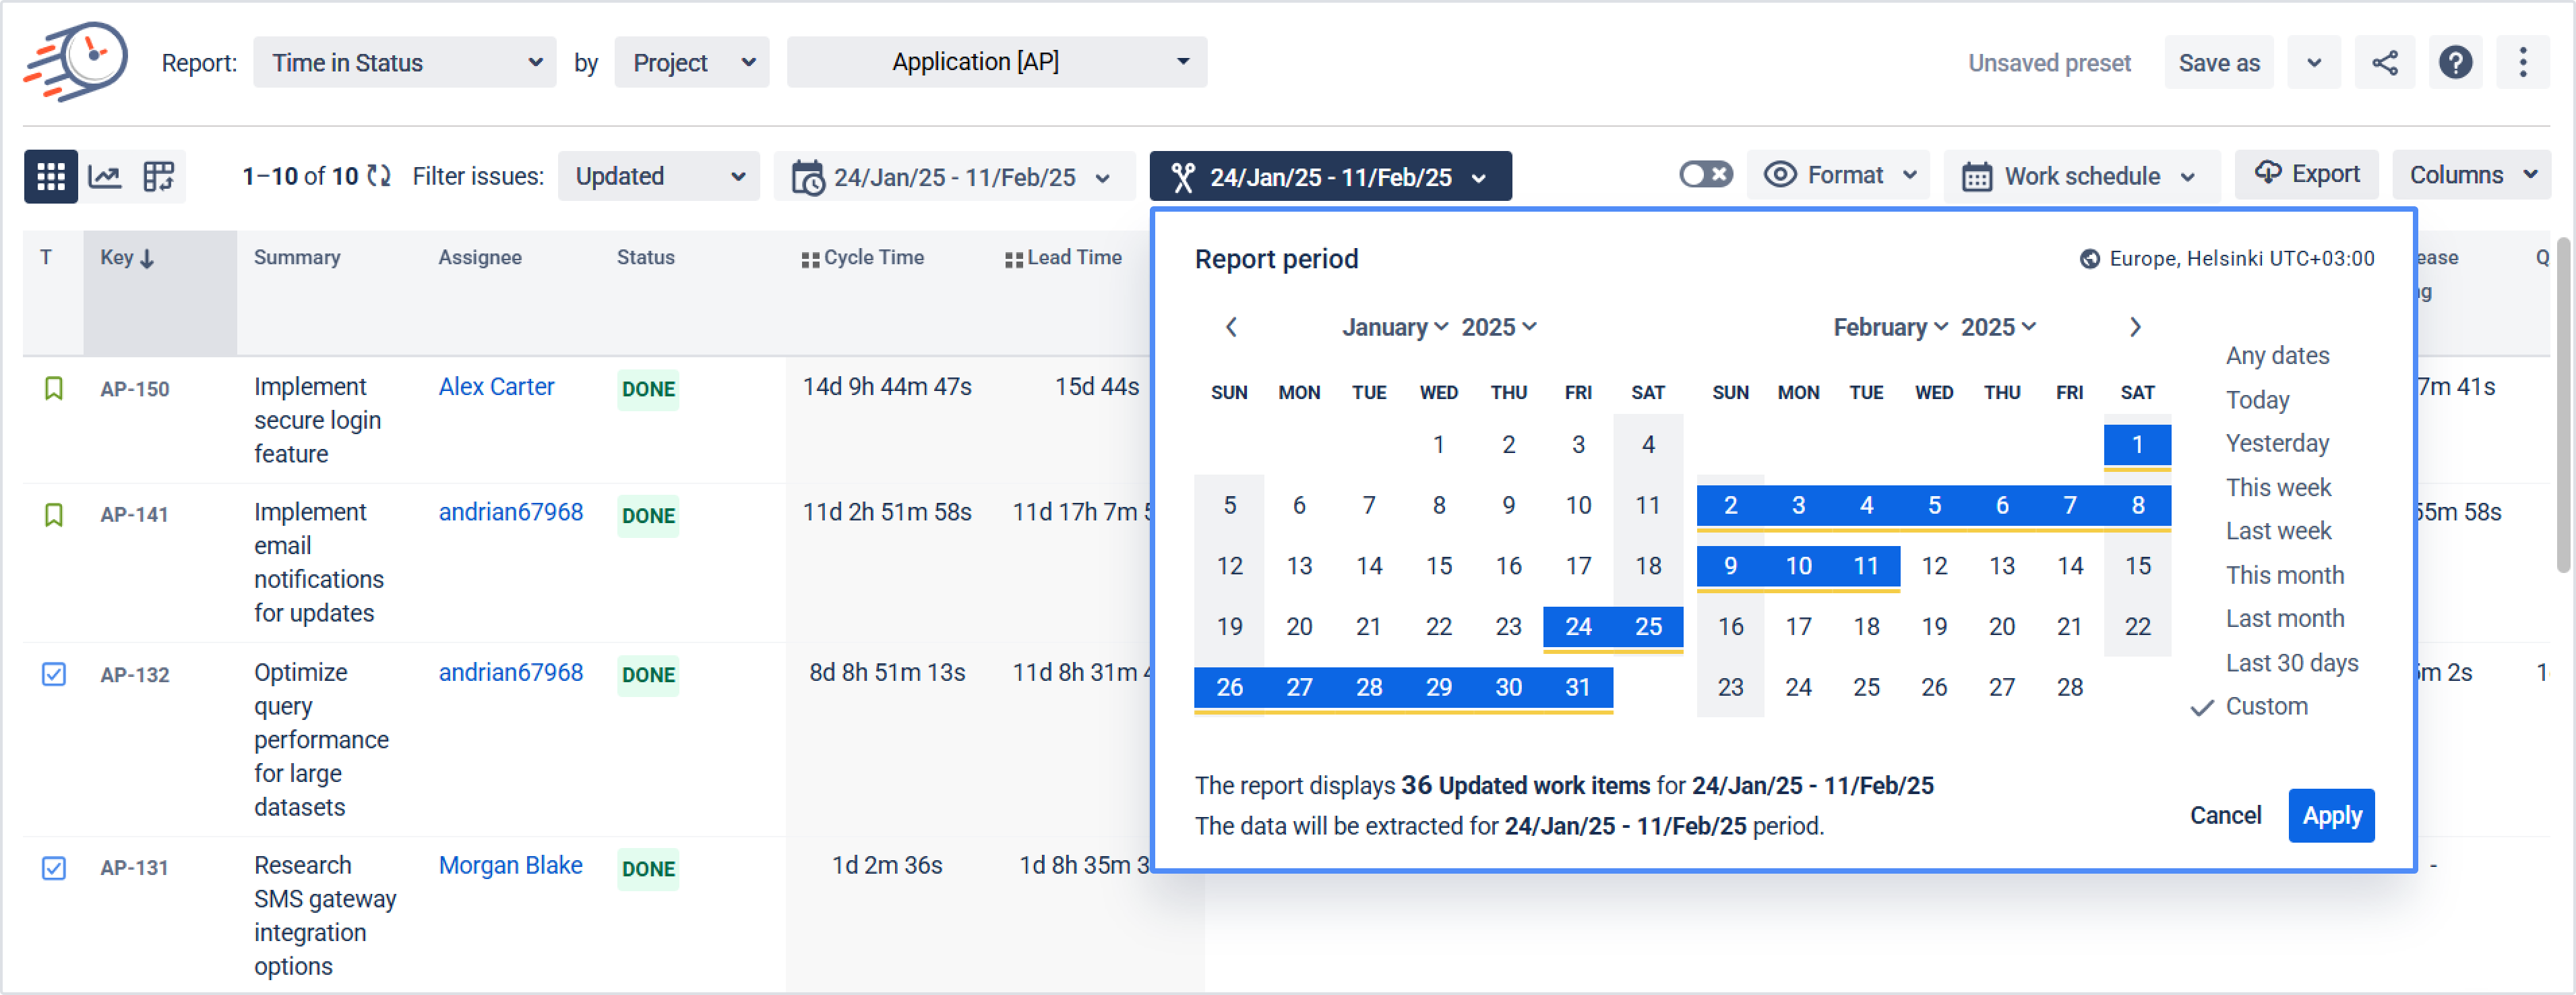
3. Choose the report period for the data calculation;
-
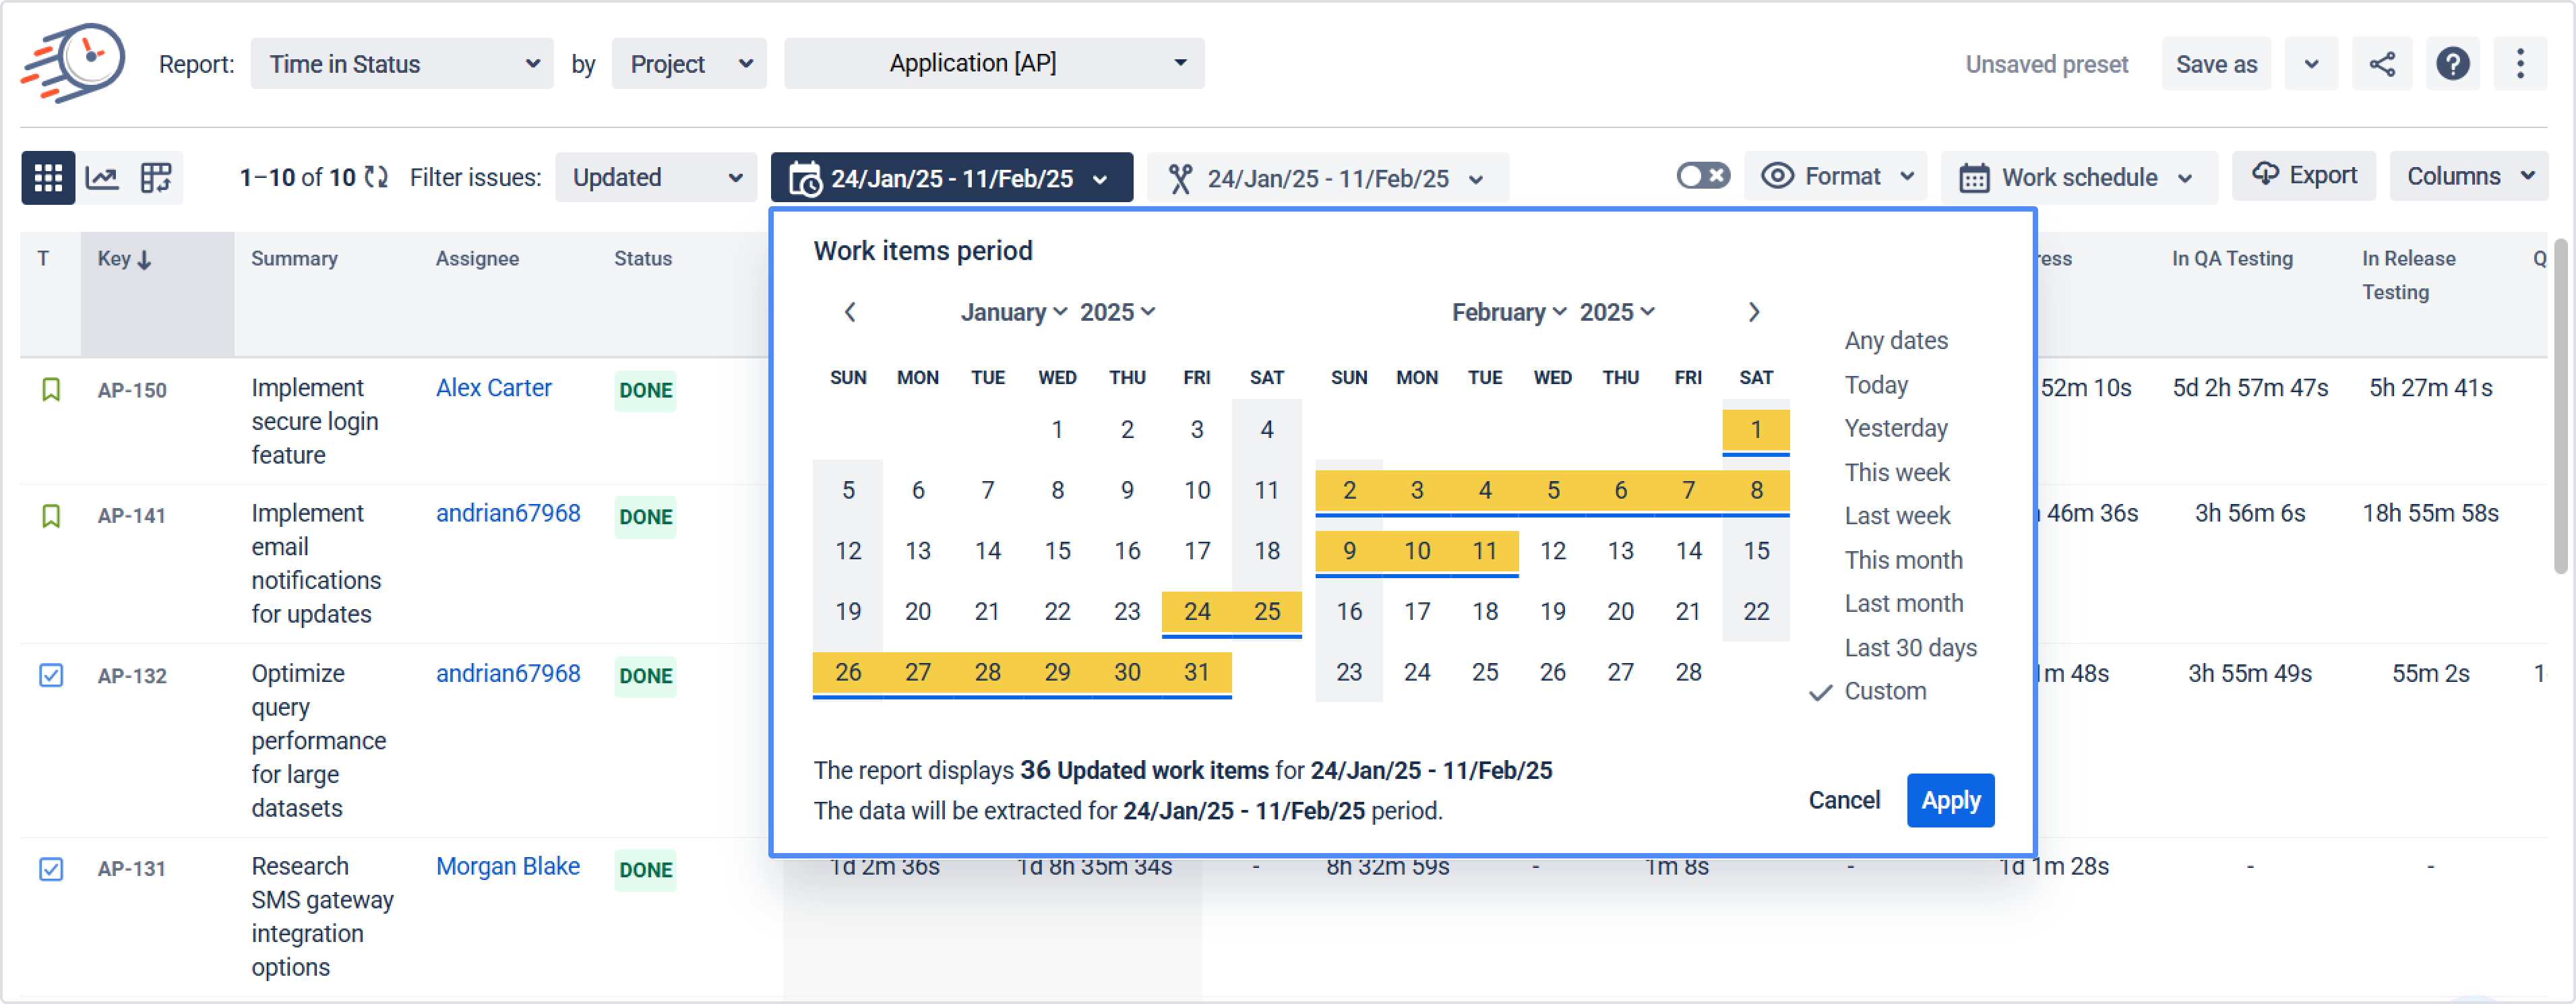
Choose the work item period for the data calculation;
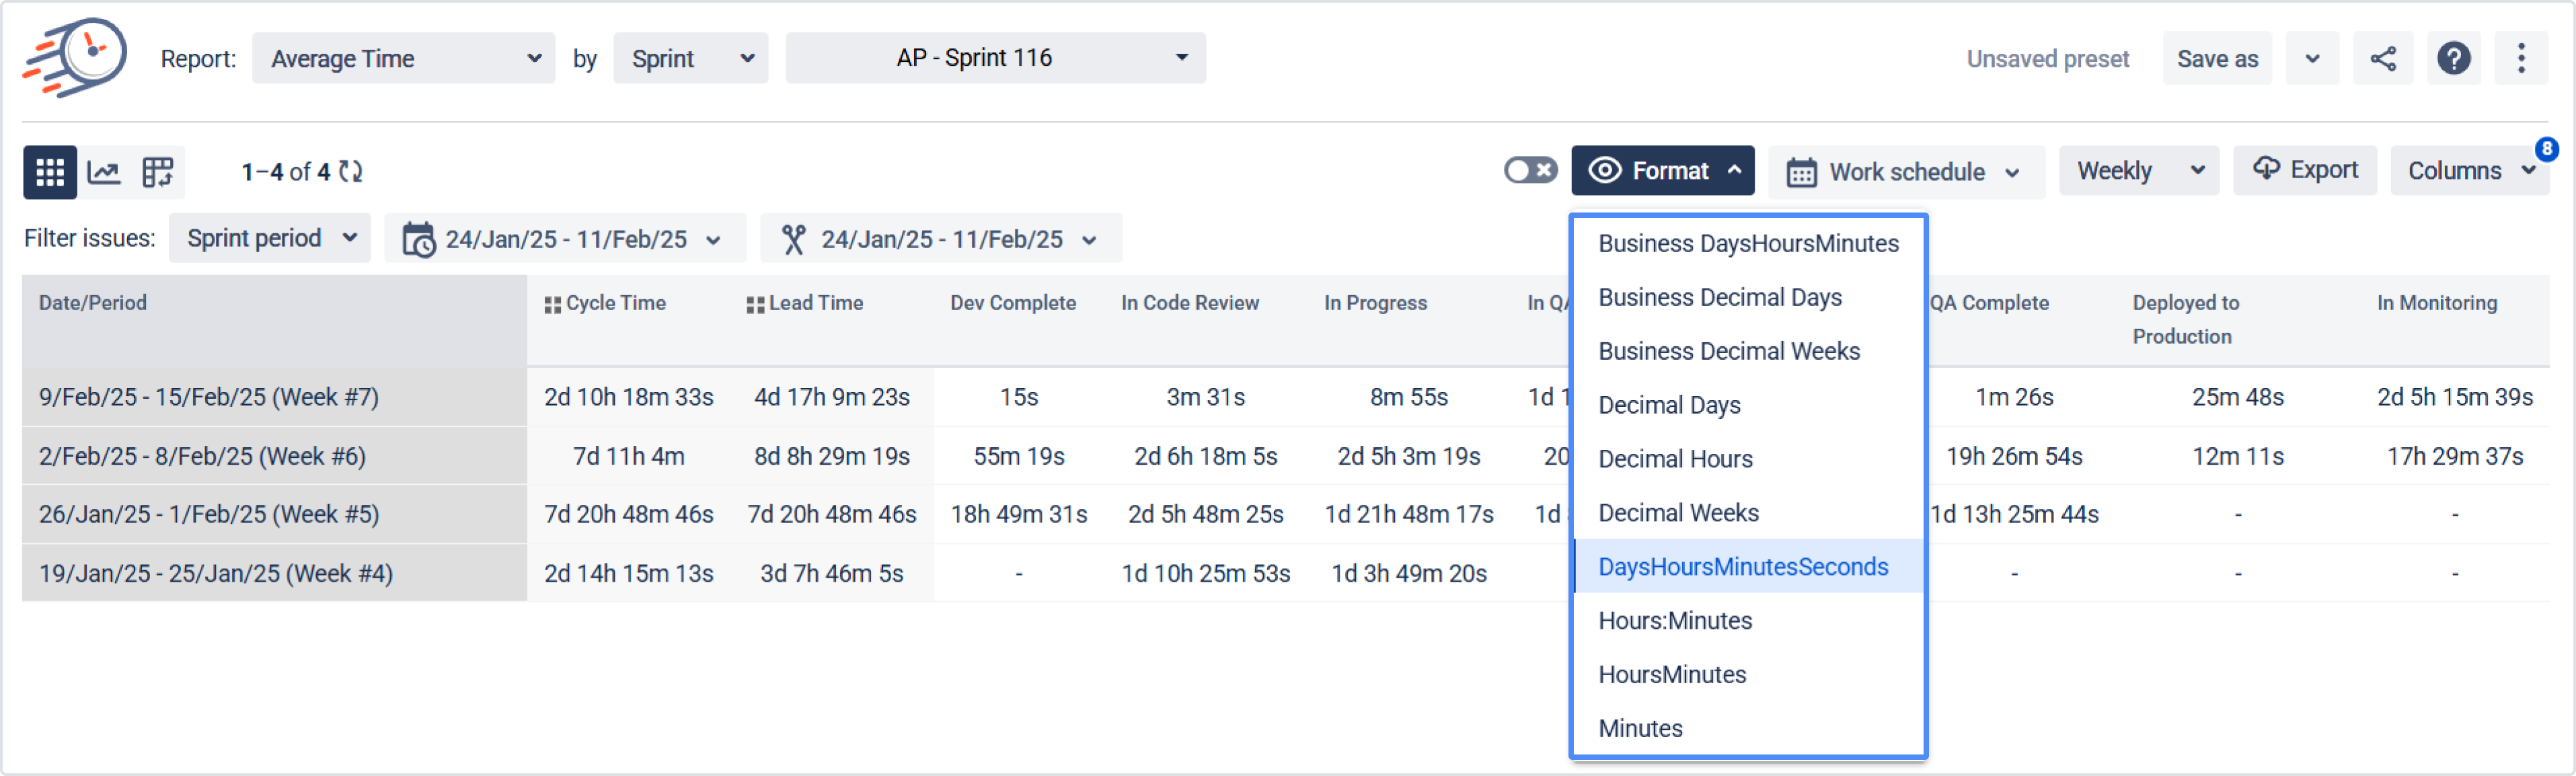
5. Select a time format type that will be represented on the grid;
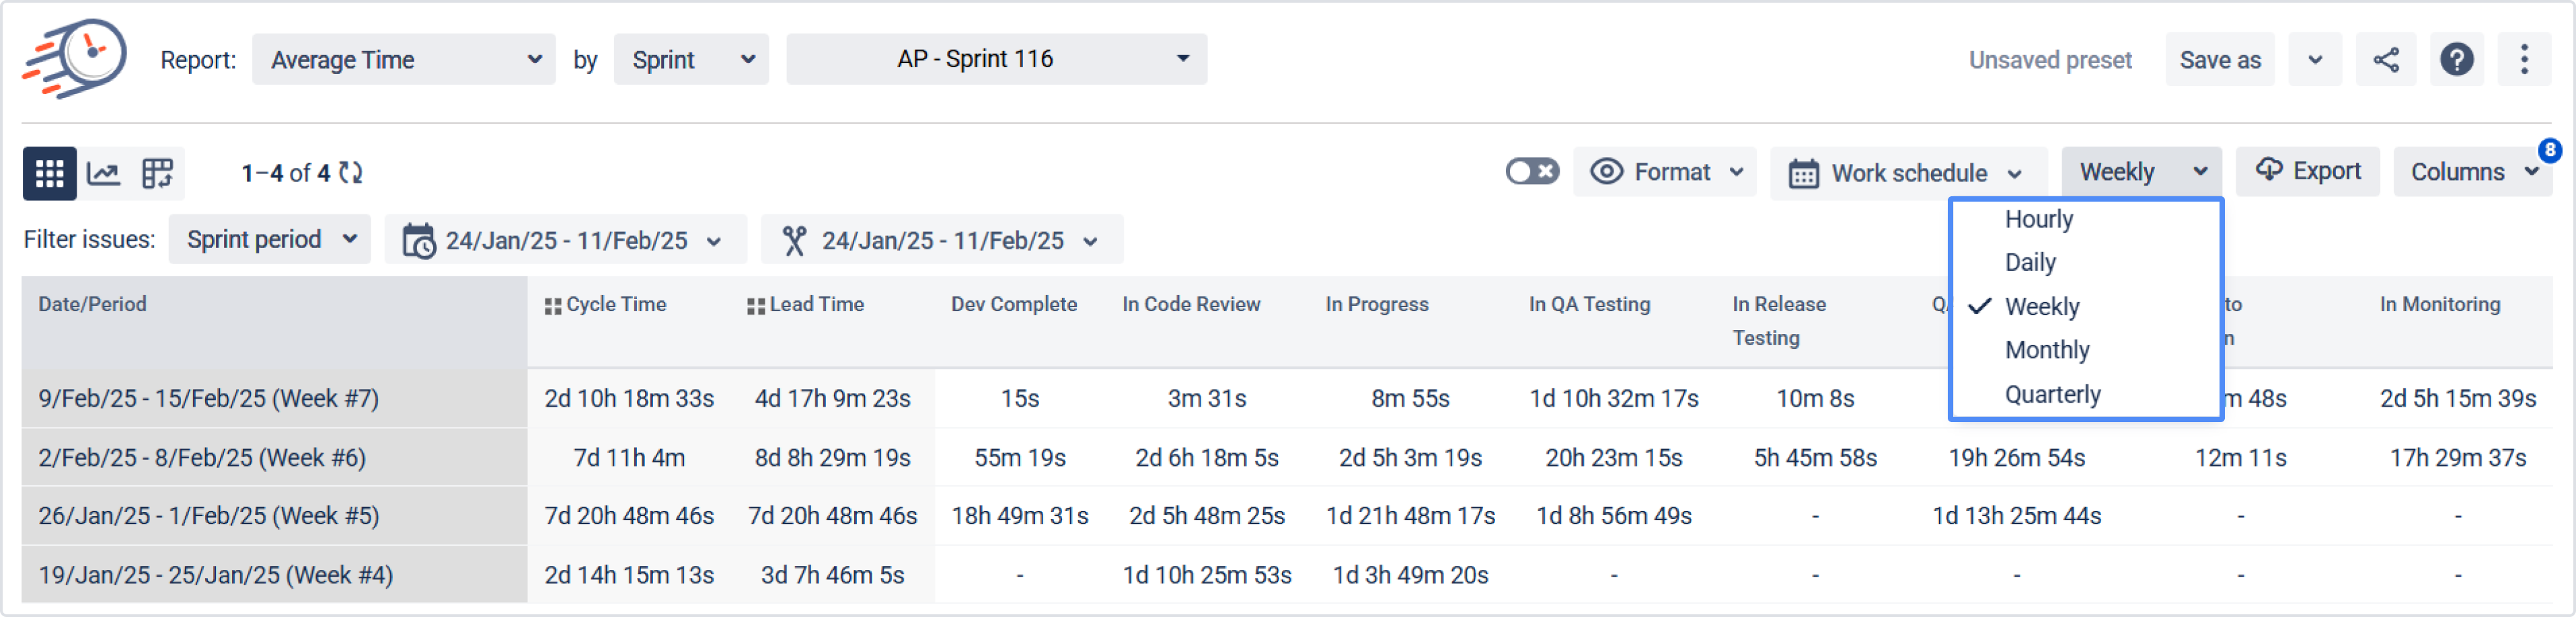
6. Select the time interval for which the average values will be calculated.
-
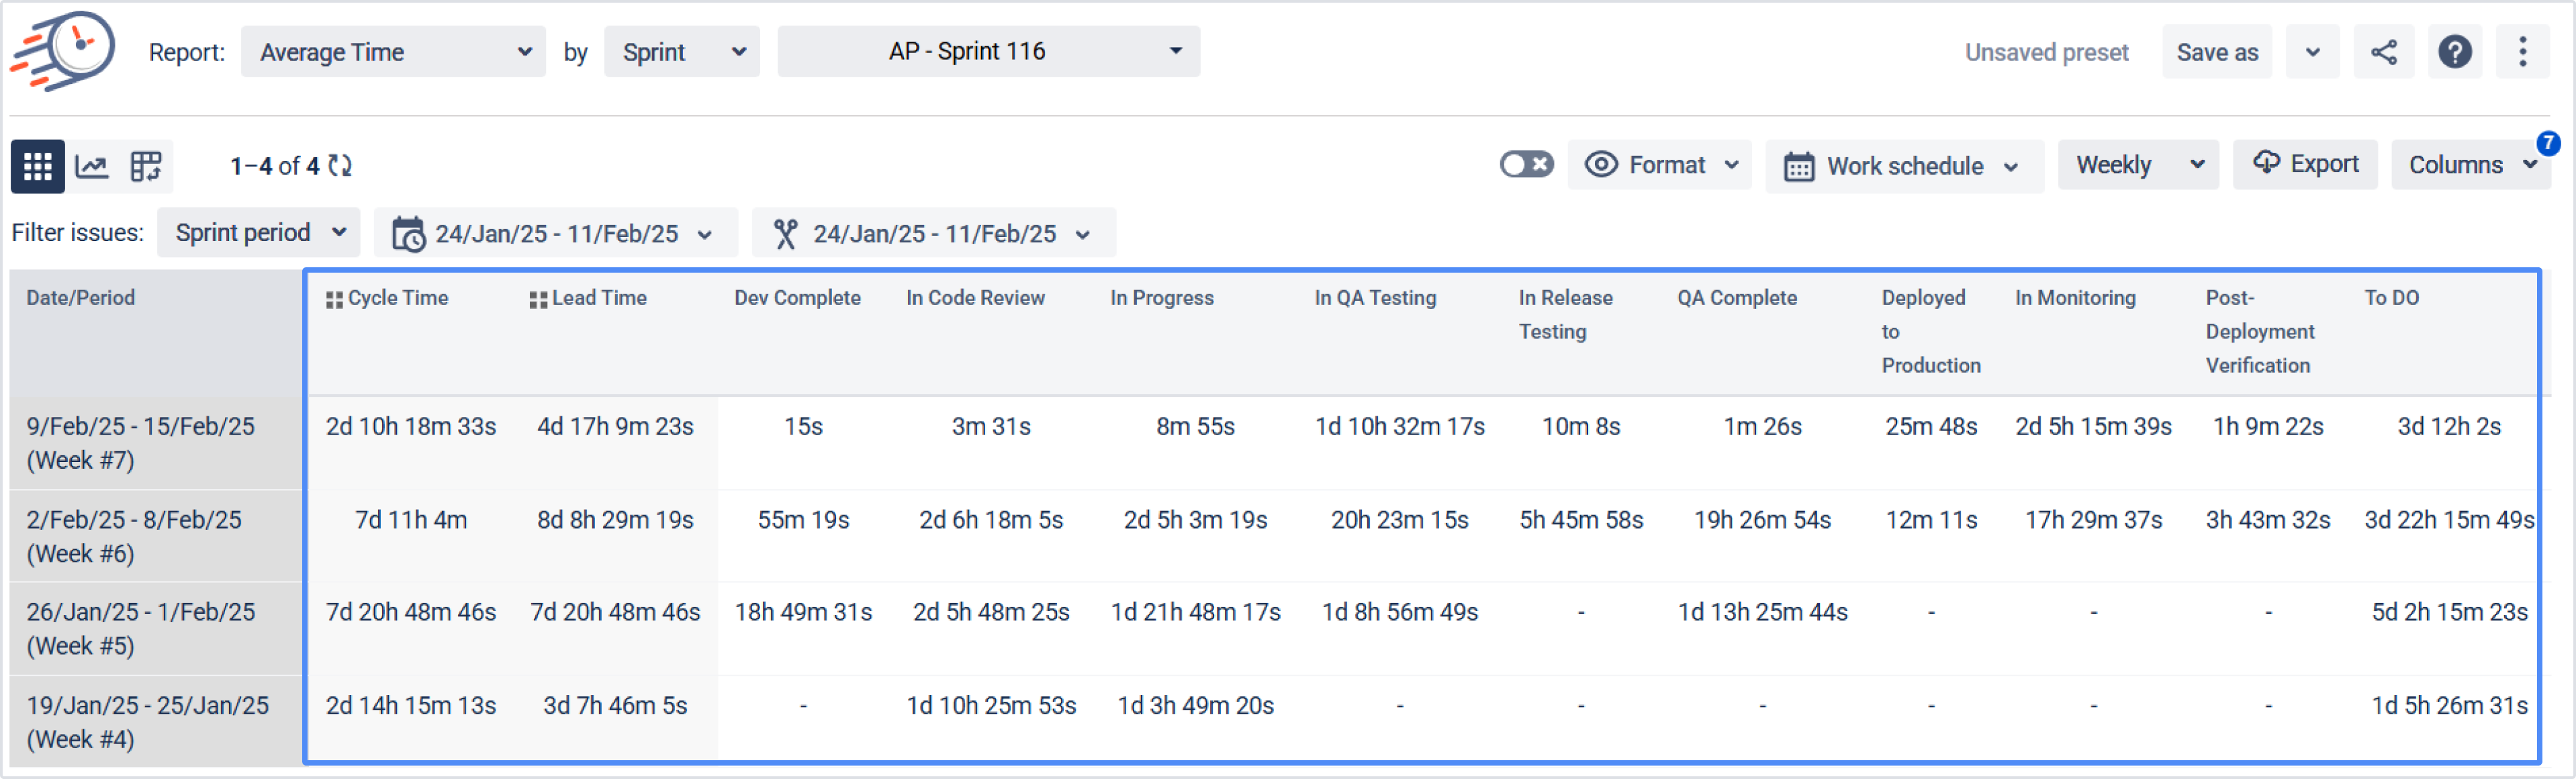
Get all the Average time data on the grid as it’s shown below.
How does the calculation of the Average time occur?
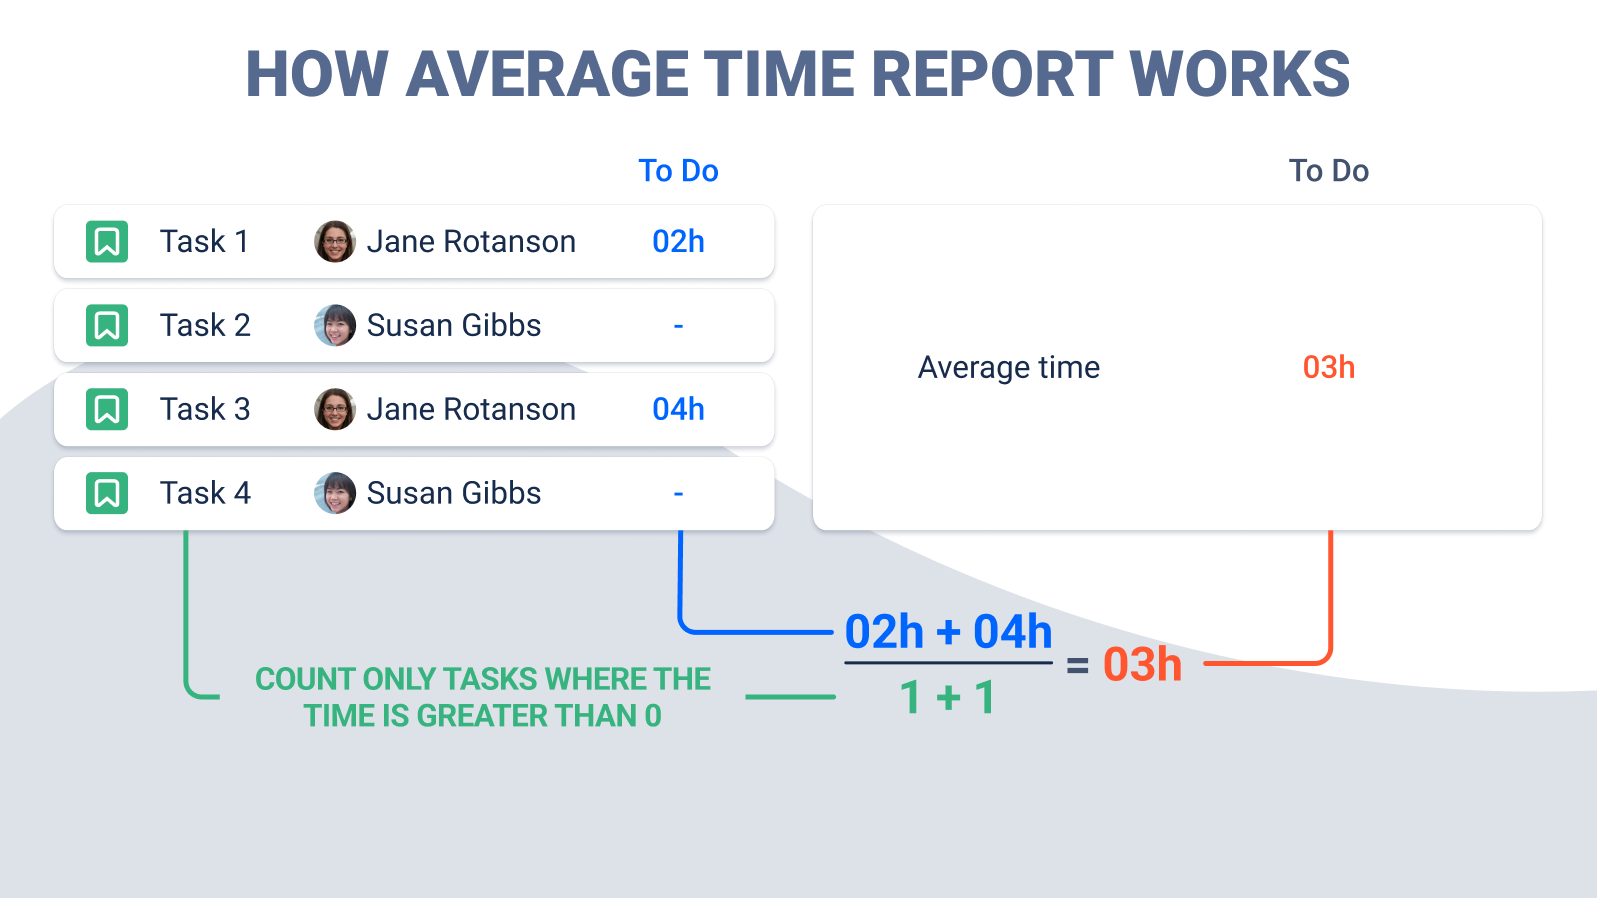
The picture shows the logic of calculating the Average time.
-
We count the number of tasks that have been in a particular status (To-Do status in this case) (green line),
-
Then, sum up the time spent on these tasks (blue line). We take into account only those tasks that have been in the status.
-
Divide the total time by the number of tasks. (1/2)
This is how the calculation of each value on the grid is occurring.
Here’s an explanation of how to get the Average time report for each assignee.
How the data in the reports is calculated: Detailed explanation
If you need help or want to ask questions, please contact SaaSJet Support or email us at support@saasjet.atlassian.net
Haven’t worked with the add-on yet? Give it a try