
Time in Status Integration allows you to track the time spent on a task directly on the table or chart view.
Just a friendly reminder: to retrieve the time in state data, please reload the page after adding the Time in State Integration to your board.
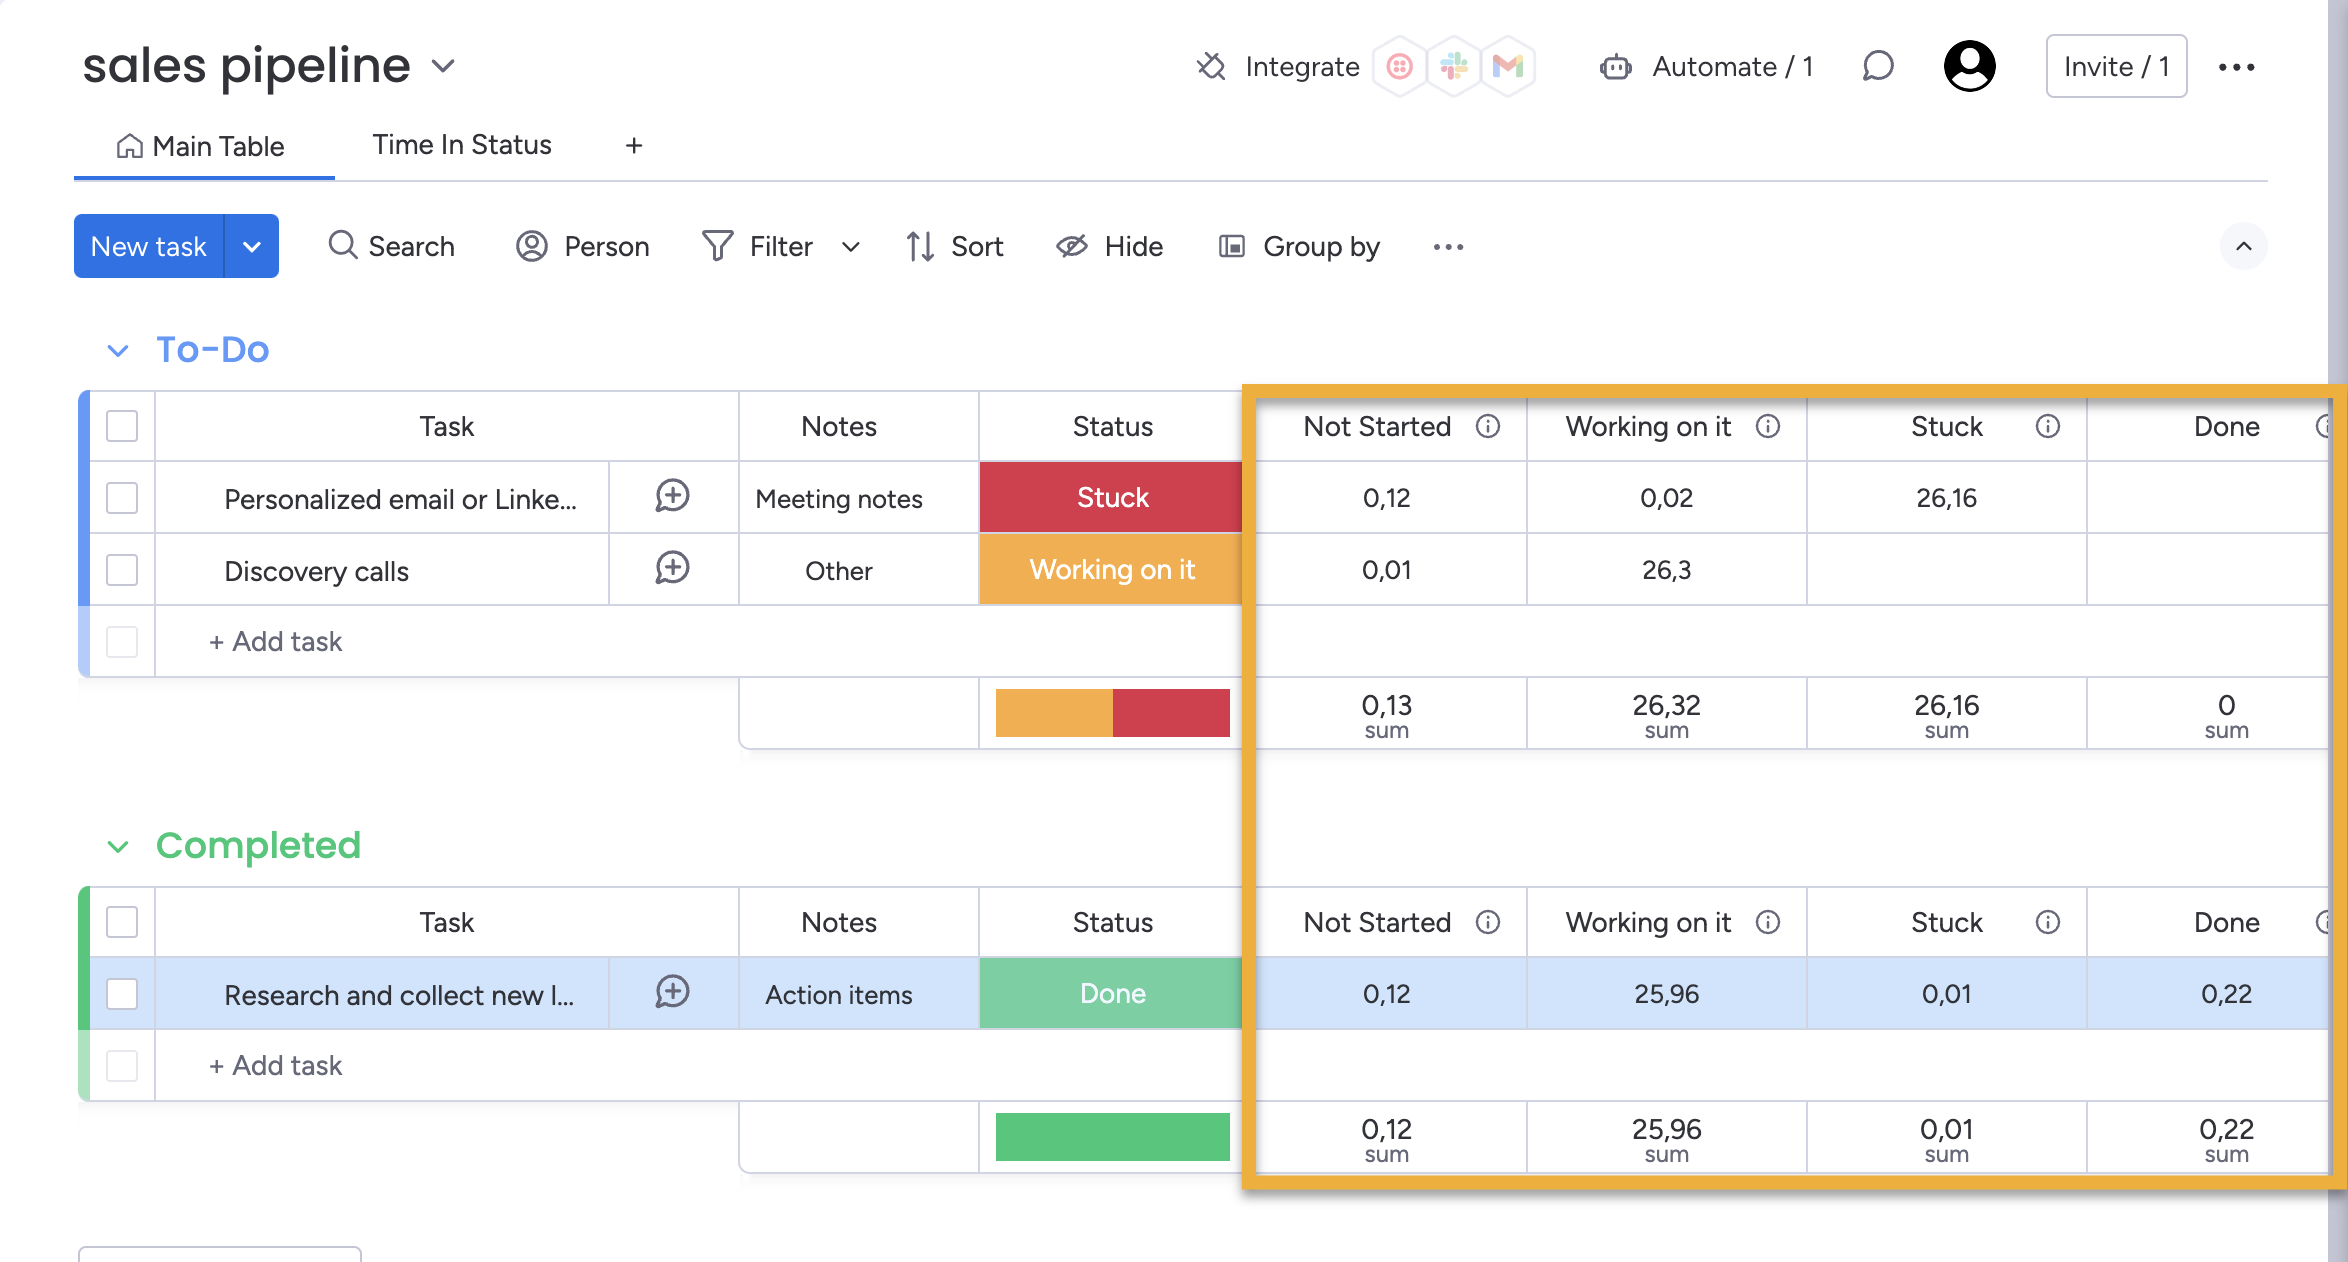
Time Reporting Table View
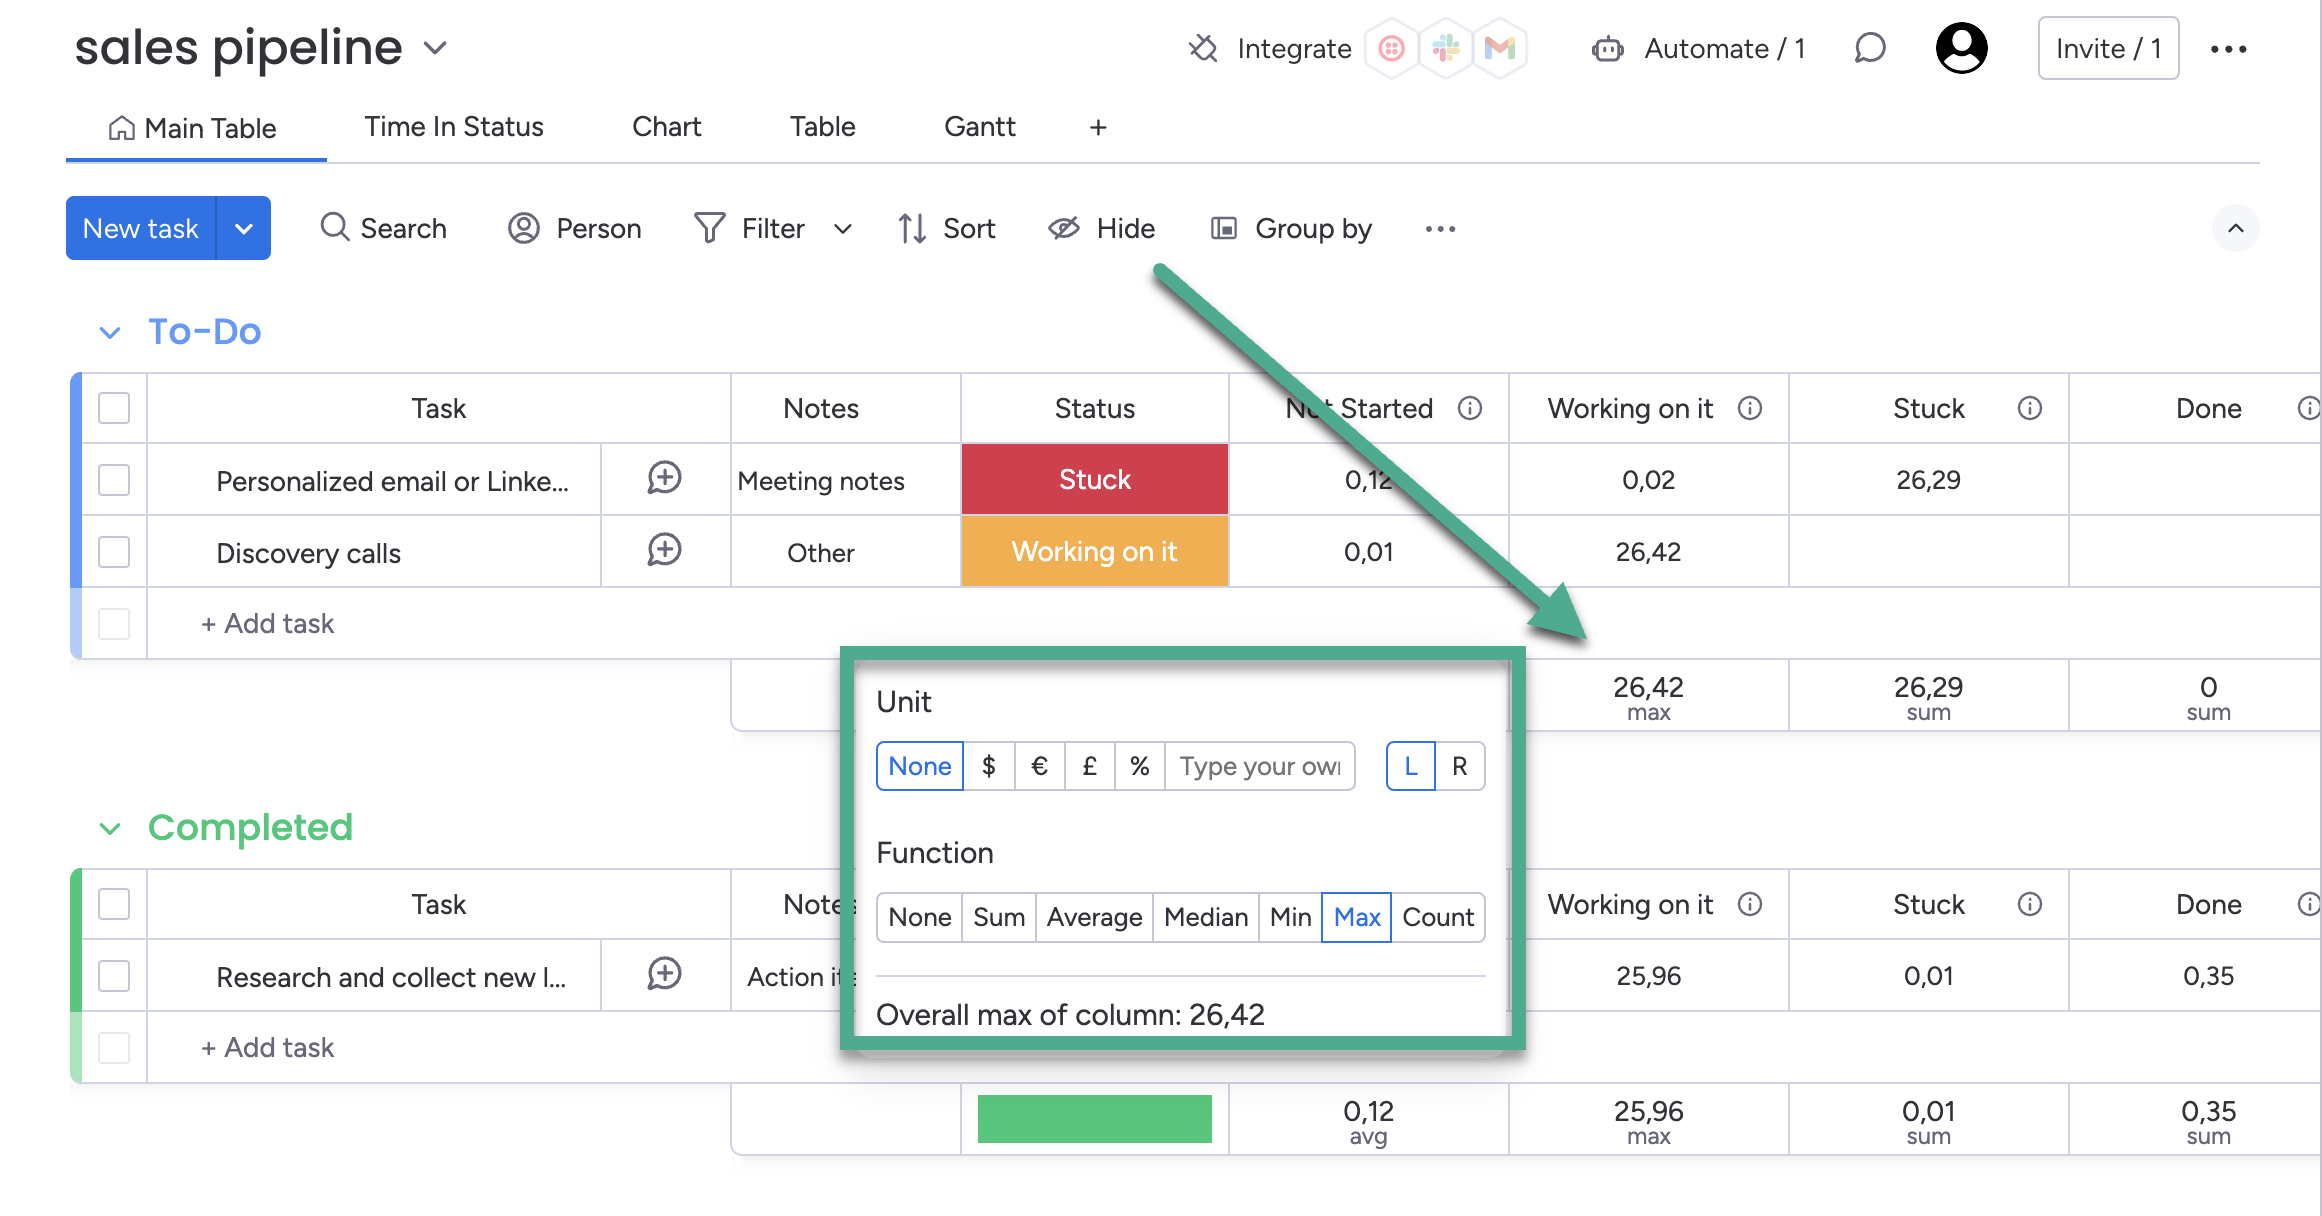
After installing the Time in Status app, you will see columns that display the time spent in each status for every task. You will also be able to get the sum, average, median, minimum, and maximum time spent in each status, or the number of tasks that have been in each status.
To do this, just simply:
-
Click to the item below all tasks in the group
-
Choose your preferred function to get data.
Use case:
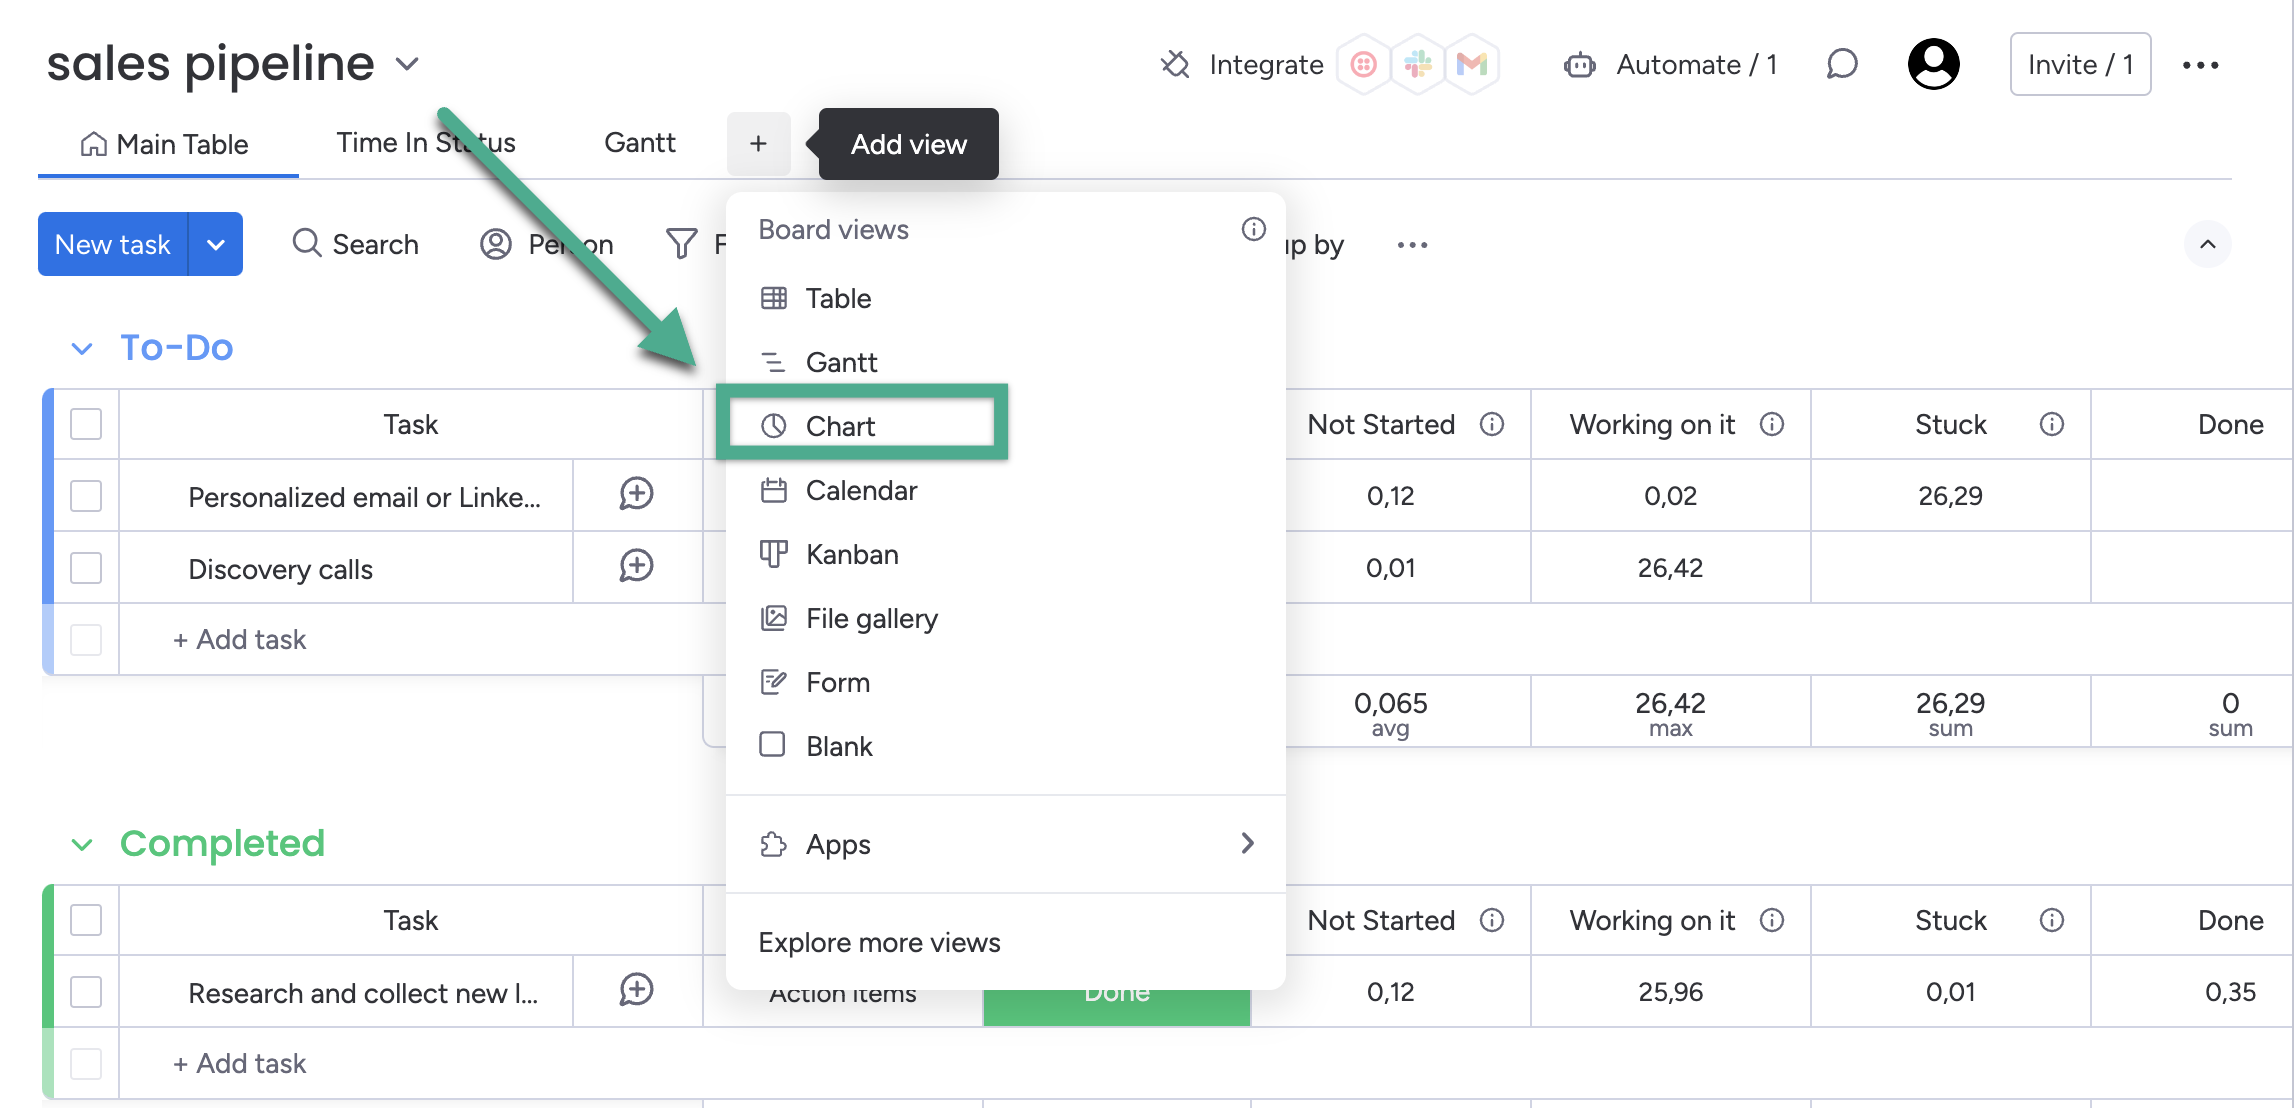
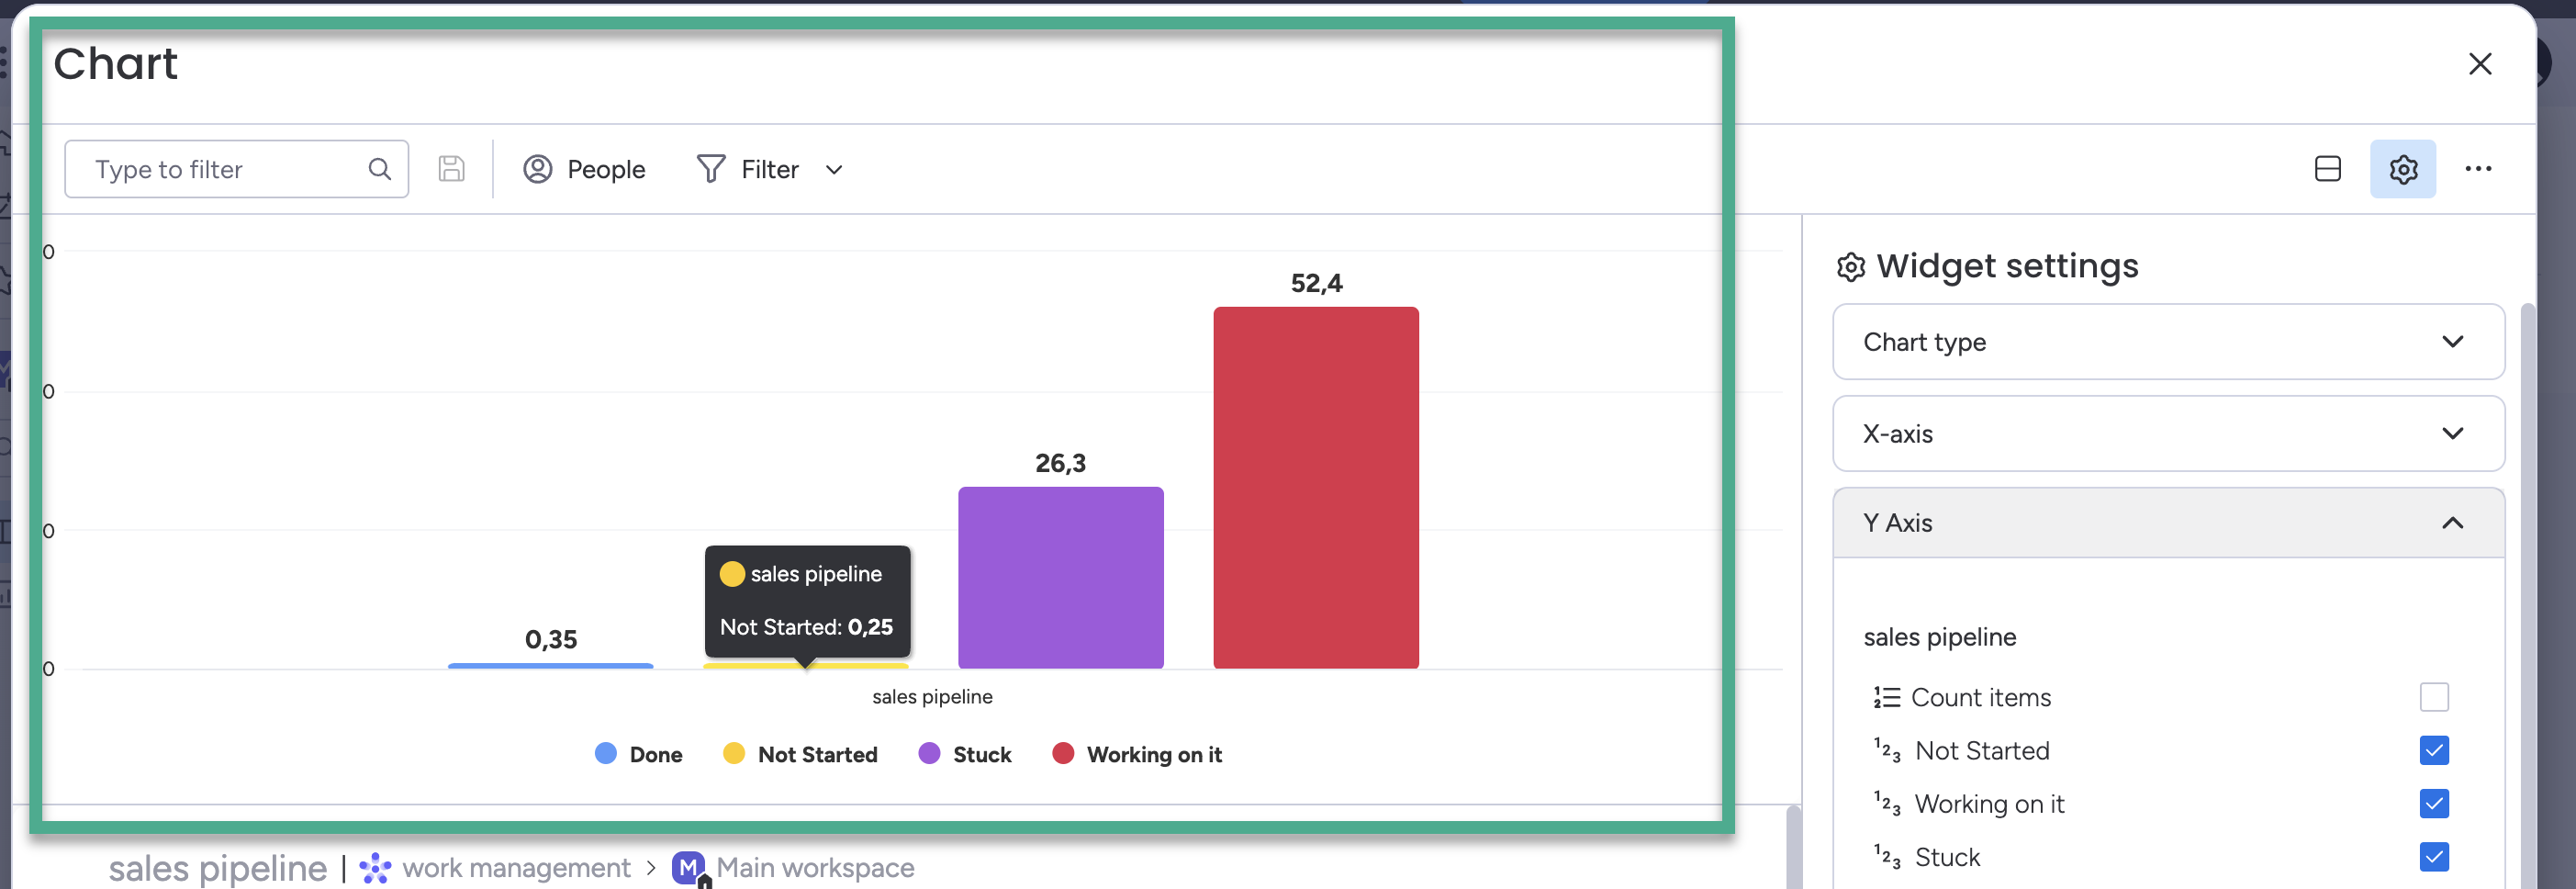
Time Reporting Chart View
Also you can use Charts for create reports such as Status Count, Time in Status by Person, Time in Status for Board etc.
To get Time in Status on charts, simply:
-
Add view (click on +)
-
Choose Chart
Thank click to the settings of widget to configure preferred report.
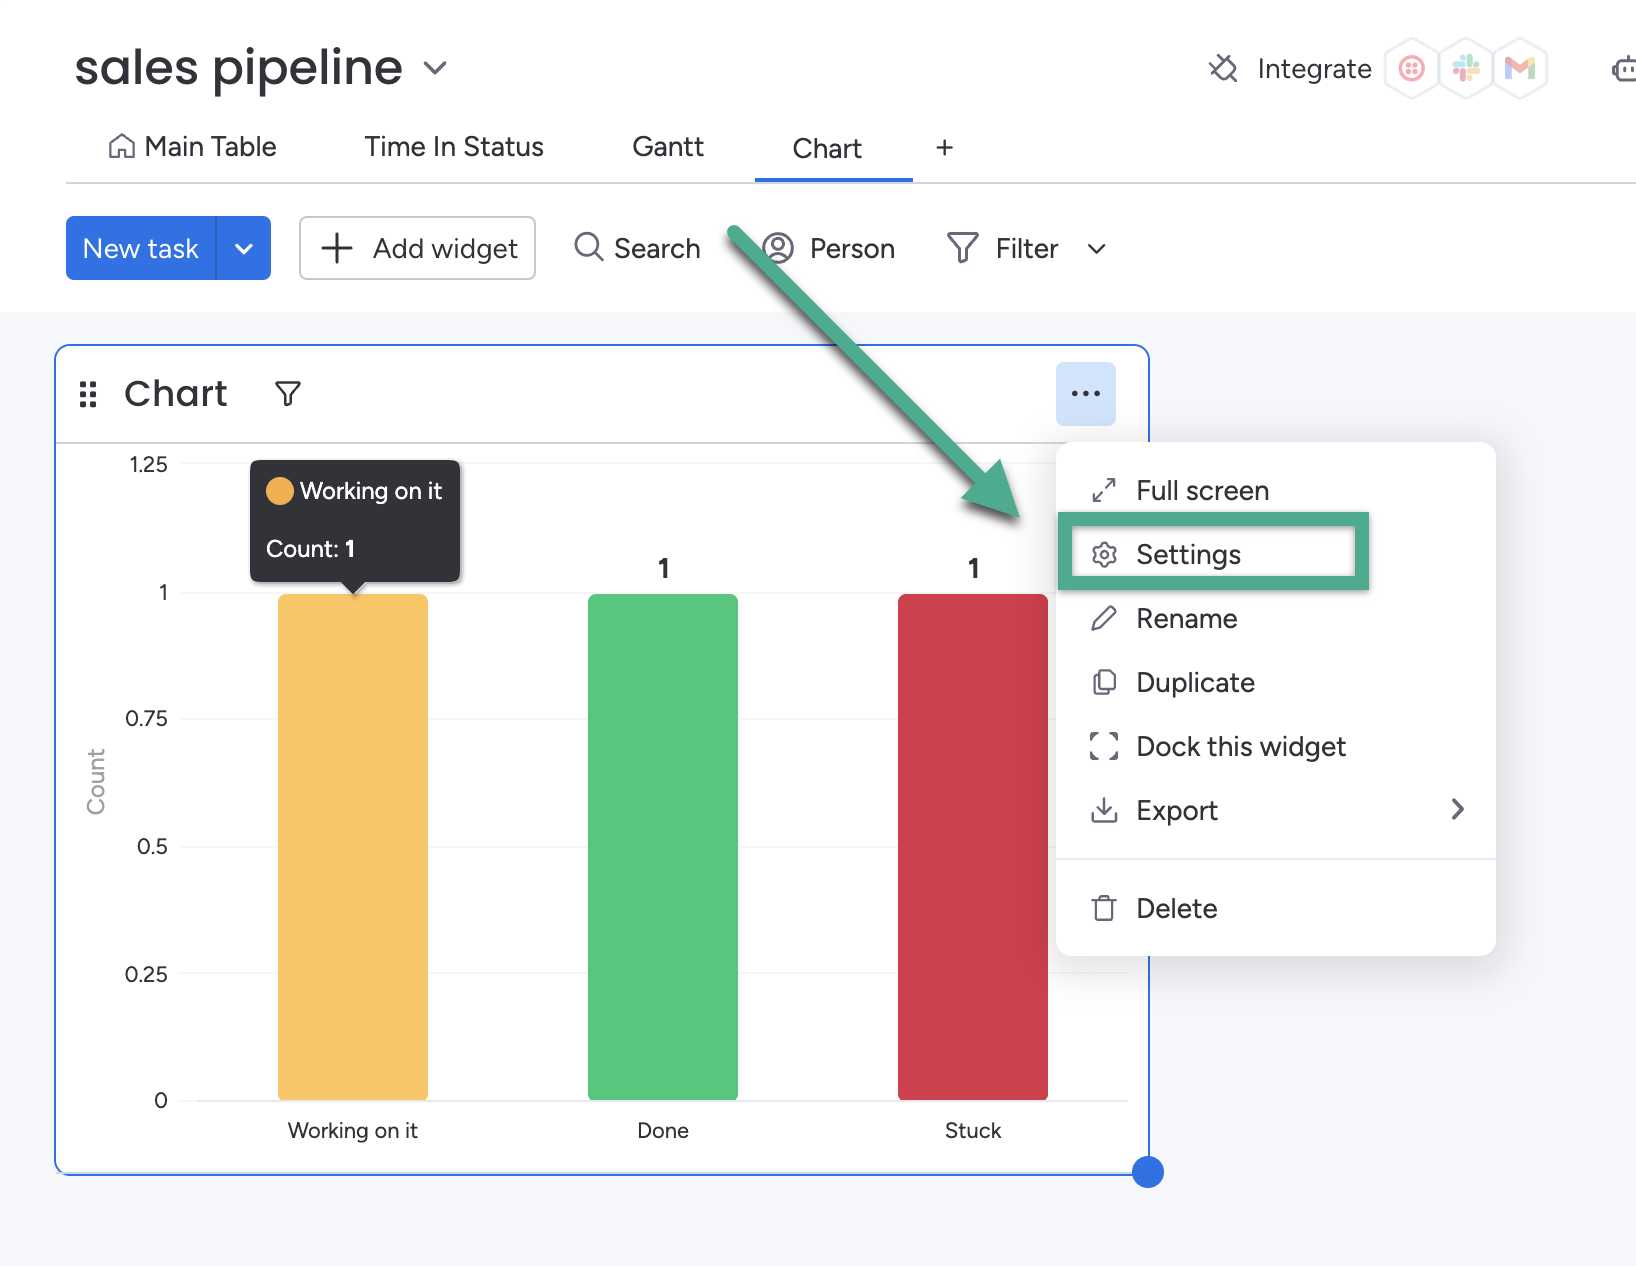
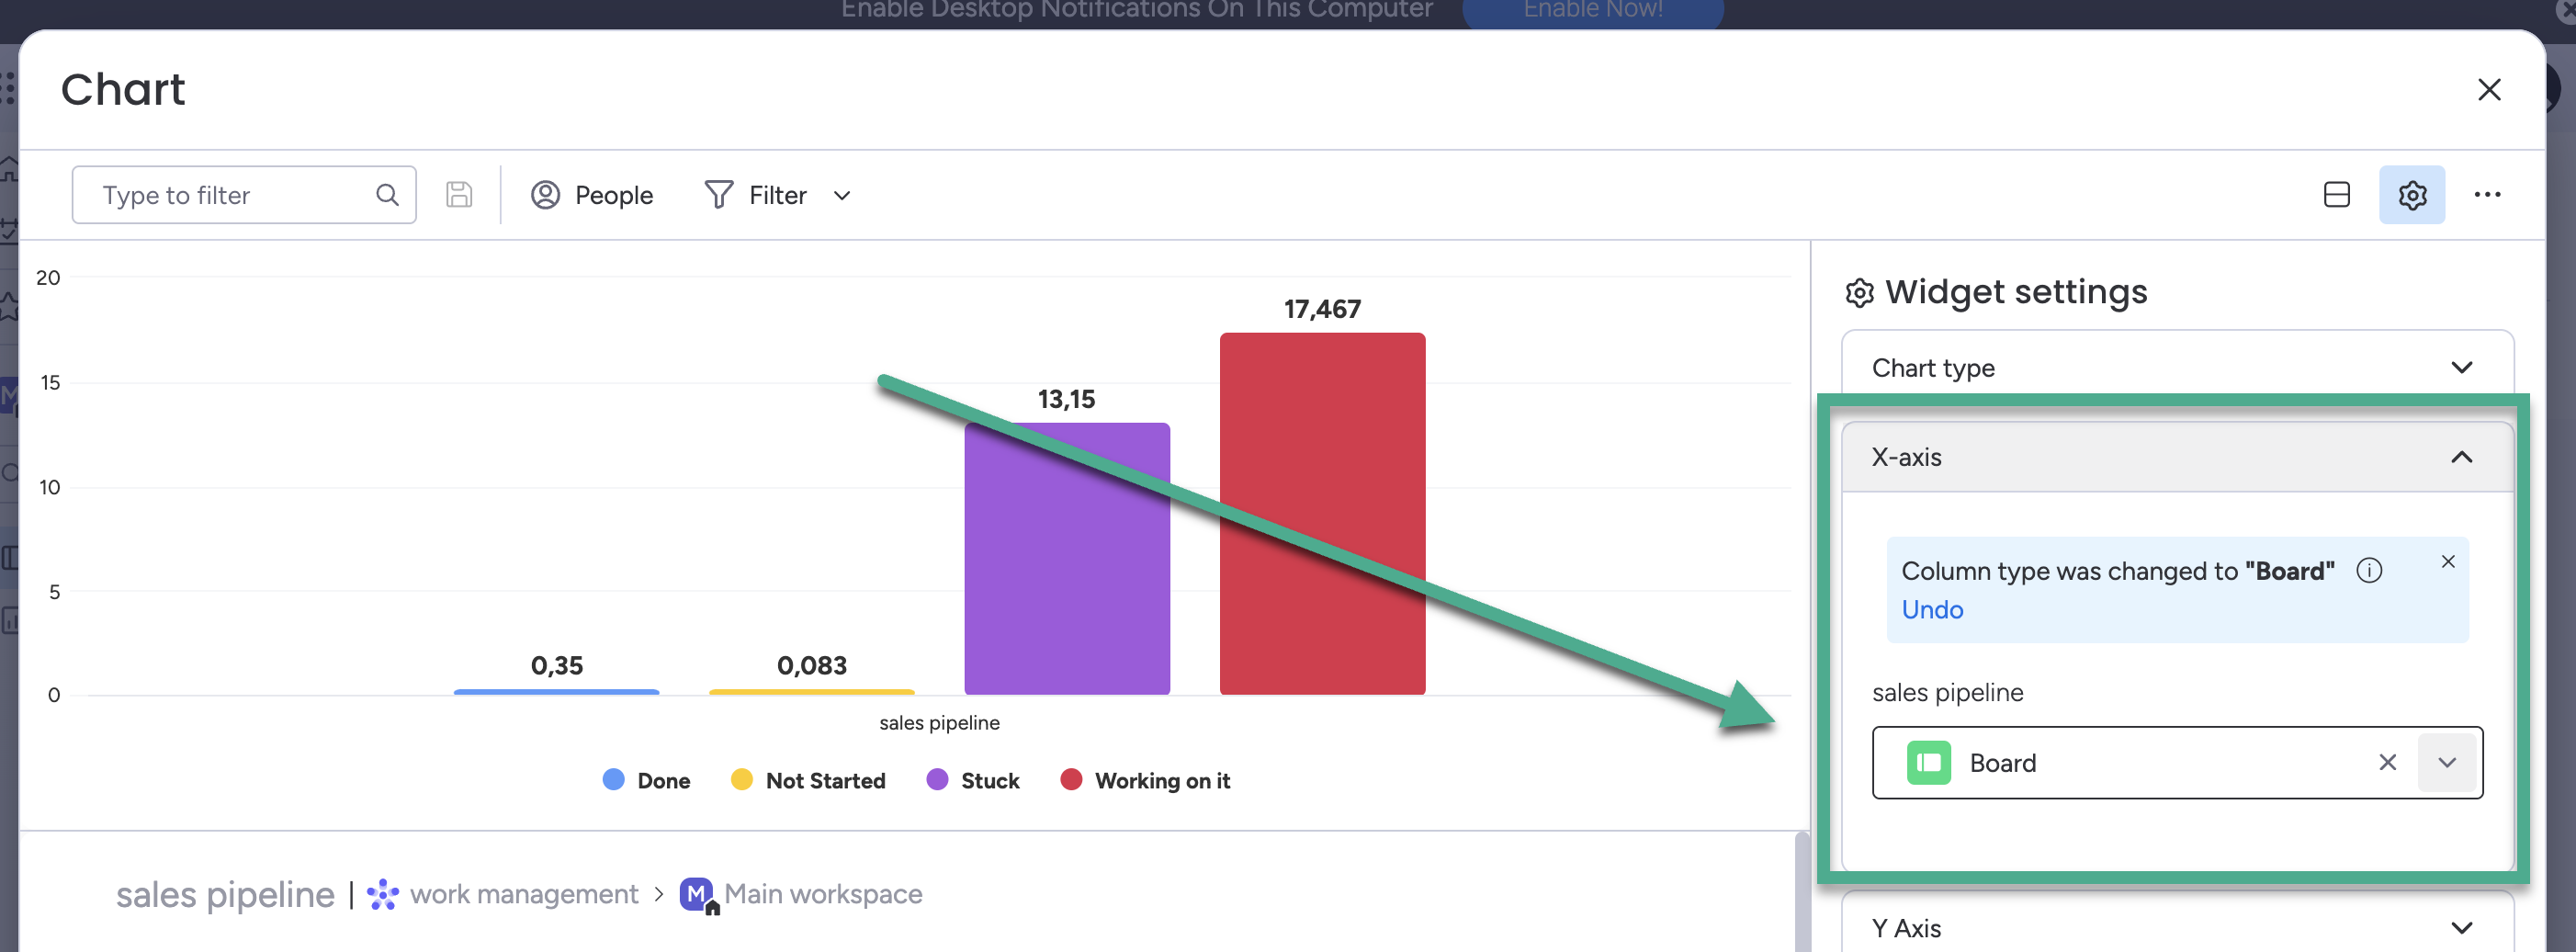
For example, to get Time in Status by Board configure the X-Axis and Y-Axis:
-
Set the "Board" option on the X-axis.
-
On the Y-axis, select the data related to the time spent on tasks (e.g., "Sum").
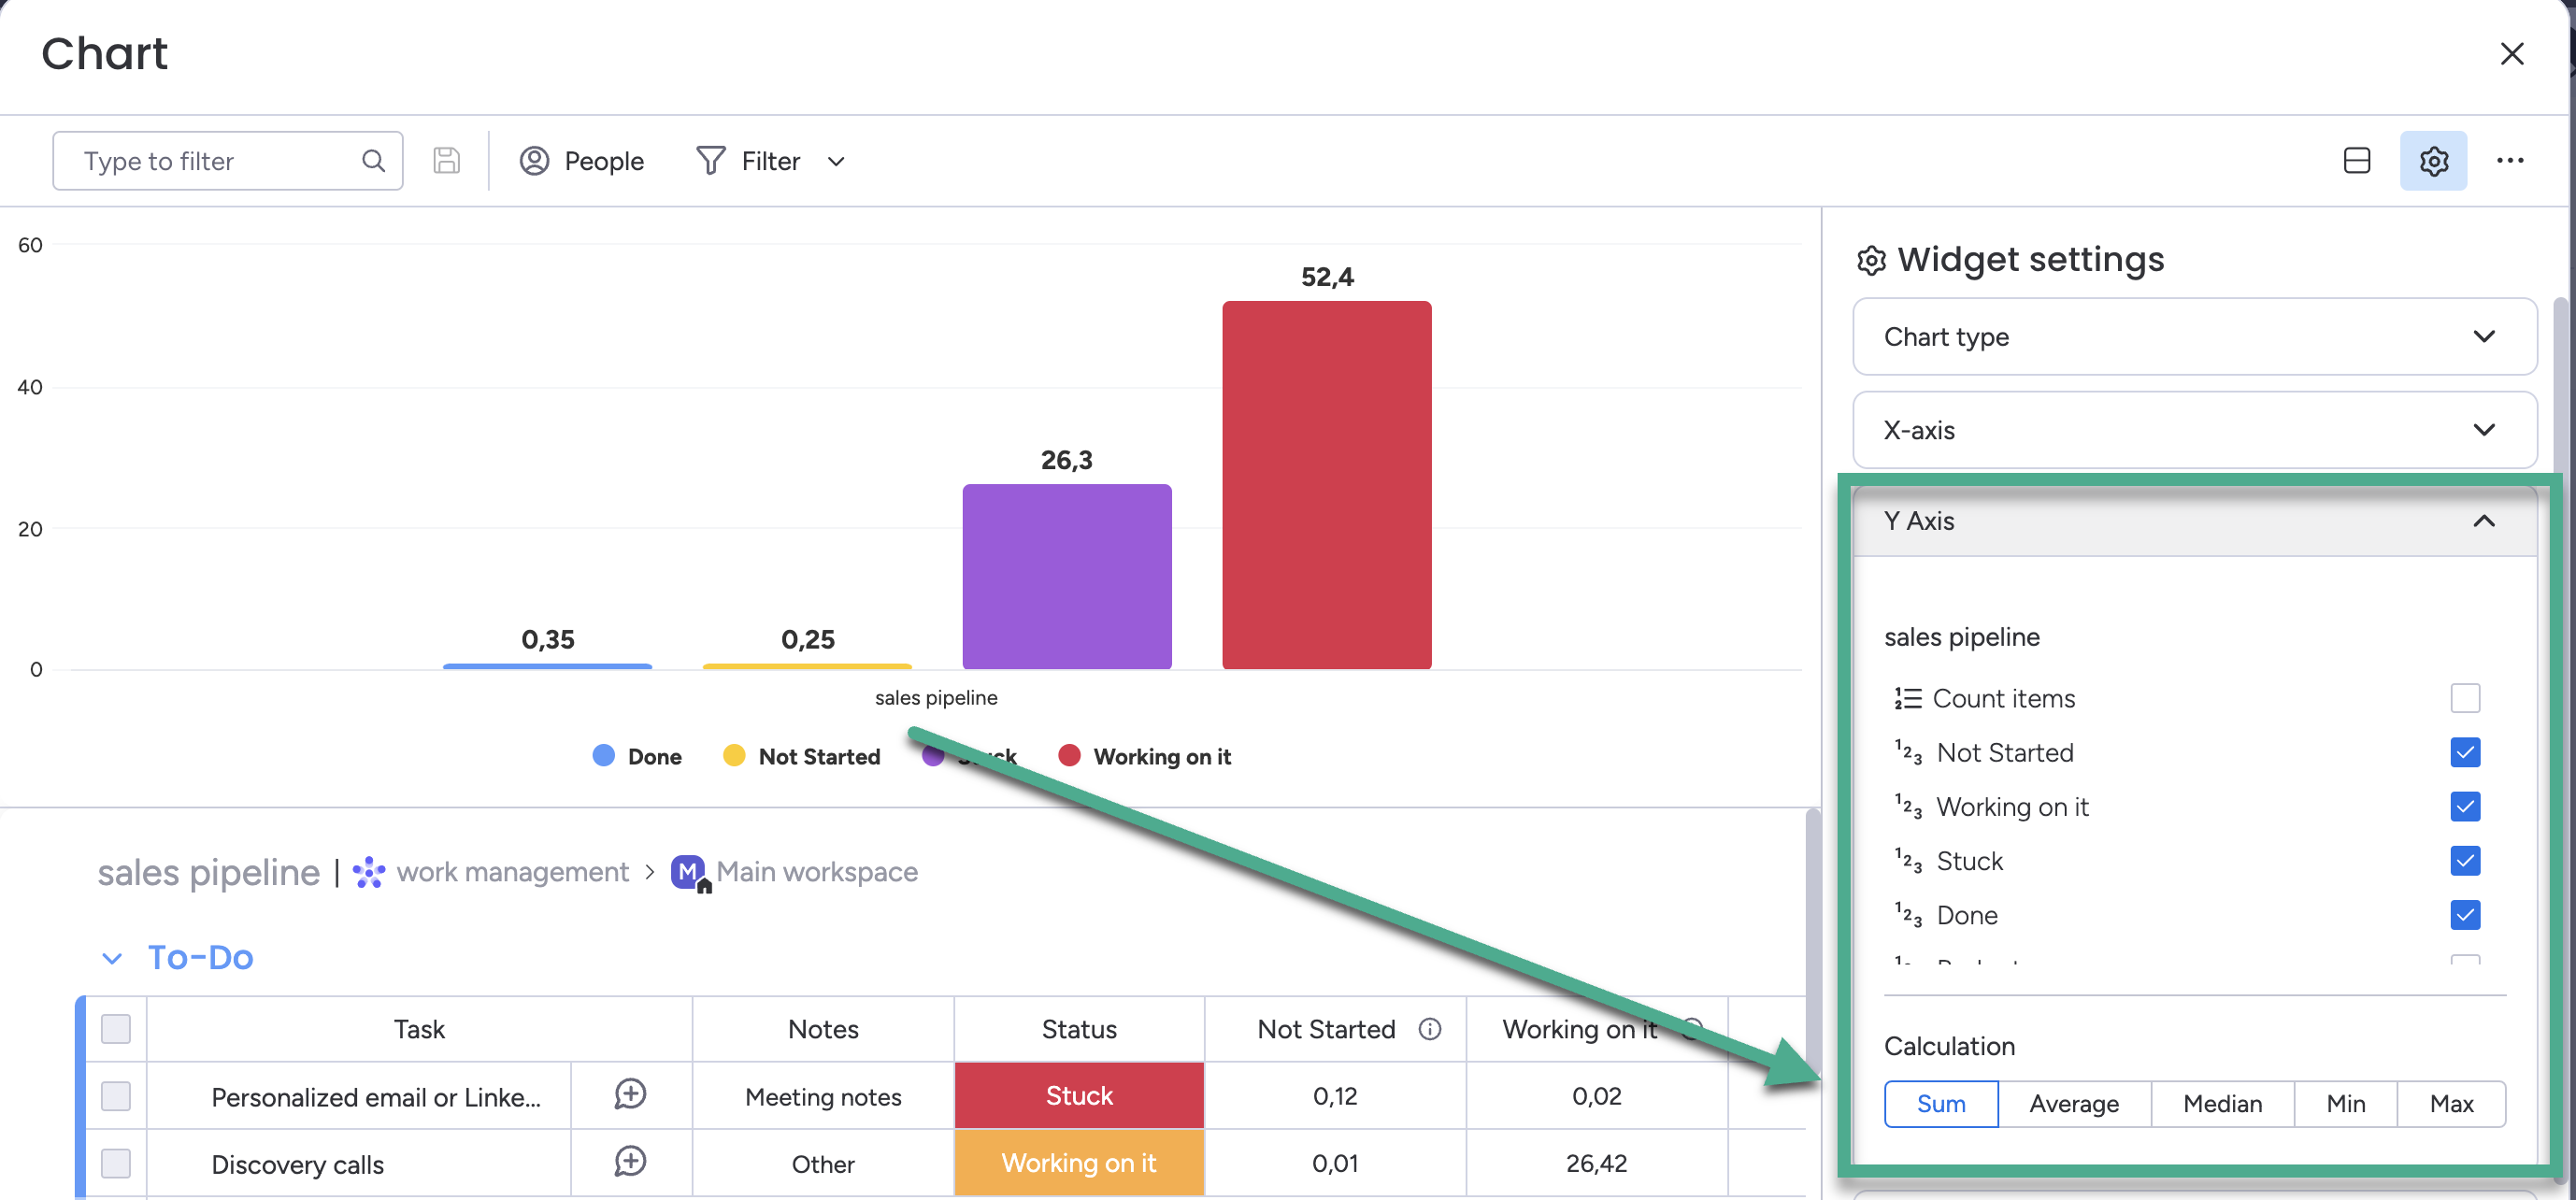
That's it! Enjoy your report and easily identify any bottlenecks.
Use cases:
If you need help or want to ask questions, please contact SaaSJet Support or email us at support@saasjet.atlassian.net
Haven't used this add-on yet? Try it now >>> Time in Status app for monday.com