
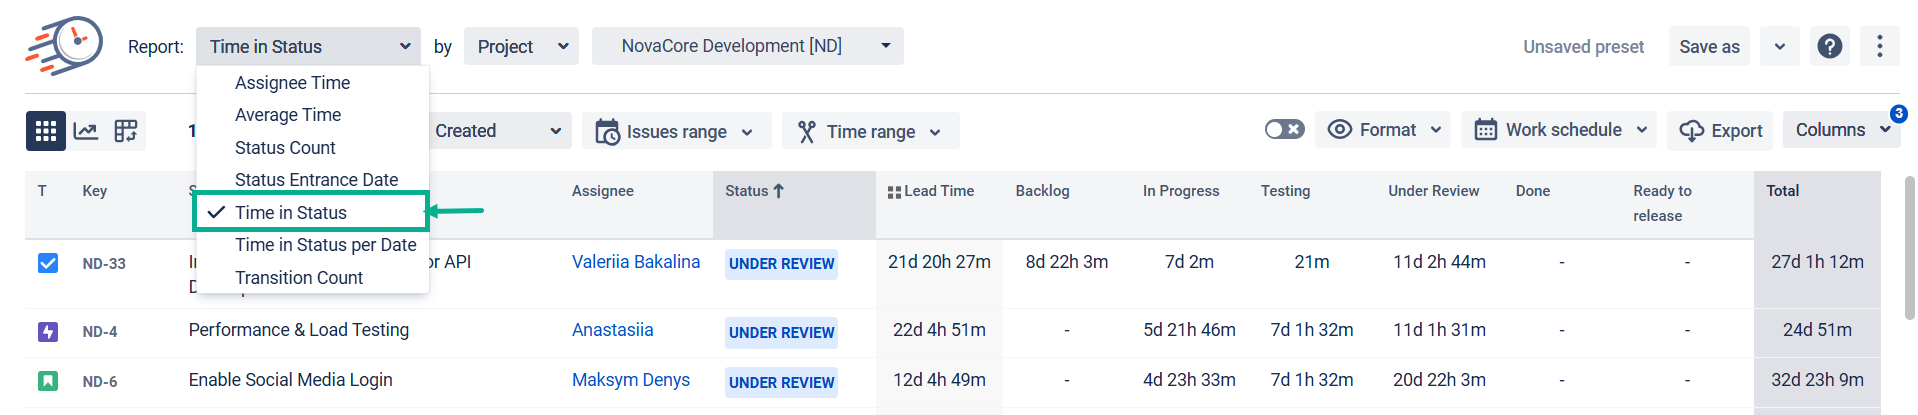
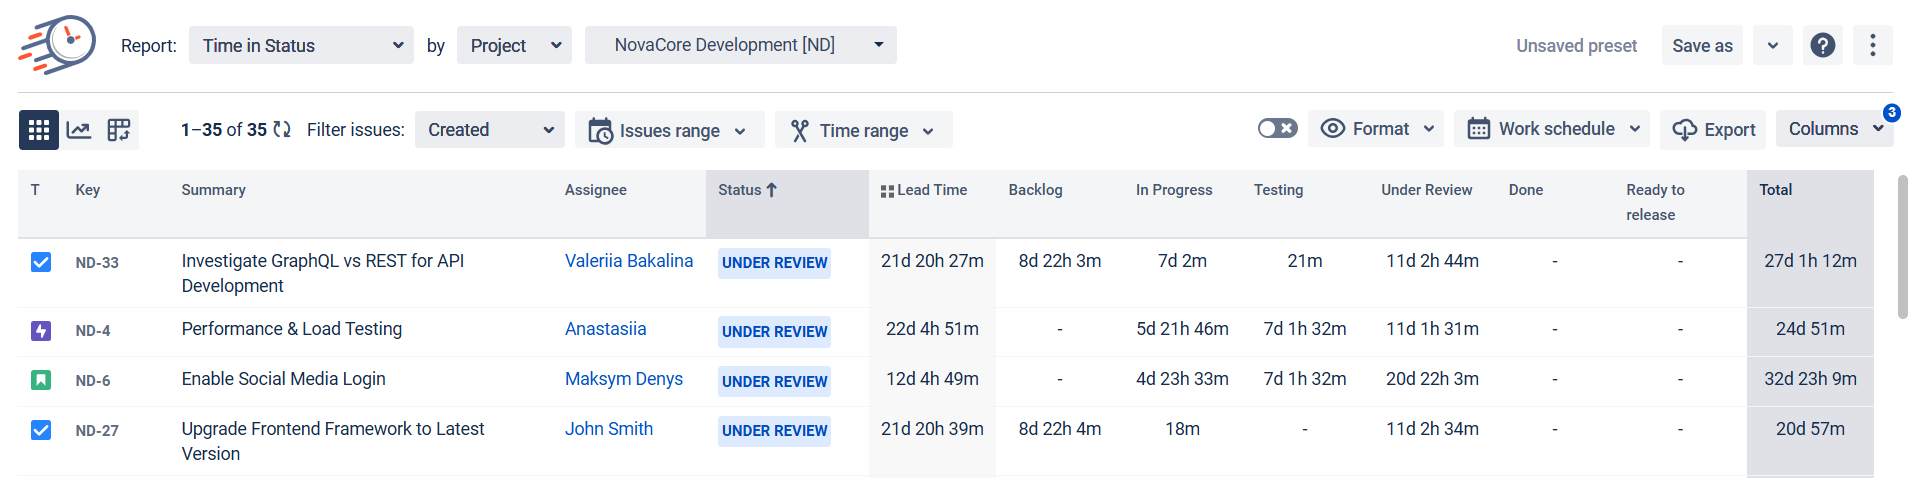
The Time in Status report displays how long an issue has been spent in each status.
-
Choose the Time in Status report;
-
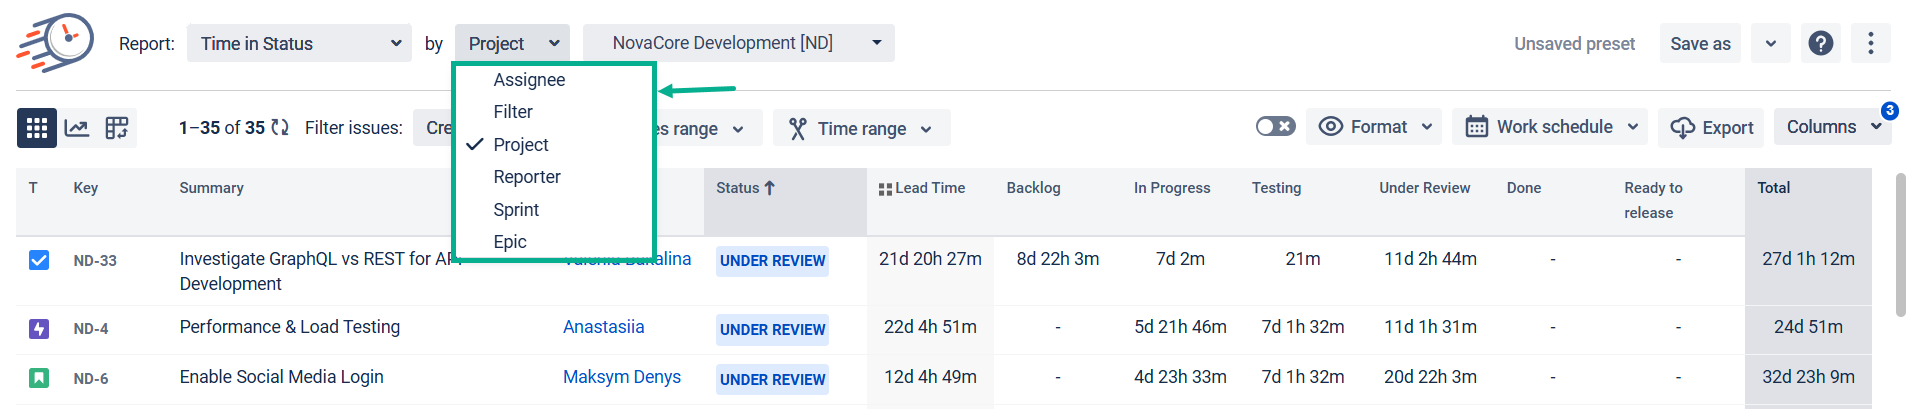
Filter by the category you need;
-
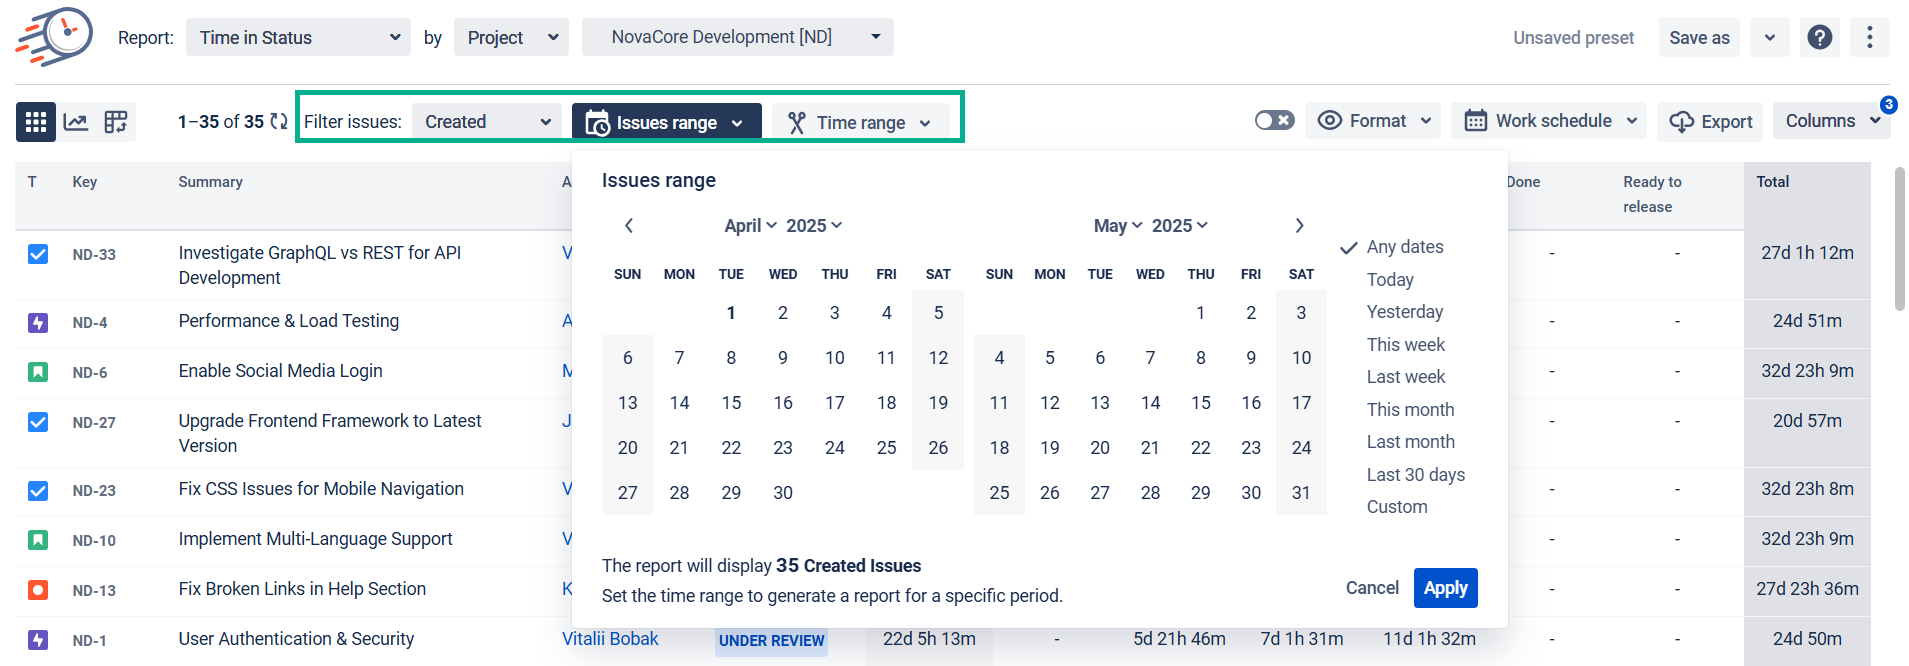
Choose the issues and date ranges for the data calculation;
-
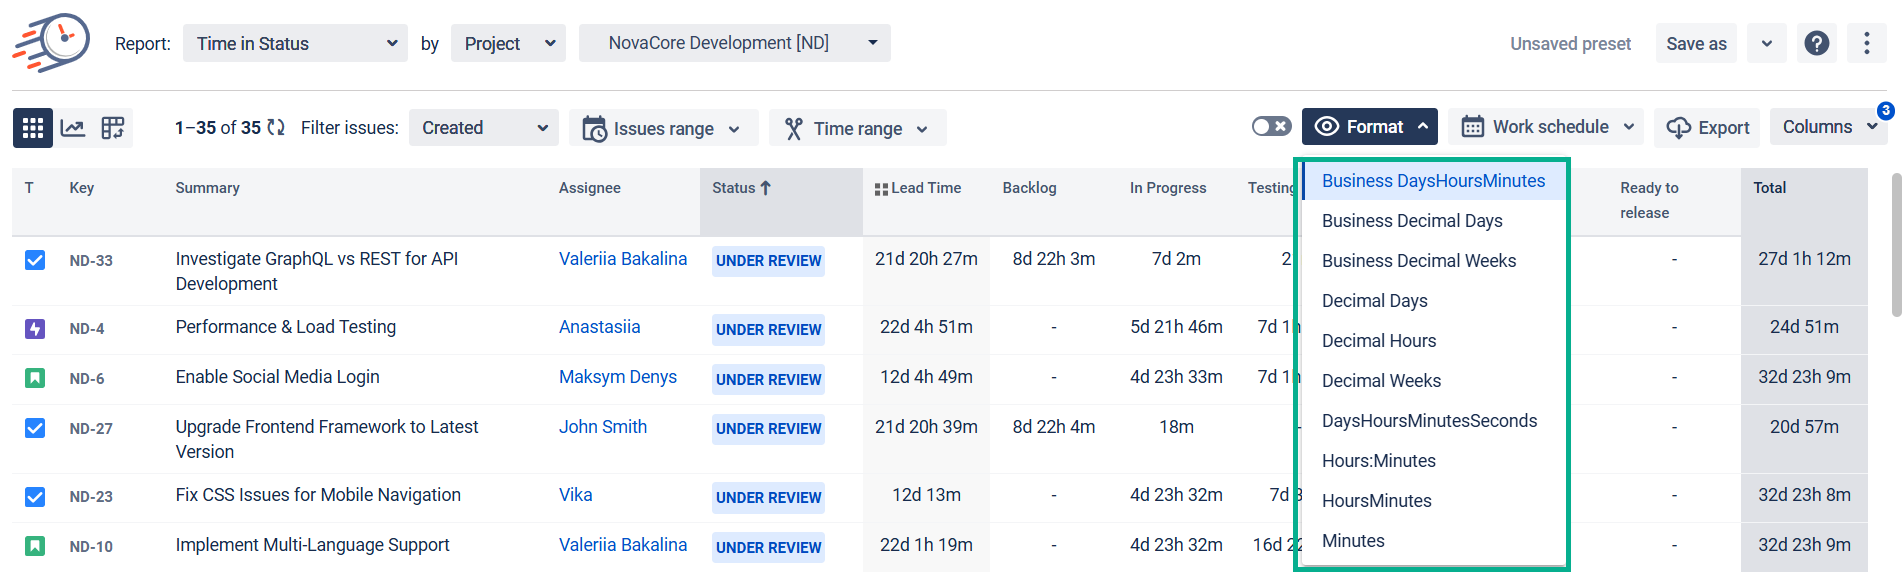
Choose the time format type that will be represented on the grid;
-
Get all the data on the grid as shown below.
Here's how the time in status data shown on the grid is calculated:
The report calculates how much time a task has spent in a particular status. Even if the task was in that status several times.
If you need help or ask questions, please contact SaaSJet Support
Haven’t worked with the add-on yet? Give it a try