Team Velocity in Jira: Analyze Committed vs Completed Values for Last 7 Sprints
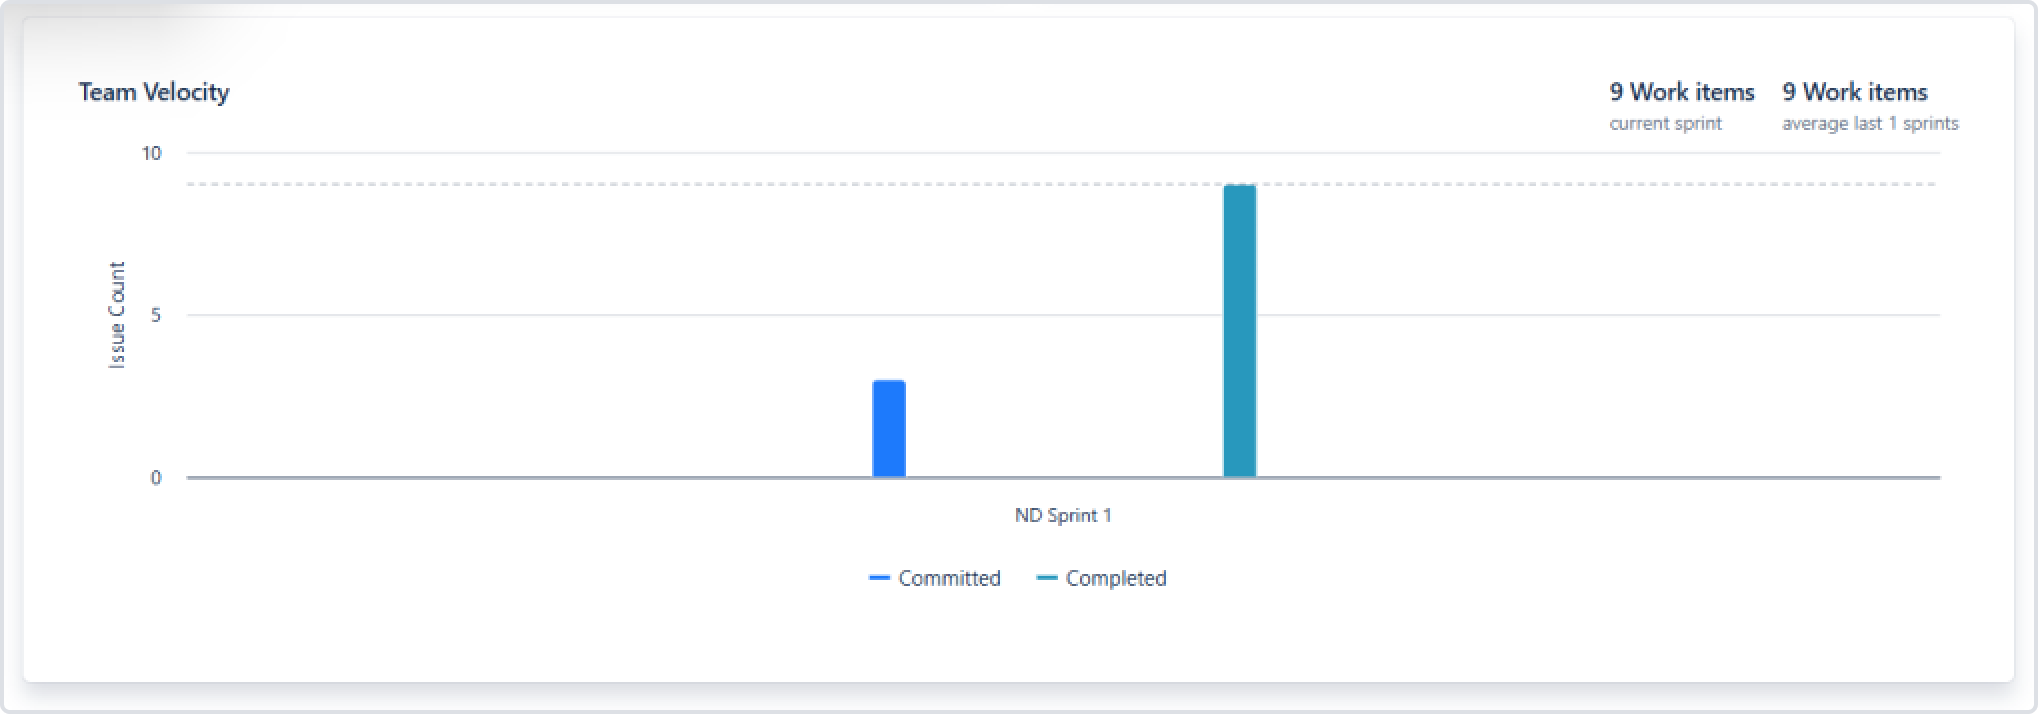
The Team Velocity chart displays the committed and completed values for the last seven completed sprints, including the selected sprint.

Where the first sprint is the selected sprint and the remaining six sprints should be determined by sorting by complete date from latest to oldest.
The selected sprint should be displayed as the rightmost sprint in the chart.
A chart that displays the committed and completed values for the last 7 completed sprints, including the selected sprint.
The first sprint would be the one you've chosen, and the last 6 sprints would be arranged based on their completion dates, starting with the most recent one.
Your selected sprint would be displayed on the right side of the chart.
If you need help or want to ask questions, please contact SaaSJet Support or email us at support@saasjet.atlassian.net
Haven’t worked with the add-on yet? Give it a try