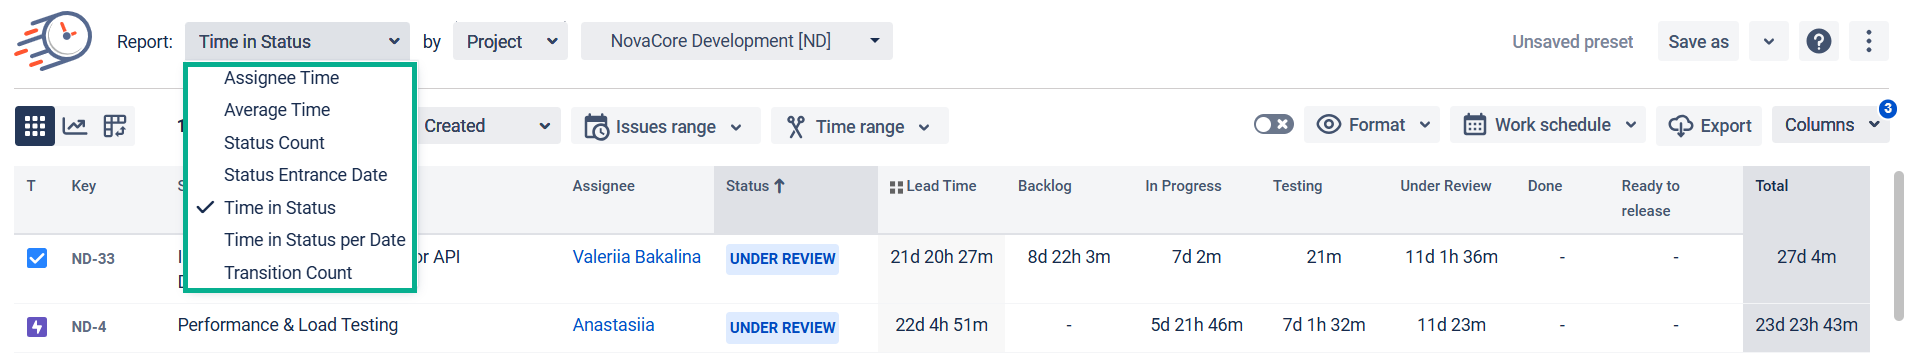
1. Select the report type
Choose the report you want to generate (see the list of reports).
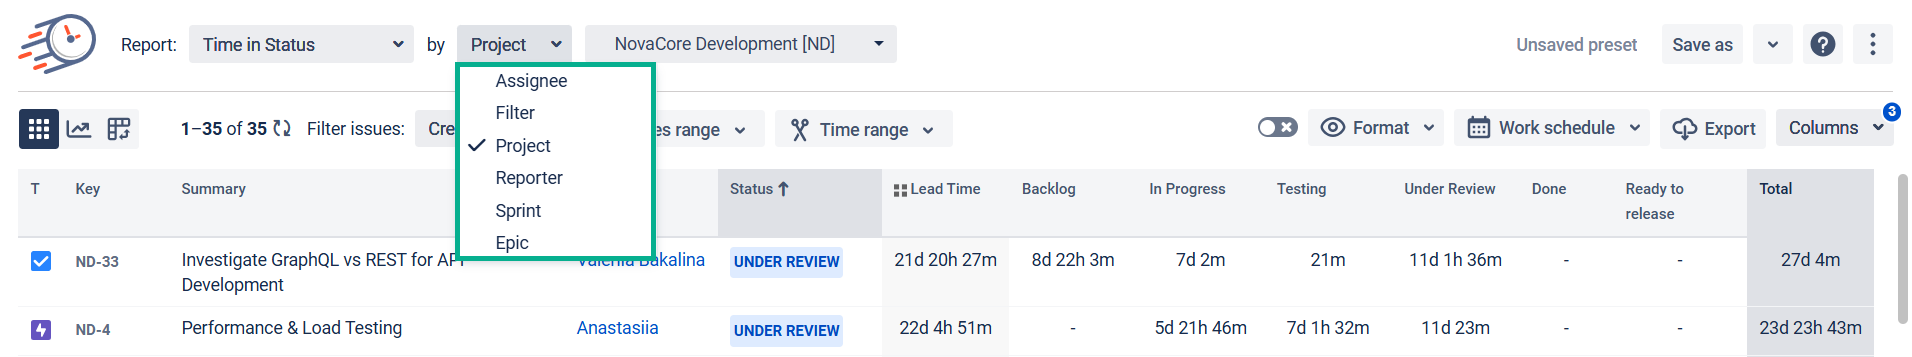
2. Filter the data
When generating the reports, you can filter data by:
-
Assignee
-
Filter
-
Project
-
Reporter
-
Sprint
-
Epic
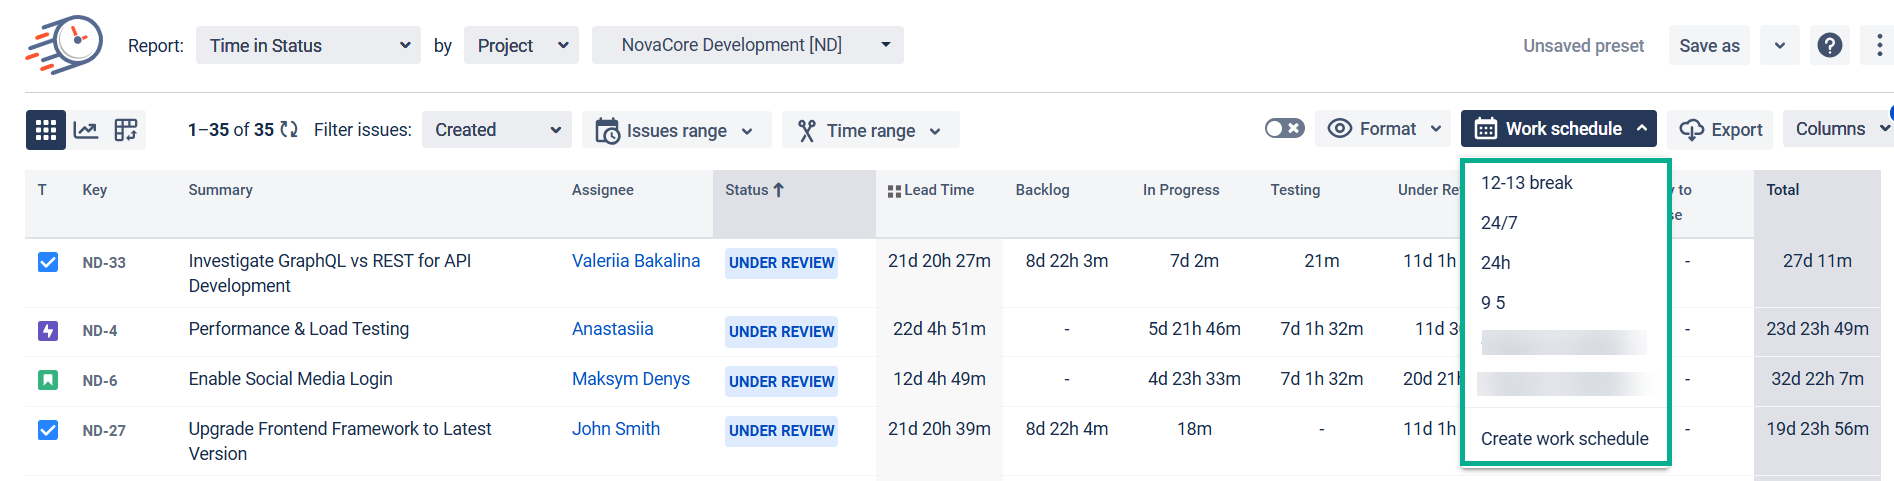
3. Choose a Work Schedule
Select a necessary Calendar to generate data. There, you can choose a custom calendar you've added previously or a default 24/7 one.
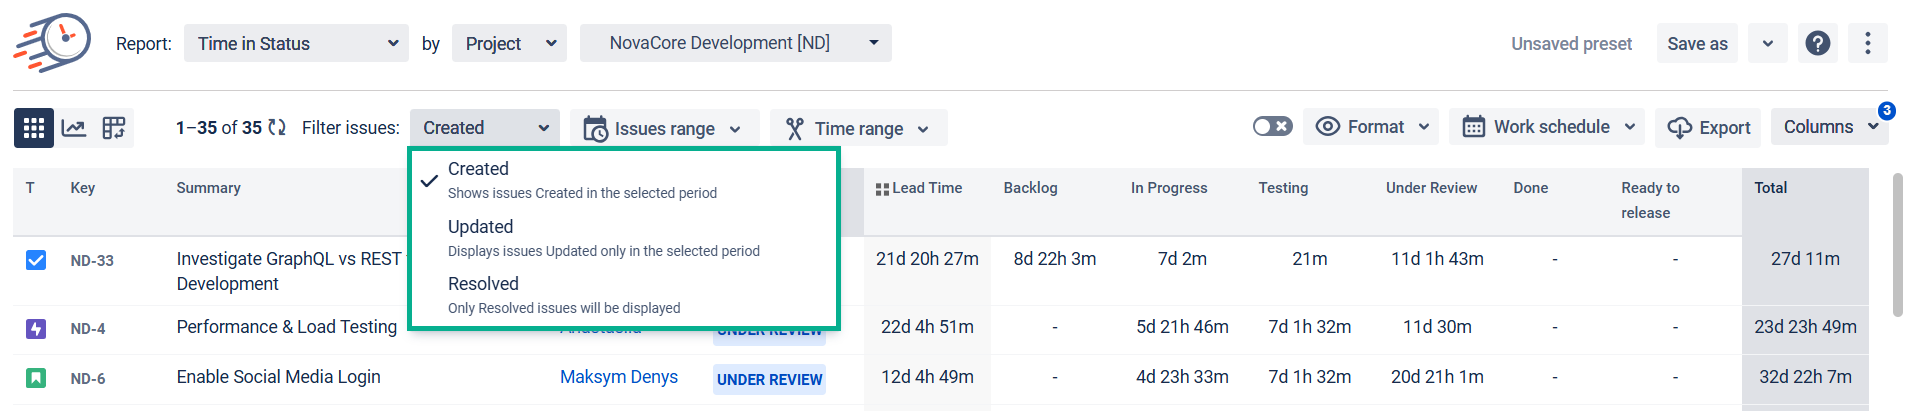
4. Filtering issues
Use the Filter issues functionality to customize report timeframes.

You can select three date ranges from the drop-down list that allows sorting issues depending on the dates of creating, updating, or solving issues.
-
Created
-
Updated
-
Resolved
Then, you can choose the period in which you want to get the report.
By clicking Any dates, you’ll get 2 calendars displayed on a screen.
-
Issues range – to select issues Created, Updated, or Resolved during the required period.
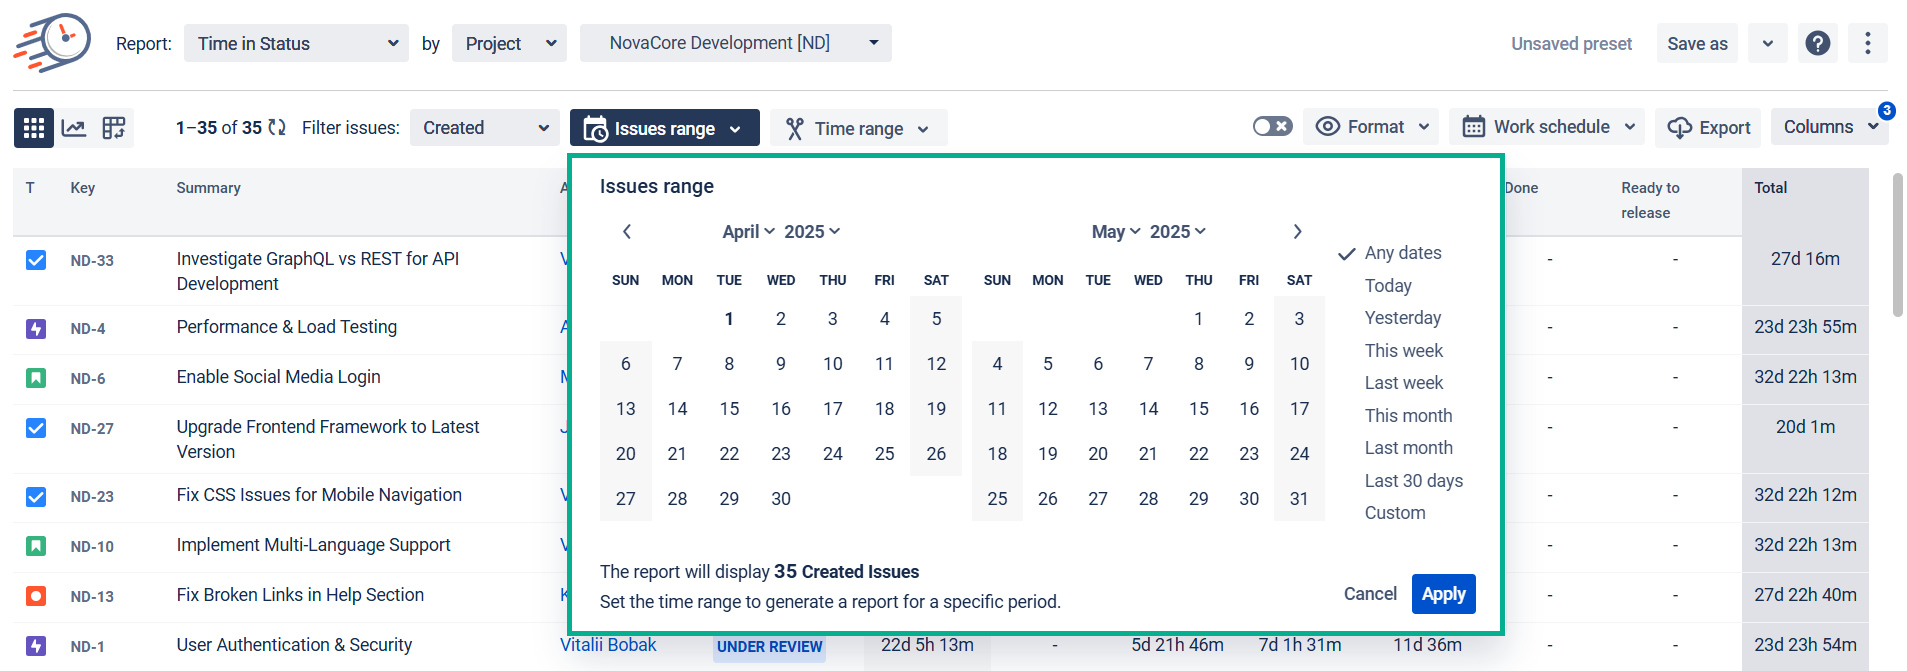
-
Time range – to get issues for a specific date or date range without considering creating, updating, or resolving.
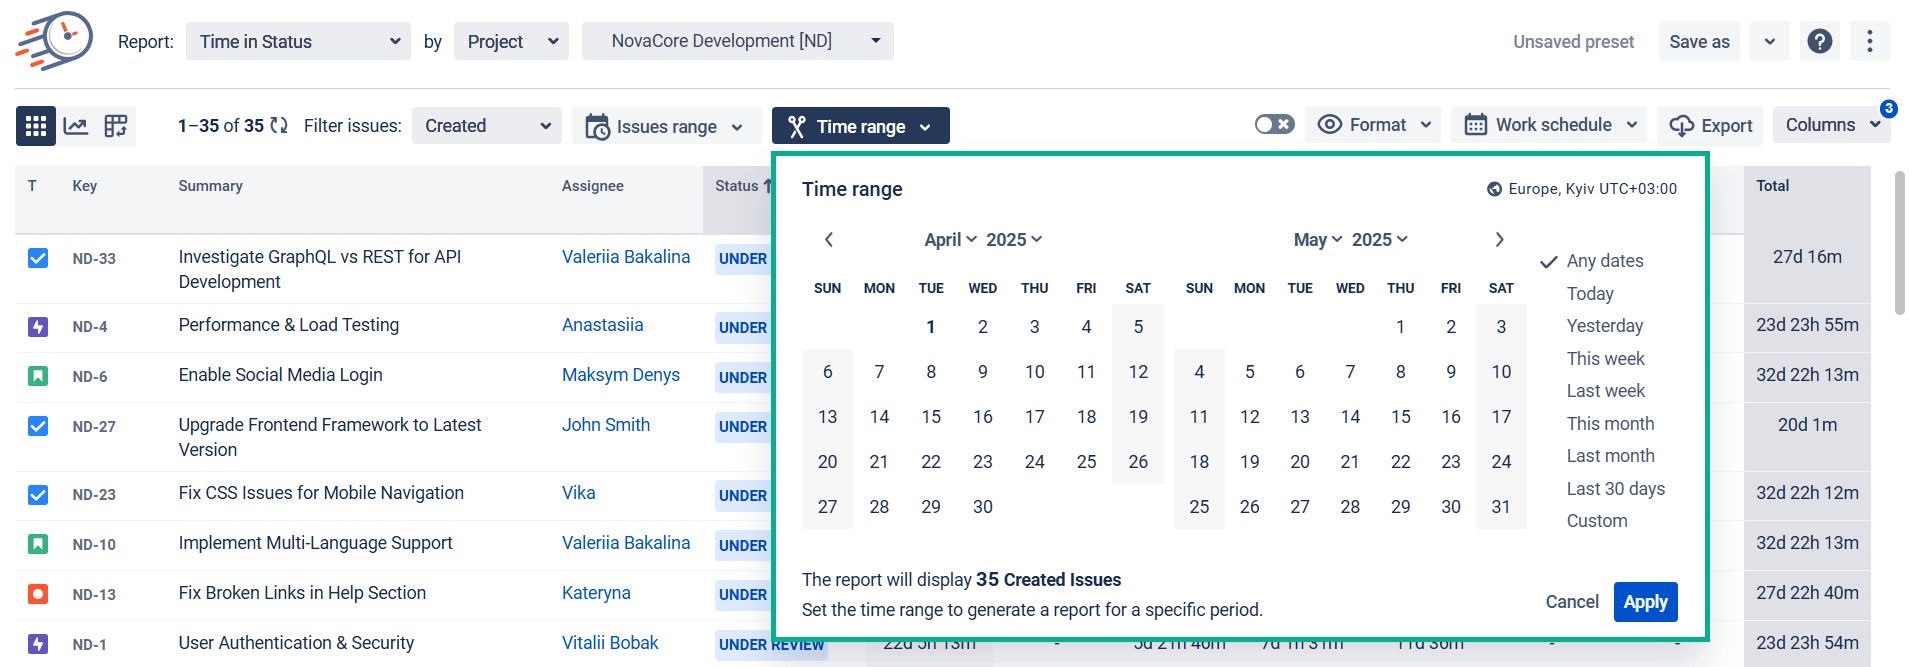
Read more in Setting Issue and Time Ranges in Jira Time in Status app section.
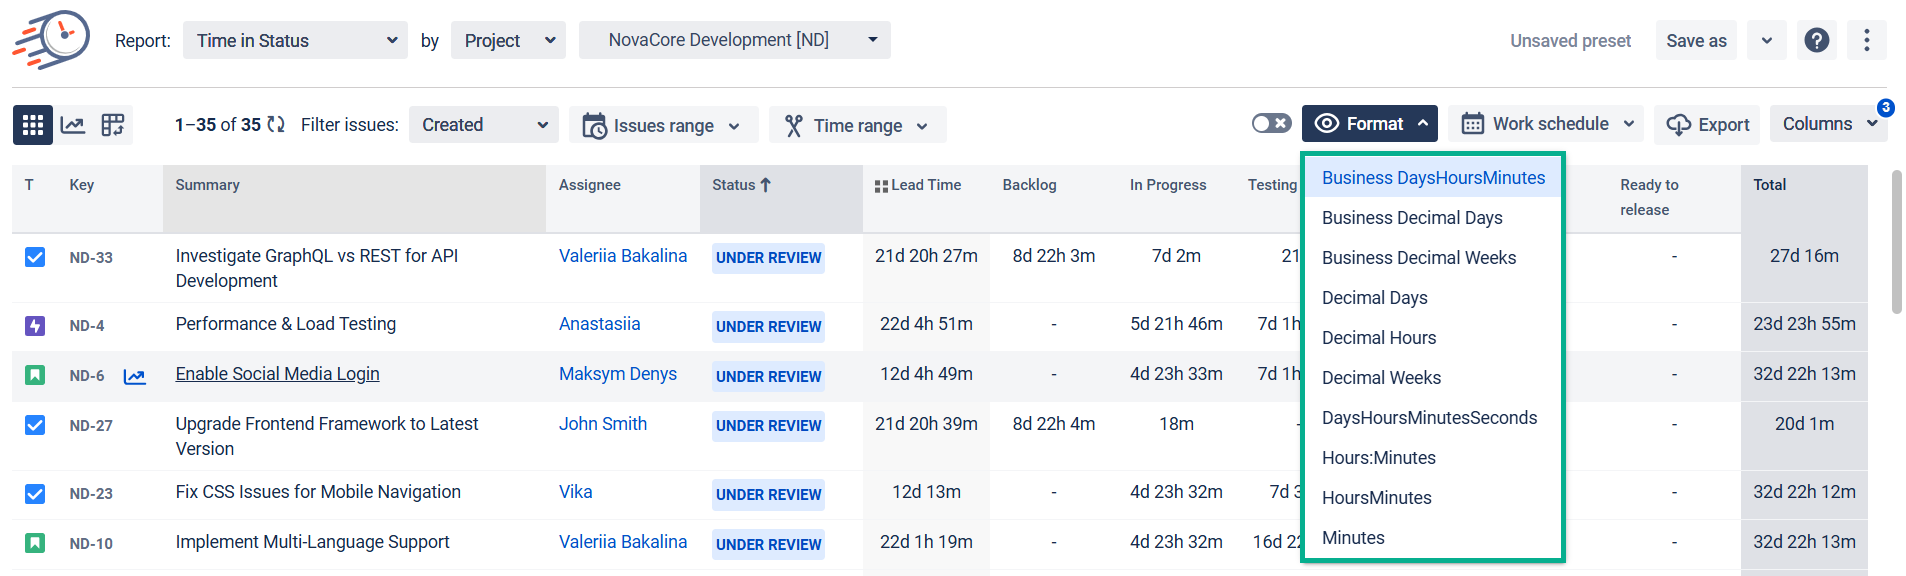
5. Choose a Time format
The Format option lets you select the time format of status duration:
-
Minutes
-
HoursMinutes
-
Hours:Minutes
-
DaysHoursMinutes
-
Decimal Weeks
-
Decimal Hours
-
Decimal Days
-
Business Decimal Weeks
-
Business Decimal Days
-
Business DaysHoursMinutes
Note
To extract data for analysis, please choose one of the Decimal time formats (Decimal Hours, Decimal Days or Decimal Weeks). It will enable you to perform calculations on the exported data and build charts.
Business DHM, Business Decimal Days and Business Decimal Weeks formats show data according to your determined business days.
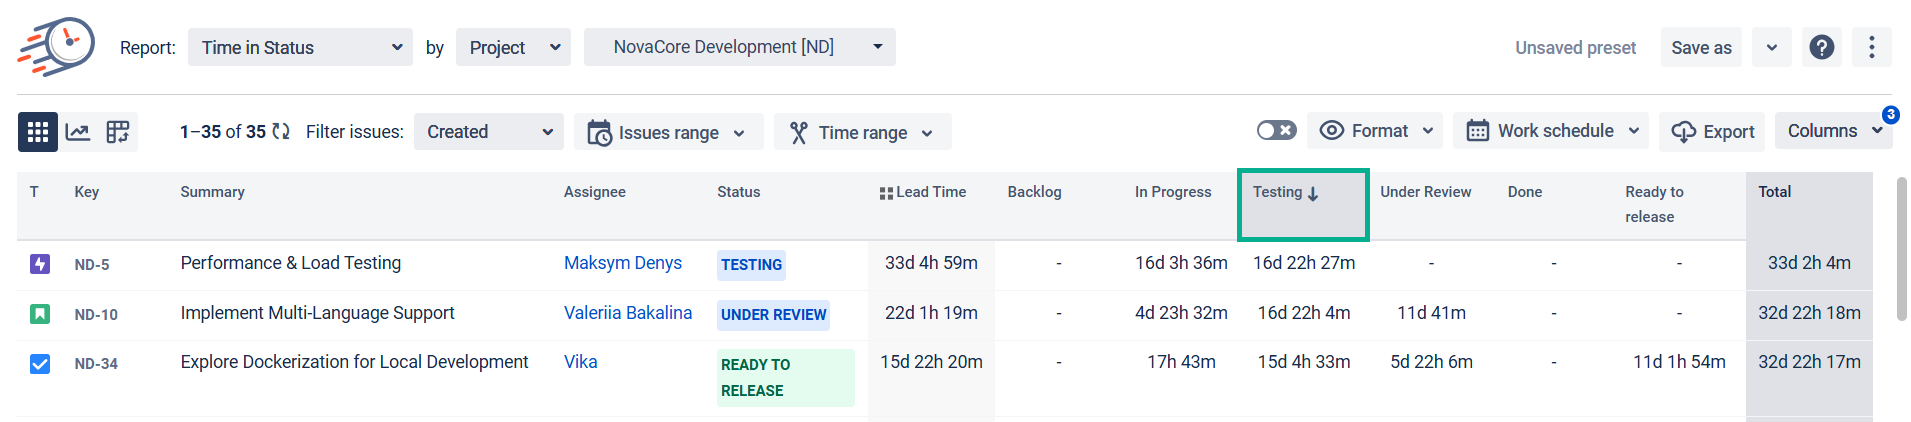
6. Sorting data
Click the column to sort the values in descending or ascending order. You can sort any column, including Jira fields and calculation data.
Sorting data is available for all reports based on issues or assignees.
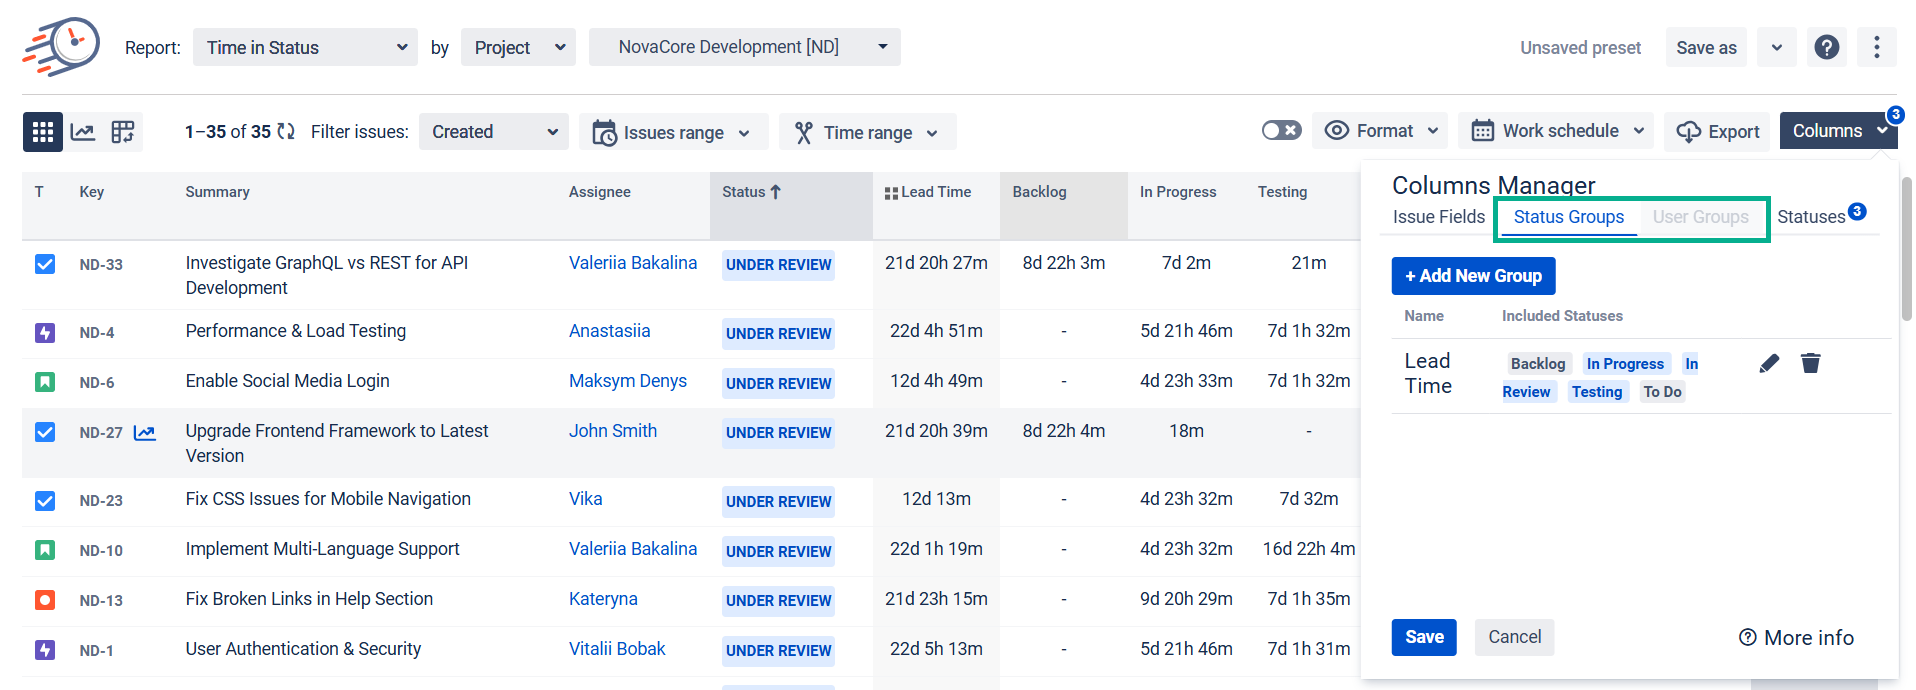
7. Column Manager
In the Column manager, you can manage the Issue Fields, Status Groups (read more about Status Groups), User Groups (read more about User Groups) and Statuses.
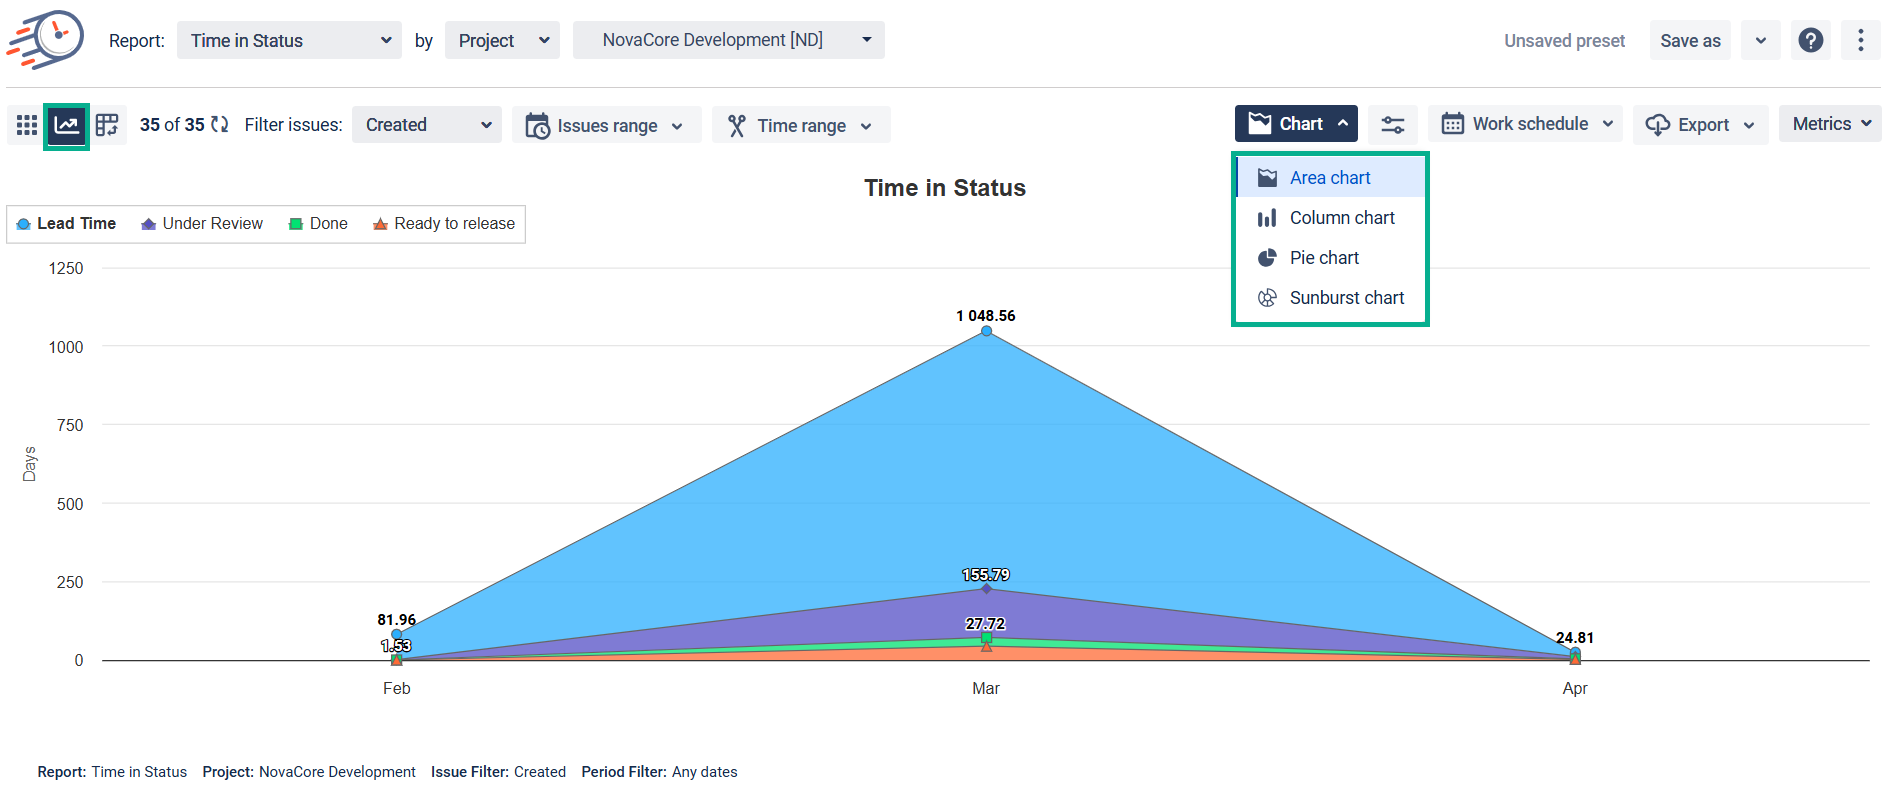
8. Chart Reports
All reports are available as Grid and Charts.
Three types of graphs are available: Pie, Bar, Area and Sunburst Charts.
For more information, visit Chart Reports View.
9. Export
Export data as XLSX or CSV file and analyze it using such tools like Excel or Google Spreadsheets.

*Please note, that in order to extract the data for analysis, please choose one of the Decimal time formats. It will enable you to perform calculations on the exported data and build charts.
If you need help or ask questions, please contact SaaSJet Support or email us at support@saasjet.atlassian.net
Haven’t worked with the add-on yet? Give it a try