
The Sprint Report page offers a visual breakdown of key sprint metrics through easy-to-understand charts. These charts provide insights into work completed, team velocity, scope changes, and overall sprint performance, helping to track progress and identify areas for improvement.
Each section focuses on specific aspects of the sprint, such as committed versus completed work, team workload, and scope changes. The data is measured using Story Points, Original Time Estimates, or work item Count, depending on the chosen board estimation method, offering a clear view of the sprint’s outcomes.
Section #1 - Sprint information
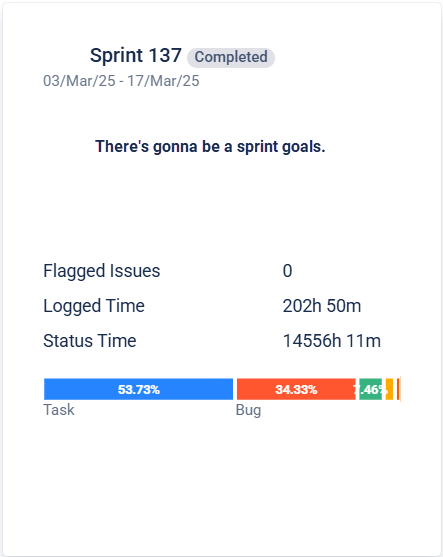
Sprint name - The name given to a sprint when a user creates it.
Sprint ranges - The sprint's start and end dates, representing when it begins and finishes.
Sprint goals - goals that were set for the sprint.
Flagged Work Items - The total count of work items flagged during the selected sprint.
Logged Time - The total time team members spend on each work item during the sprint, calculated from worklog records between the sprint's start and completion dates.
Status Time - The total time work items spent in different statuses during the sprint, excluding the first and last status on the board. This is measured from the sprint's start to its completion.
Sprint Work Item Structure - A chart showing the percentage of each work item type in the sprint at completion.
-
Each work item type is represented as a slice.
-
The size of each slice corresponds to its percentage of the total work items.
-
The percentage is calculated as: (Work Item Type / Total Work Items) × 100
The calculation includes all work item types as of the sprint's completion date.
Section #2 - Team Velocity
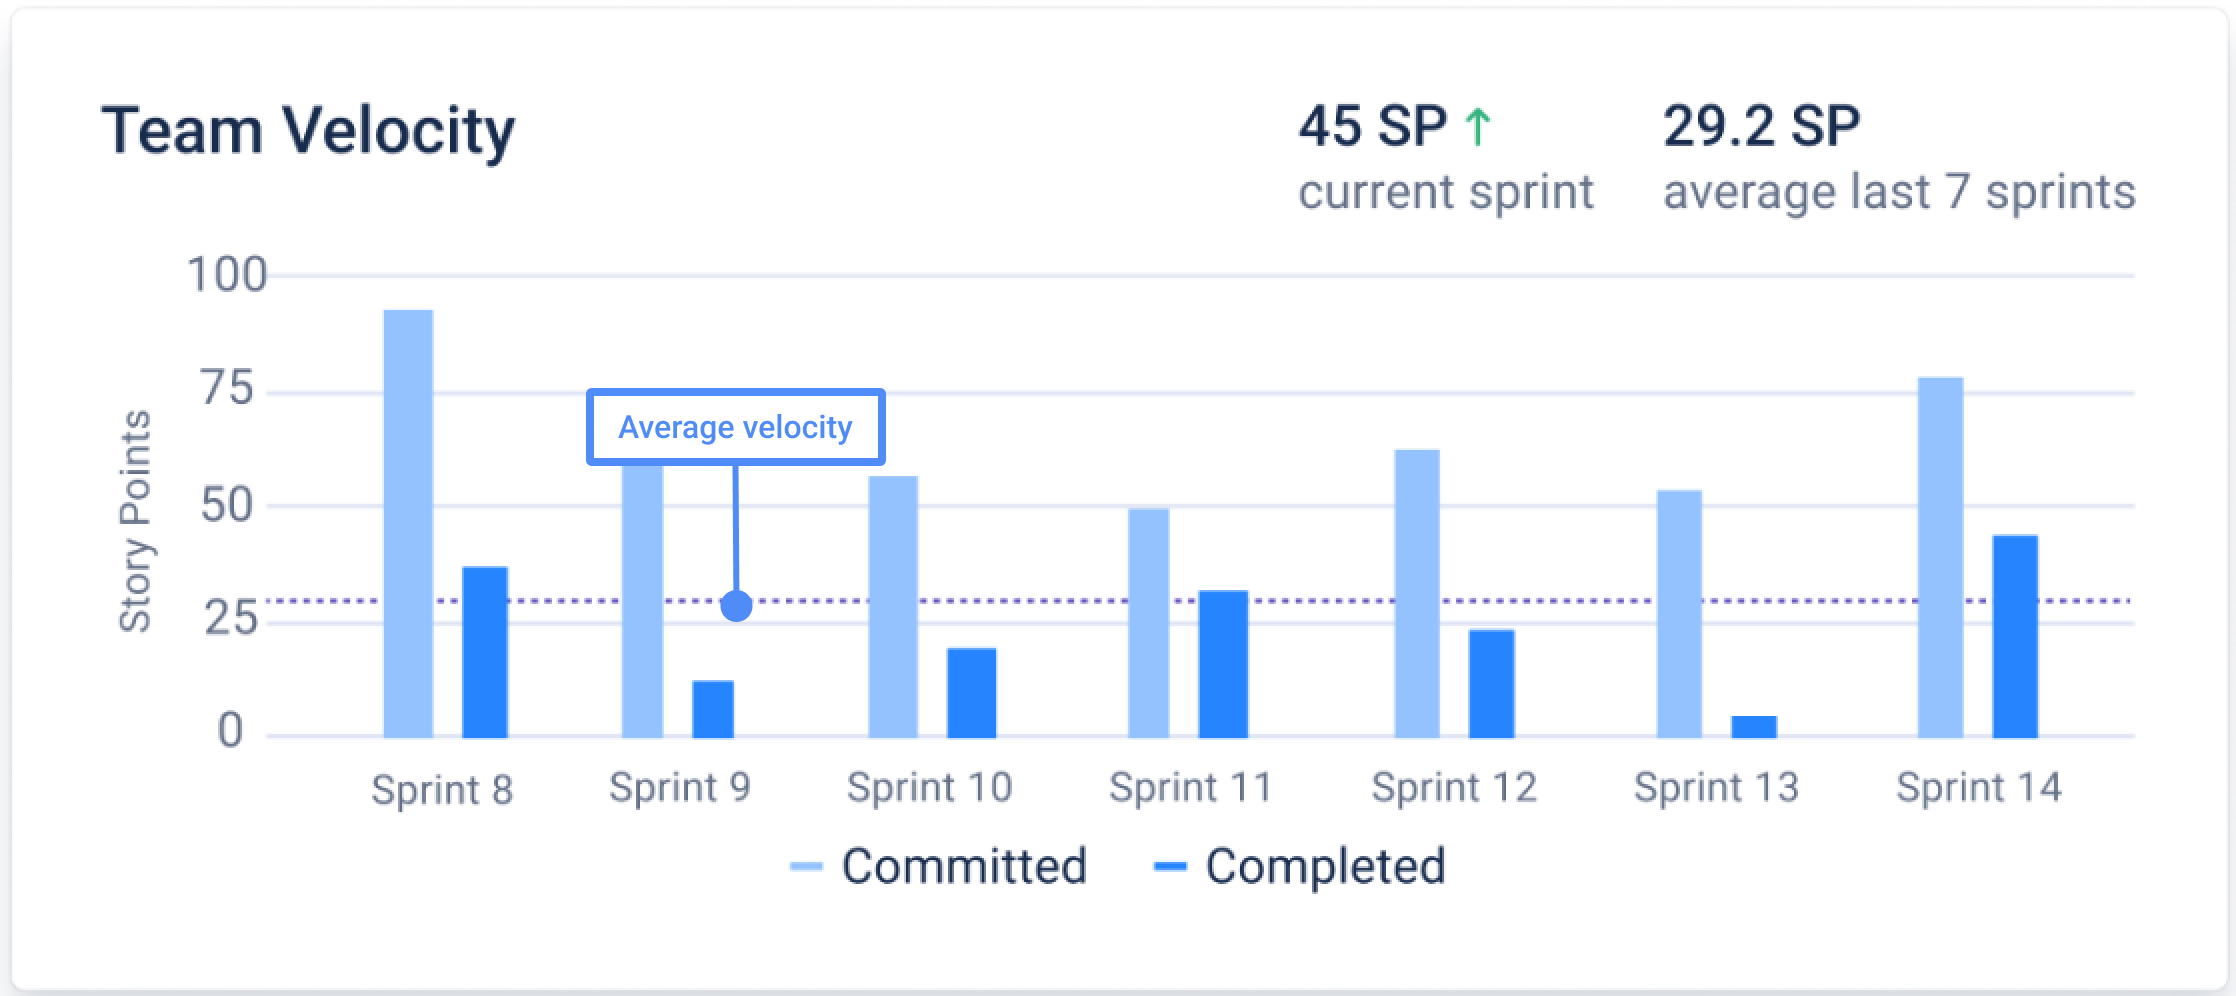
A chart shows the committed and completed values for the last seven completed sprints, including the selected sprint.
-
The selected sprint is shown as the rightmost sprint.
-
The other six sprints are listed in order of completion, from the most recent to the oldest.
-
The chart displays a total of seven sprints, with the selected sprint as the first one.
Committed
The amount of work the team takes on at the start of the sprint is measured in three ways depending on the chosen board estimation method: Story Points, Original Time Estimate or Work Item Count. This is based on the total estimates for work items in the sprint at the start, excluding those in the final status on the board.
Completed
The amount of work completed during a sprint is measured in three ways depending on the chosen board estimation method: Story Points, Original Time Estimate or Work Item Count.
This is based on the total estimates for work items that reached the final status on the board by the end of the selected sprint.
Average Velocity
A value that shows the average amount of work completed over the last seven sprints, including the selected sprint. The selected sprint is the first, and the other six sprints are sorted by completion date, from the most recent to the oldest.
This is measured using three methods, depending on the board's chosen estimation method: Story Points, Original Time Estimate or Work Item Count.
Formula: (Completed of Sprint 1 + Completed of Sprint 2 + ... + Completed of Sprint 7) / 7, where 7 is the total number of sprints.
Section #3 - Workload
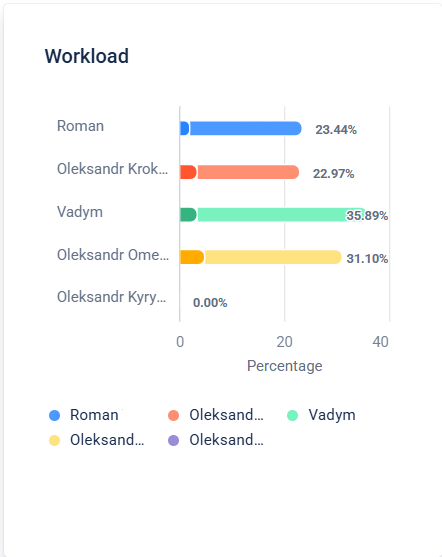
The amount of work assigned to each team member.
This is displayed as a stacked bar chart, showing the committed, added, and removed work for each assignee in the selected sprint.
-
The bar is divided into sections:
-
Positive sections represent work that was committed and added.
-
Negative sections represent work that was removed.
-
Unassigned work items may also appear.
The chart is measured using three methods, depending on the board’s chosen estimation method: Story Points, Original Time Estimate, or Work Item Count.
Formula: (Committed-a + Added-a - Removed-a) / Committed
Where:
-
Committed-a is the amount of work assigned to a team member at the start of the sprint.
-
Added-a is the amount of work added to the assignee during the sprint.
-
Removed-a is the amount of work removed from the assignee during the sprint.
-
Committed is the total amount of work the team takes on at the start of the sprint (same as in Velocity).
This calculation is done for each assignee.
Section #4 - Completion rate
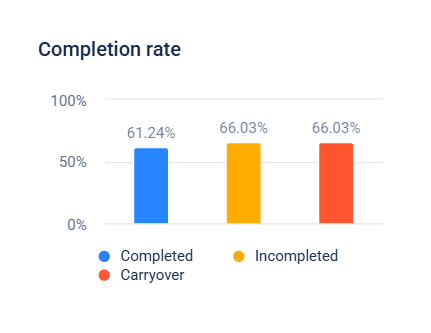
The completion rate is shown as the percentage of completed work items.
Formula:
Completed / Committed * 100
Where Completed and Committed values are the same as in Velocity.
The completion rate can exceed 100% if more work is completed than originally committed.
Completed
This represents the amount of work completed during the sprint, and measured depending on the board’s chosen estimation method: Story Points, Original Time Estimate, or Work Item Count.
Formula: Completed / Committed * 100
Where:
-
Completed is the total estimation value of work items in any status except the final one on the board when the sprint ended.
-
Committed is the total work the team took on at the start of the sprint (same as in Velocity).
This is shown as a percentage, which can be more than 100% if more work is completed than initially planned.
Incompleted
This represents the work that was not completed during the sprint, excluding the final status on the board.
Formula: Incompleted / Committed * 100
Where:
-
Incompleted refers to the work items that were not finished by the end of the sprint.
This is also shown as a percentage.
Carryover
This represents the amount of work that was incomplete and moved to the next sprint, which is also shown as a percentage. These are work items that weren’t finished by the end of the sprint and were carried over to:
-
A Completed sprint (where the following sprint's completion date is later than the selected sprint’s date).
-
An Active sprint (where the selected sprint’s completion date is later than the selected sprint’s date).
Formula: Carryover / Committed * 100
Usually, Incomplete equals Carryover, except in cases where the team decides not to continue a task.
Section #5 - Committed
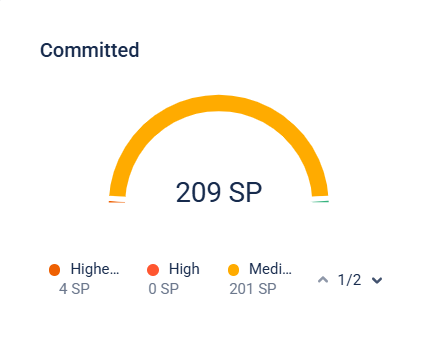
This represents the amount of work the team takes on at the beginning of the sprint, distributed by work item priority. This is measured using three methods, depending on the board's chosen estimation method: Story Points, Original Time Estimate, or Work Item Count.
The chart shows the total estimation value of work items that were present at the start of the sprint (in any status except the final one on the board). The work is divided based on each work item’s priority level.
Section #6 - Completed
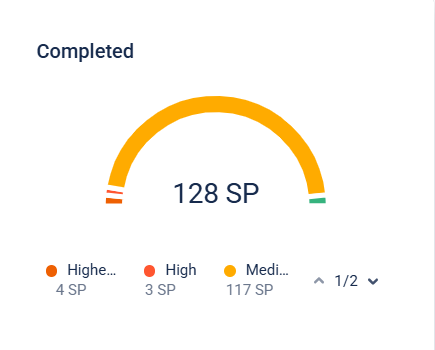
This represents the amount of work completed during the sprint, distributed by work item priority. This is measured using three methods, depending on the board’s chosen estimation method: Story Points, Original Time Estimate, or work item Count.
The chart shows the total estimation value of work items that were in the final status on the board at the completion date of the sprint. The work is divided based on each work item's priority level.
Section #7 - Scope change
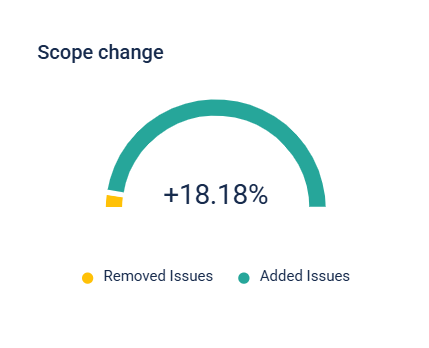
This represents the amount of change to the original sprint scope, shown as a pie chart.
The chart is divided into two slices:
-
One for added work
-
One for removed work
The size of each slice reflects the amount of work that was added or removed during the sprint.
This is measured using three methods, depending on the board’s chosen estimation method: Story Points, Original Time Estimate, or Work Item Count.
Formula: (Added - Removed) / Committed * 100
Committed
This is the amount of work the team takes on at the start of the sprint. It represents the total estimation value of work items that were present at the start of the selected sprint in any status except the final one on the board (same as in Velocity).
Added
This is the amount of work added to the sprint after it has started. It represents the total estimation value of work items added to the sprint between the sprint’s start and completion dates.
Removed
This is the amount of work removed from the sprint after it has started. It represents the total estimation value of work items removed from the sprint between the sprint’s start and completion dates.
If you need help or want to ask questions, please contact SaaSJet Support or email us at support@saasjet.atlassian.net
Haven’t worked with the add-on yet? Give it a try