Track your SLA
Monitor tasks fulfillment and work items statuses according to the data at the grid table which contains a set of data that is structured in rows and columns.
You can sort the data by Type, Key, Summary, Assignee, Status in ascending or descending order.

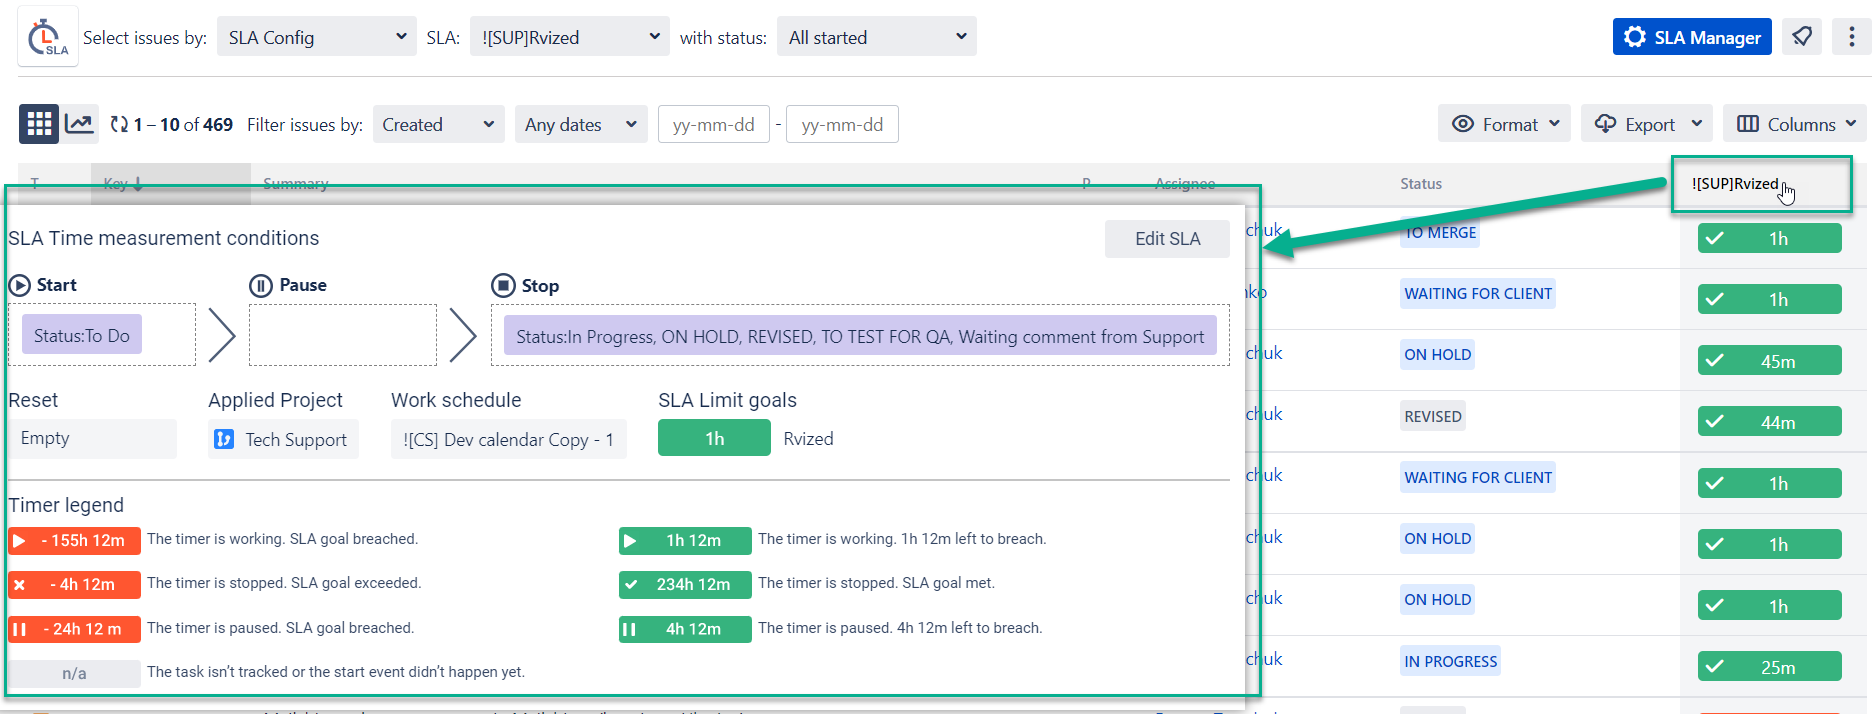
If you click the SLA Name at the right corner (at the top of the grid table), you can see detailed information about the SLA measurement conditions.
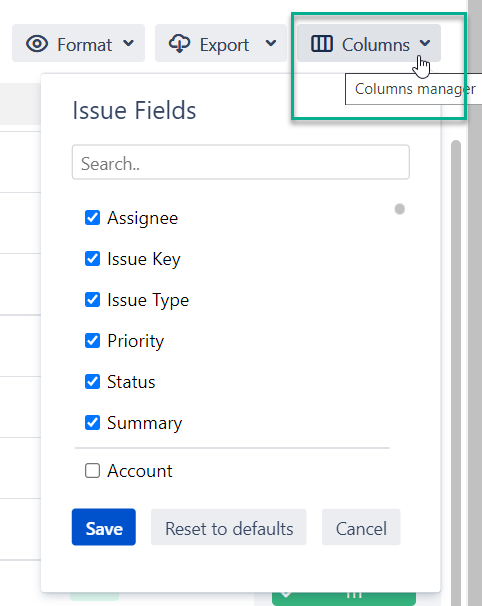
Organize columns, add new columns if needed.
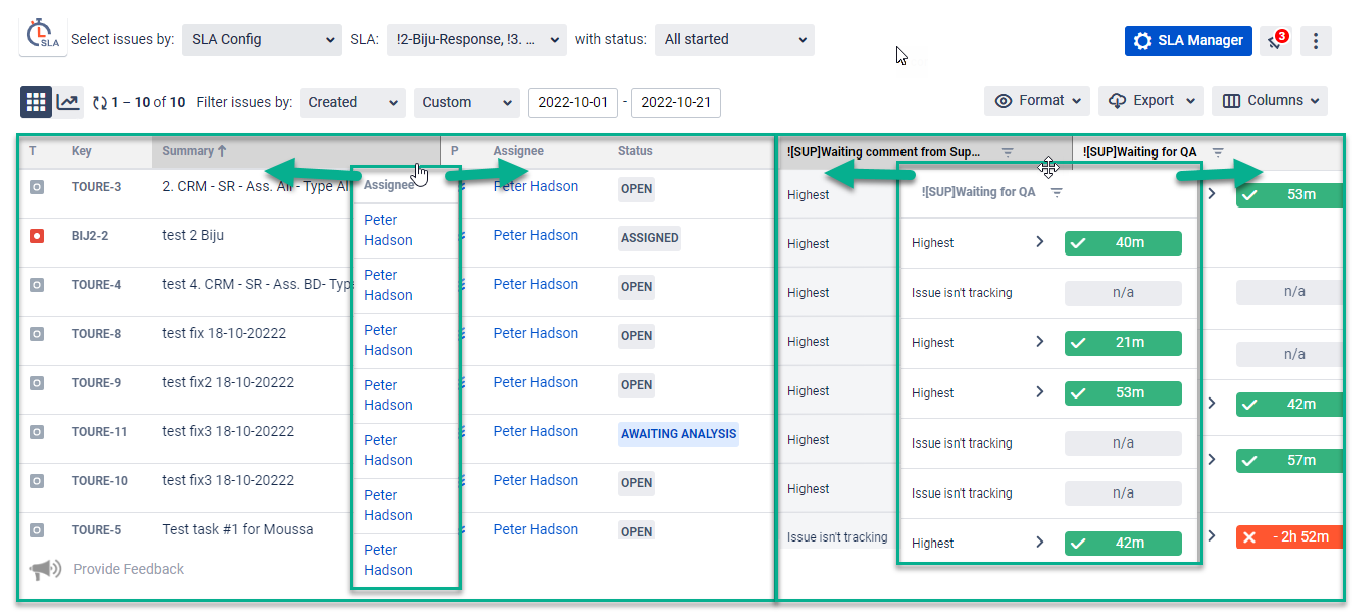
Move any columns to the right/left to see data in the necessary order. Native Jira columns in the left part of the table and SLA configurations in the right part.
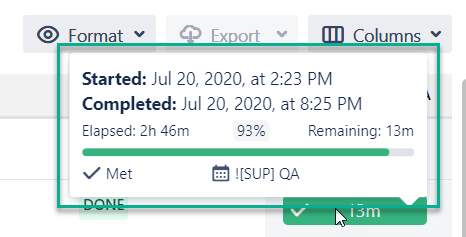
You can see Enhanced/Elapsed time hints (for SLA timers and on column hover) with:
start and target dates;
demonstration of data on the percentage of completion SLA to the target date, elapsed and remaining time;
SLA status;
type of the Calendar used to calculate time.
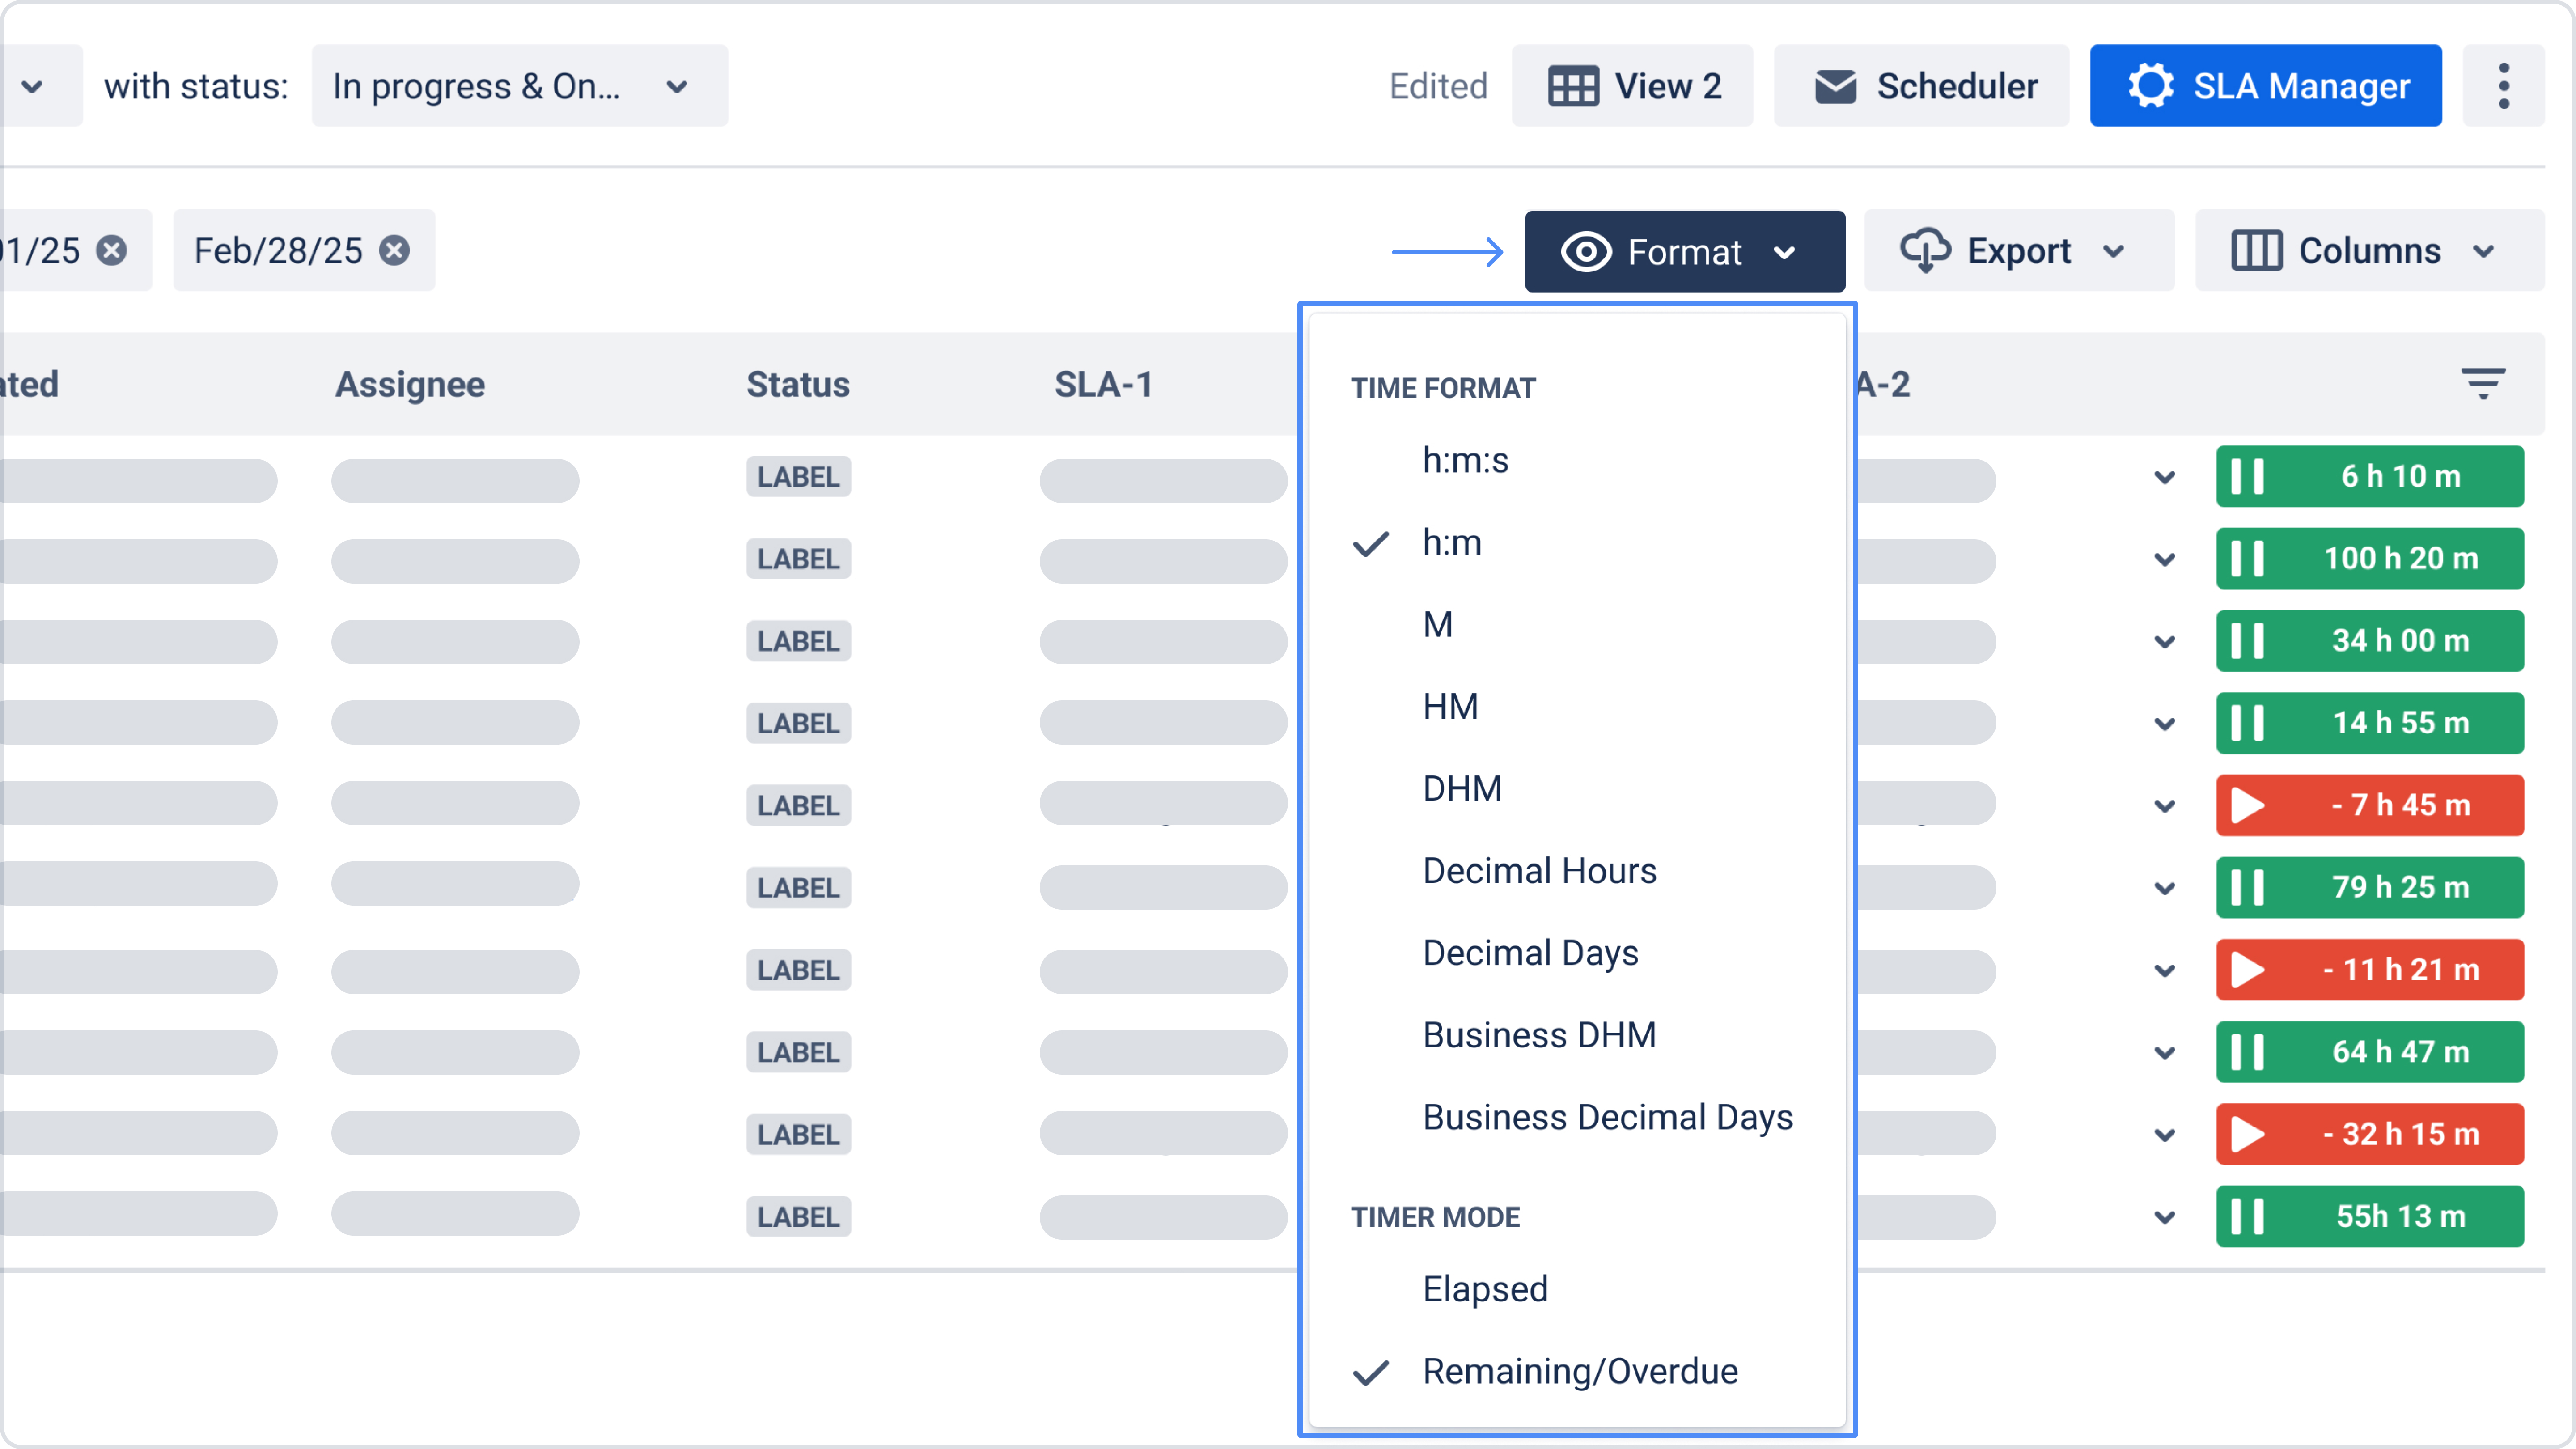
You can set the preferred time display format in the Format menu:
Time Format options:
h:m:s
h:m
M
HM (Hours Minutes)
DHM
Decimal Hours
Decimal Days
Business DHM
Business Decimal Days
Timer Mode options:
Remaining/Overdue – shows how much time is left before the SLA goal is reached (default).
Elapsed – shows how much time has already passed since the SLA started.
Switching to Elapsed also affects how SLA time is displayed in the SLA panel inside the work item. This setting applies only to the current user.
Also, you can prepare a report based on this data.
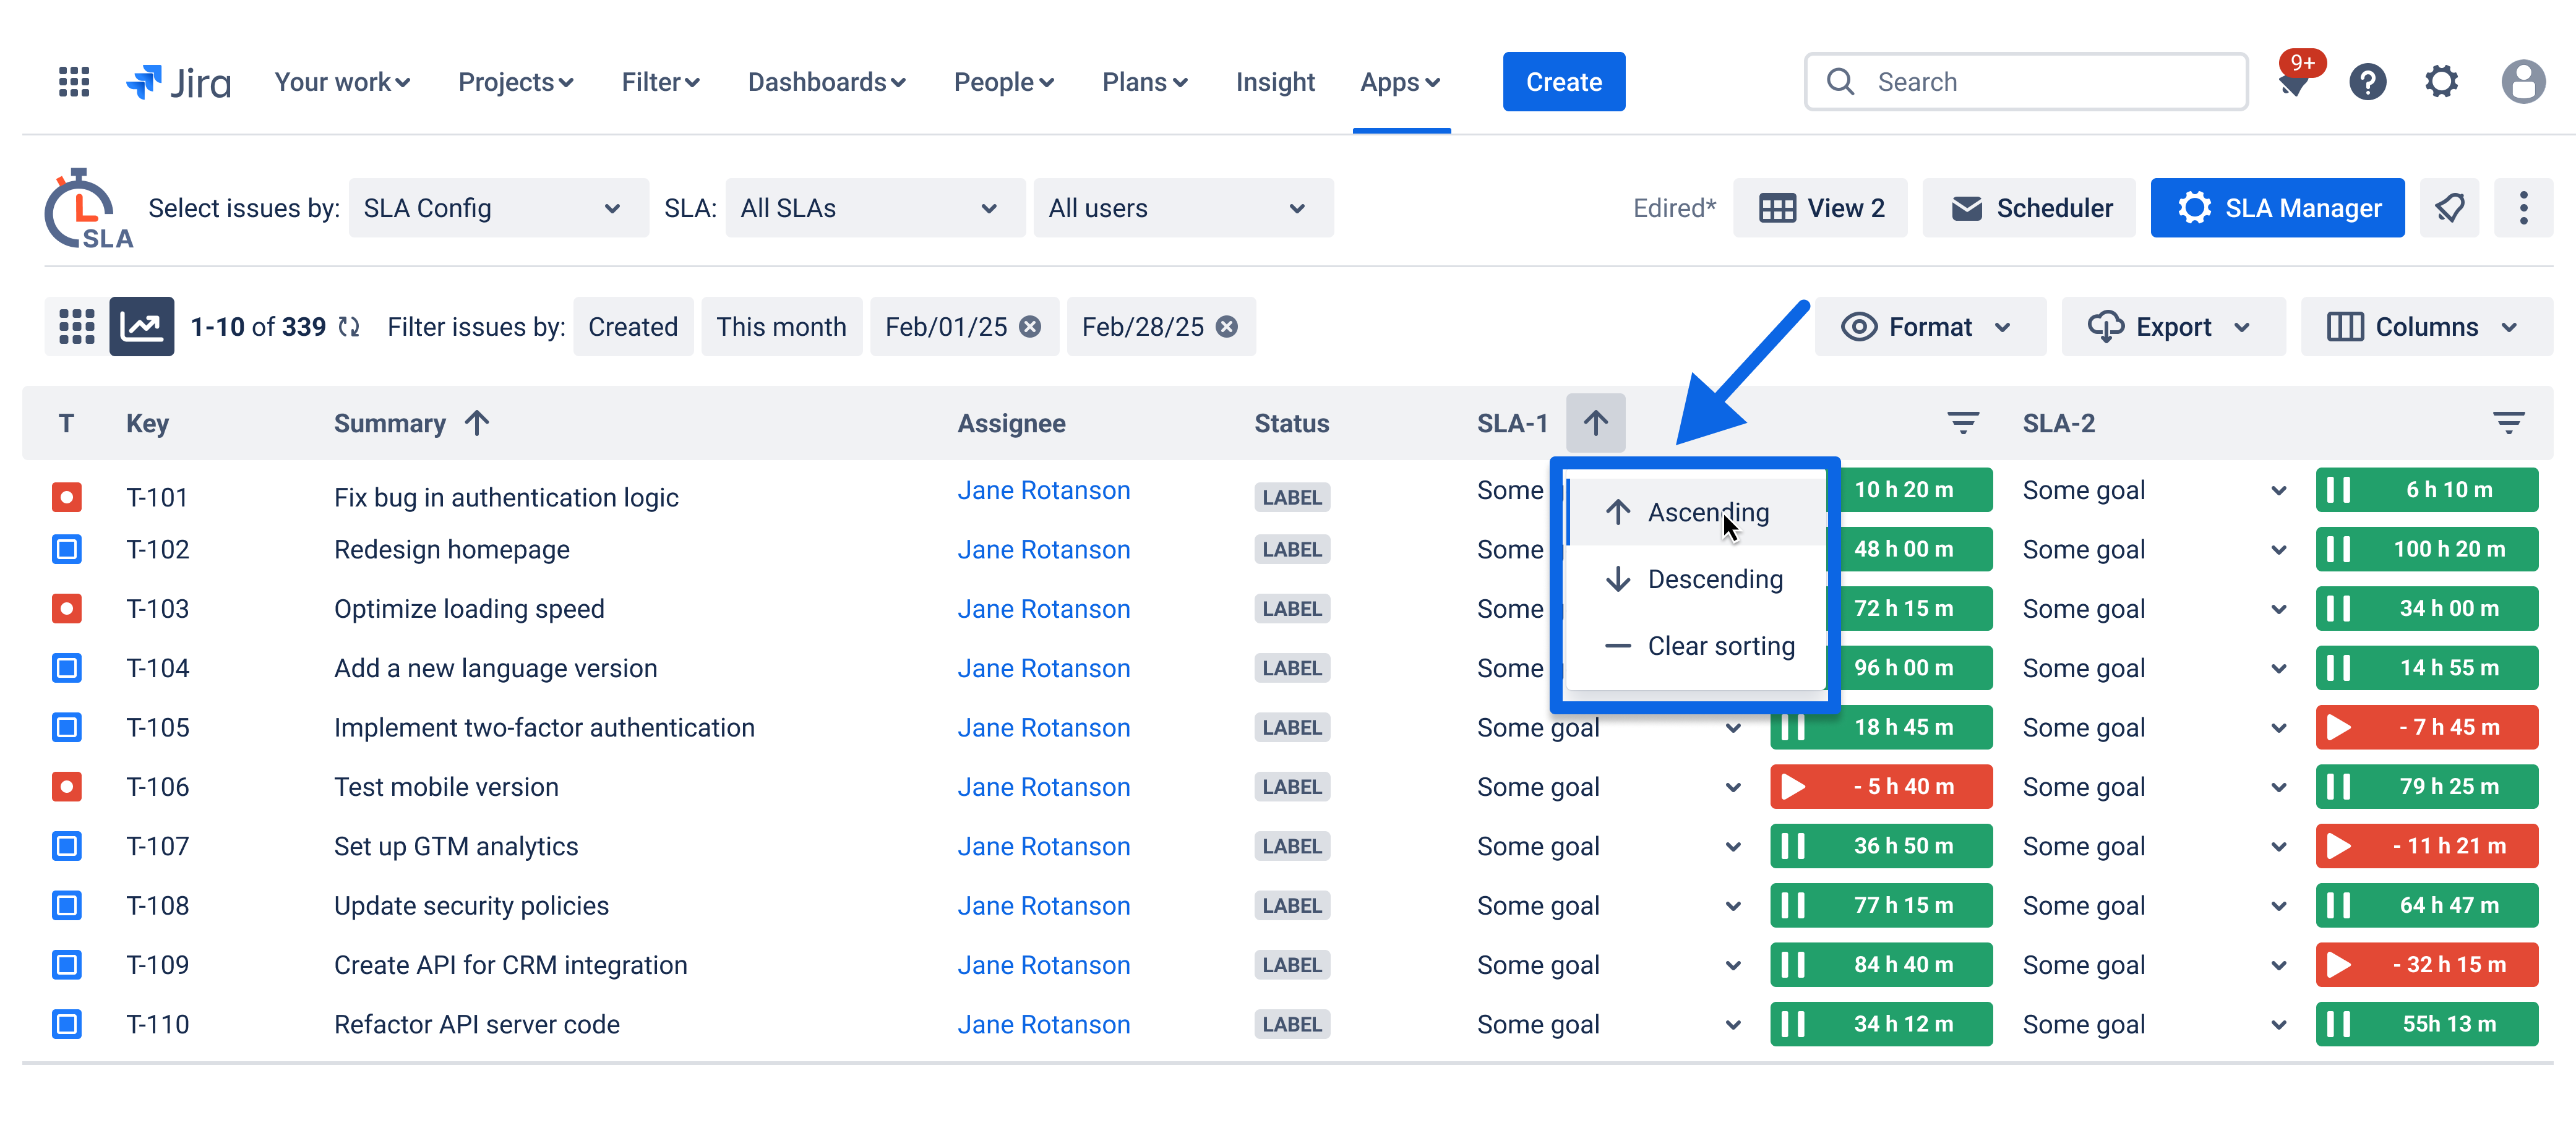
How to Sort SLA in Grid View:
You can sort work items by SLA time to easily identify which ones are the most overdue or closest to breach. This helps you prioritize tasks and respond faster.
Two sorting options are available:
Ascending (From Met to Exceeded) – work items with SLA time closest to breach appear at the top.
Descending (From Exceeded to Met) – work items with the most exceeded time appear first.
Click the sort icon in the SLA column to choose the sorting method.
To reset the sorting and return to the default order, click Clear sorting in the dropdown.
Sorting works based on the absolute time value of the SLA (remaining or overdue), regardless of whether the SLA column is visible.
Related use case article: How to prepare the SLA Time and Report Gadget using native Jira Gadgets
If you need help or want to ask questions, please contact us through SaaSJet Support or via email support@saasjet.atlassian.net
Haven't used this add-on yet, then try it now!