SLA Time and Report provides flexible reporting capabilities that help teams understand how SLAs perform in real workflows, track compliance over time, and support operational and management decisions directly in Jira.
This section offers a high-level overview of the available reporting options. Each report focuses on a different aspect of SLA analysis – from detailed, work-item-level insights to visual charts and automated exports for sharing and compliance.
Available SLA reports
1. SLA Grid Report
The SLA Grid is the main reporting view and the starting point for detailed SLA analysis. It presents SLA goals for work items in a structured table format, allowing teams to see how each SLA behaves on a per-issue level.
Using the SLA Grid, you can review SLA status, elapsed and remaining time, target dates, and other SLA-related details in one place. The grid can be customized to show only the data that matters for your analysis, making it easier to focus on specific SLAs, projects, or time periods. This view is commonly used for operational reviews, troubleshooting SLA issues, and preparing detailed reports for audits or internal analysis.
.png?cb=31691094d20d9743ba52f407f9b6b450)
Explore the SLA Grid view and see how to work with it on this page – SLA Grid Report
2. SLA Chart Reports
SLA Chart Reports provide visual insights into SLA performance over time and help teams understand how SLAs behave across different scenarios and workflows. These charts are especially useful for identifying long-term trends, comparing multiple SLAs, and evaluating SLA compliance from different angles.
.jpg?cb=d95df942fabe7e57d79be8ea1c4a110e)
Depending on the analysis goal, SLA Chart Reports allow you to review SLA data using several perspectives, including:
-
SLA Success Rate (Performance Comparison) – compares the percentage of met SLAs across selected SLA configurations within a chosen date range.
-
Met vs Exceeded – shows how many SLAs were met or exceeded, helping assess overall SLA compliance.
-
Met vs Exceeded per Criteria – breaks SLA results down by selected Jira fields or custom criteria, such as severity, assignee, project, labels, etc.
-
SLA Pie Charts – display the distribution of SLA statuses (Met, Exceeded, In Progress) in a clear circular view for quick, high-level insight.
Explore all SLA Charts and see how to work with them on this page – SLA Chart Reports
3. Export
All reports in Chart and Table views are available for export. Dive deeply into analysis for better business decisions.
A table report you can export as XLSX or CSV files and chart reports in PNG, JPEG, PDF, or SVG formats.
In the Export configuration window, you can select columns for Export files.
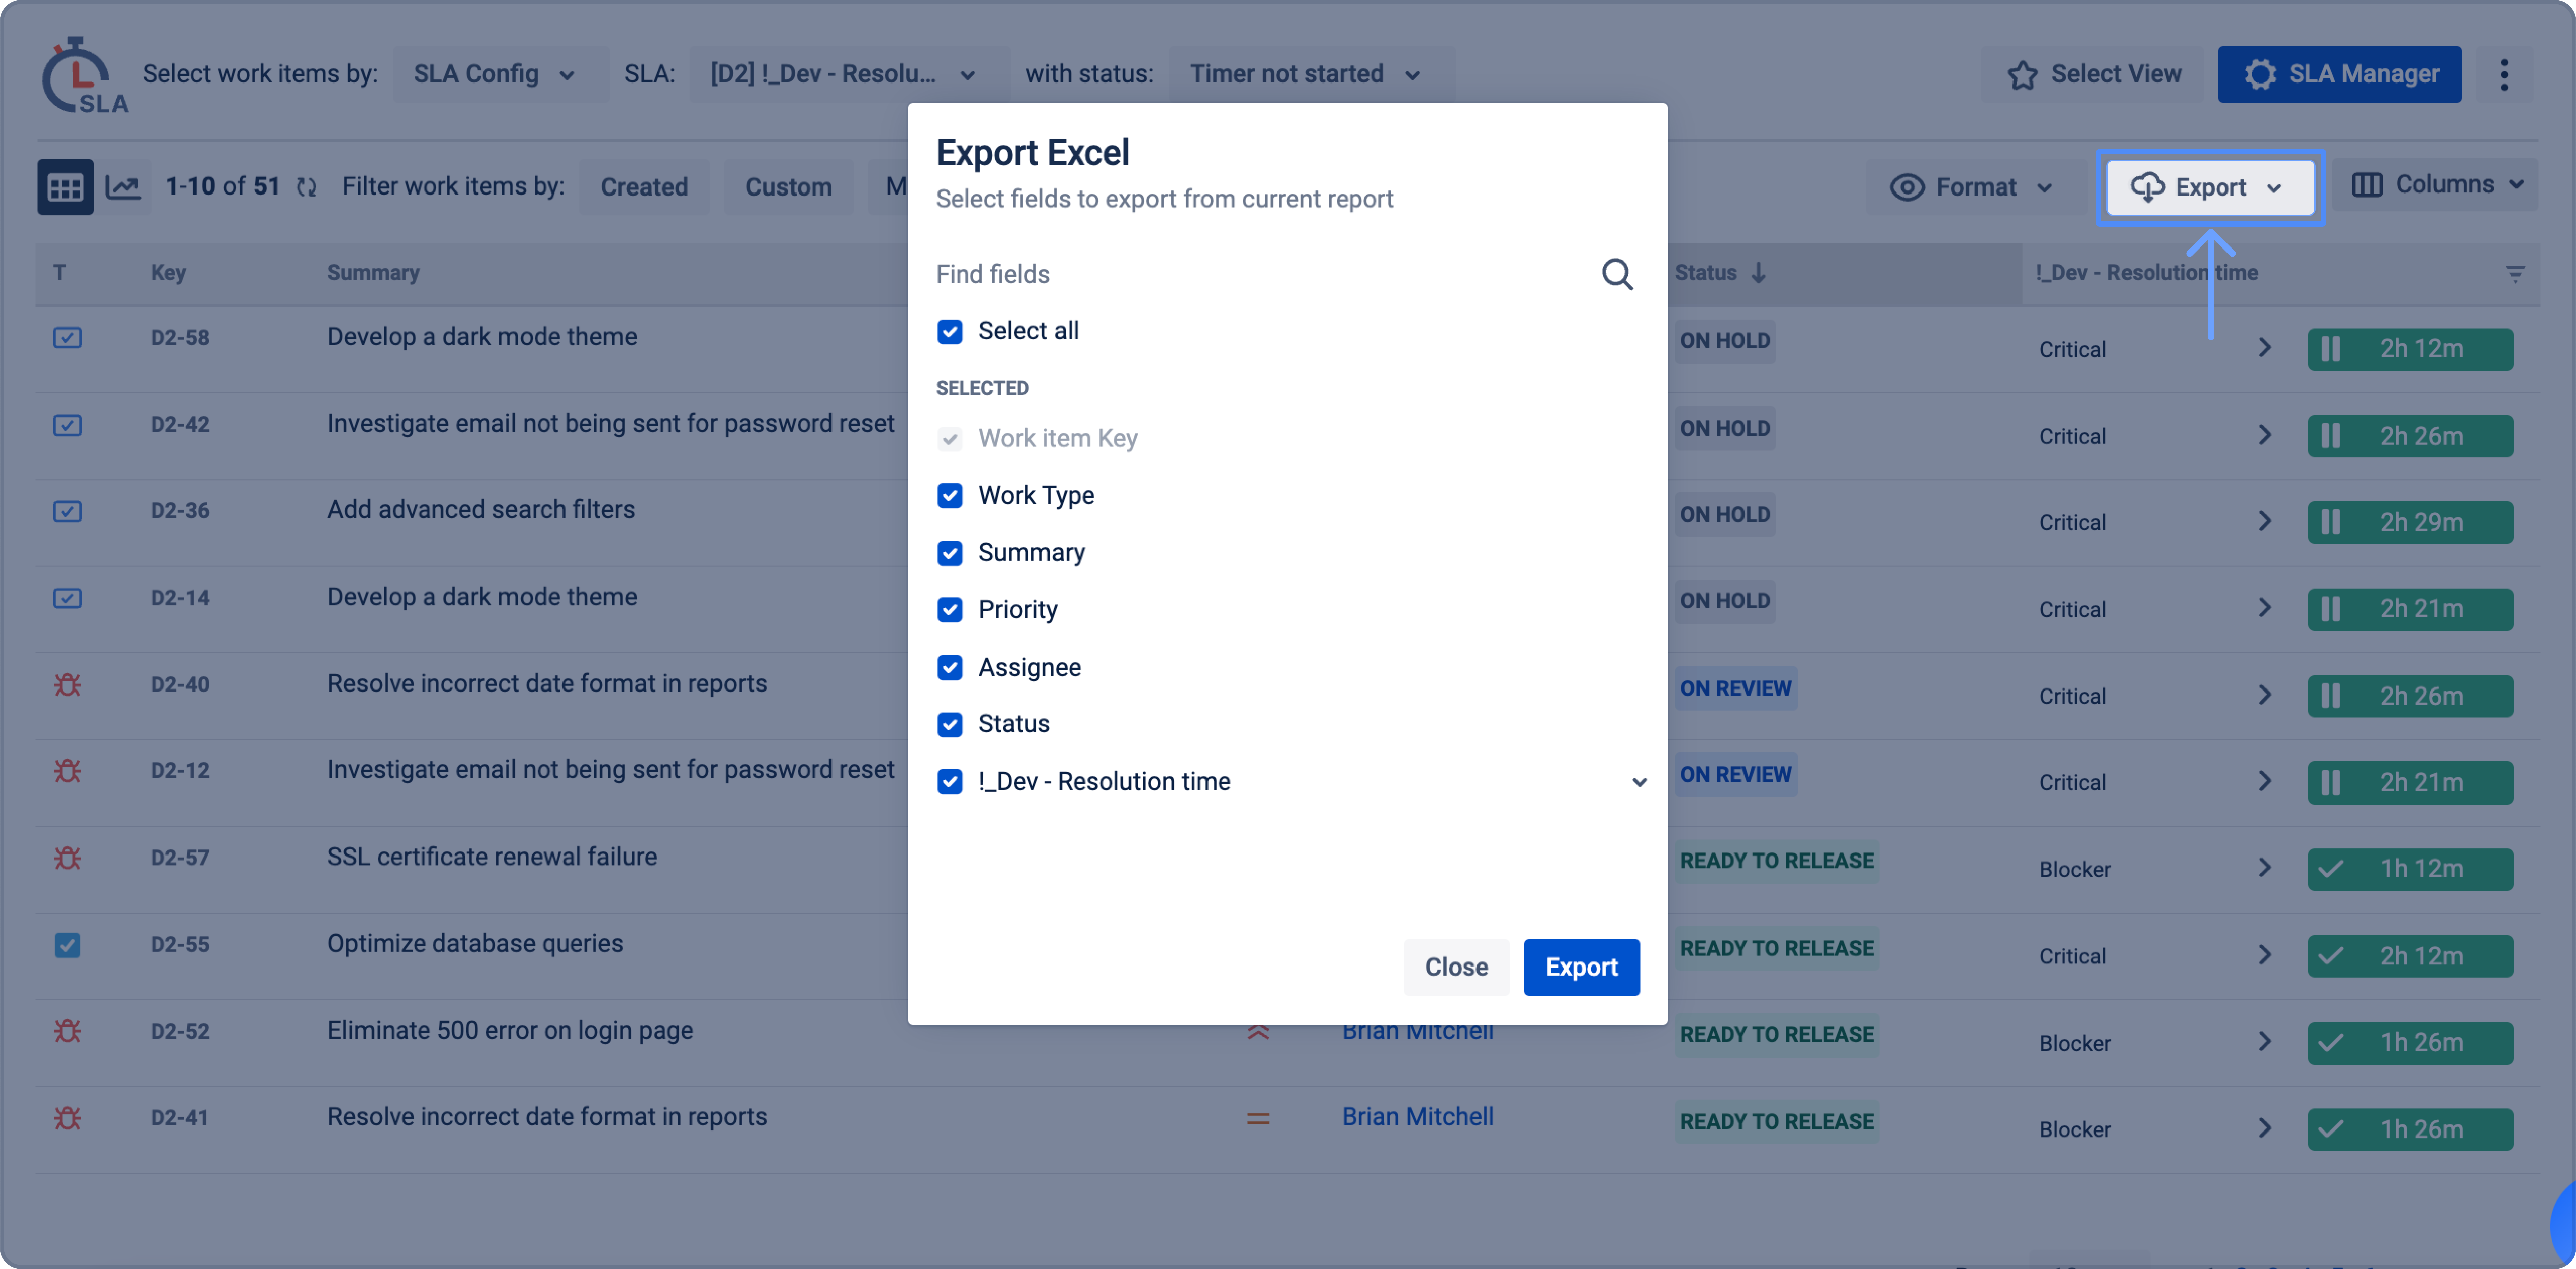
Read more about Export in our documentation – Export SLA reports
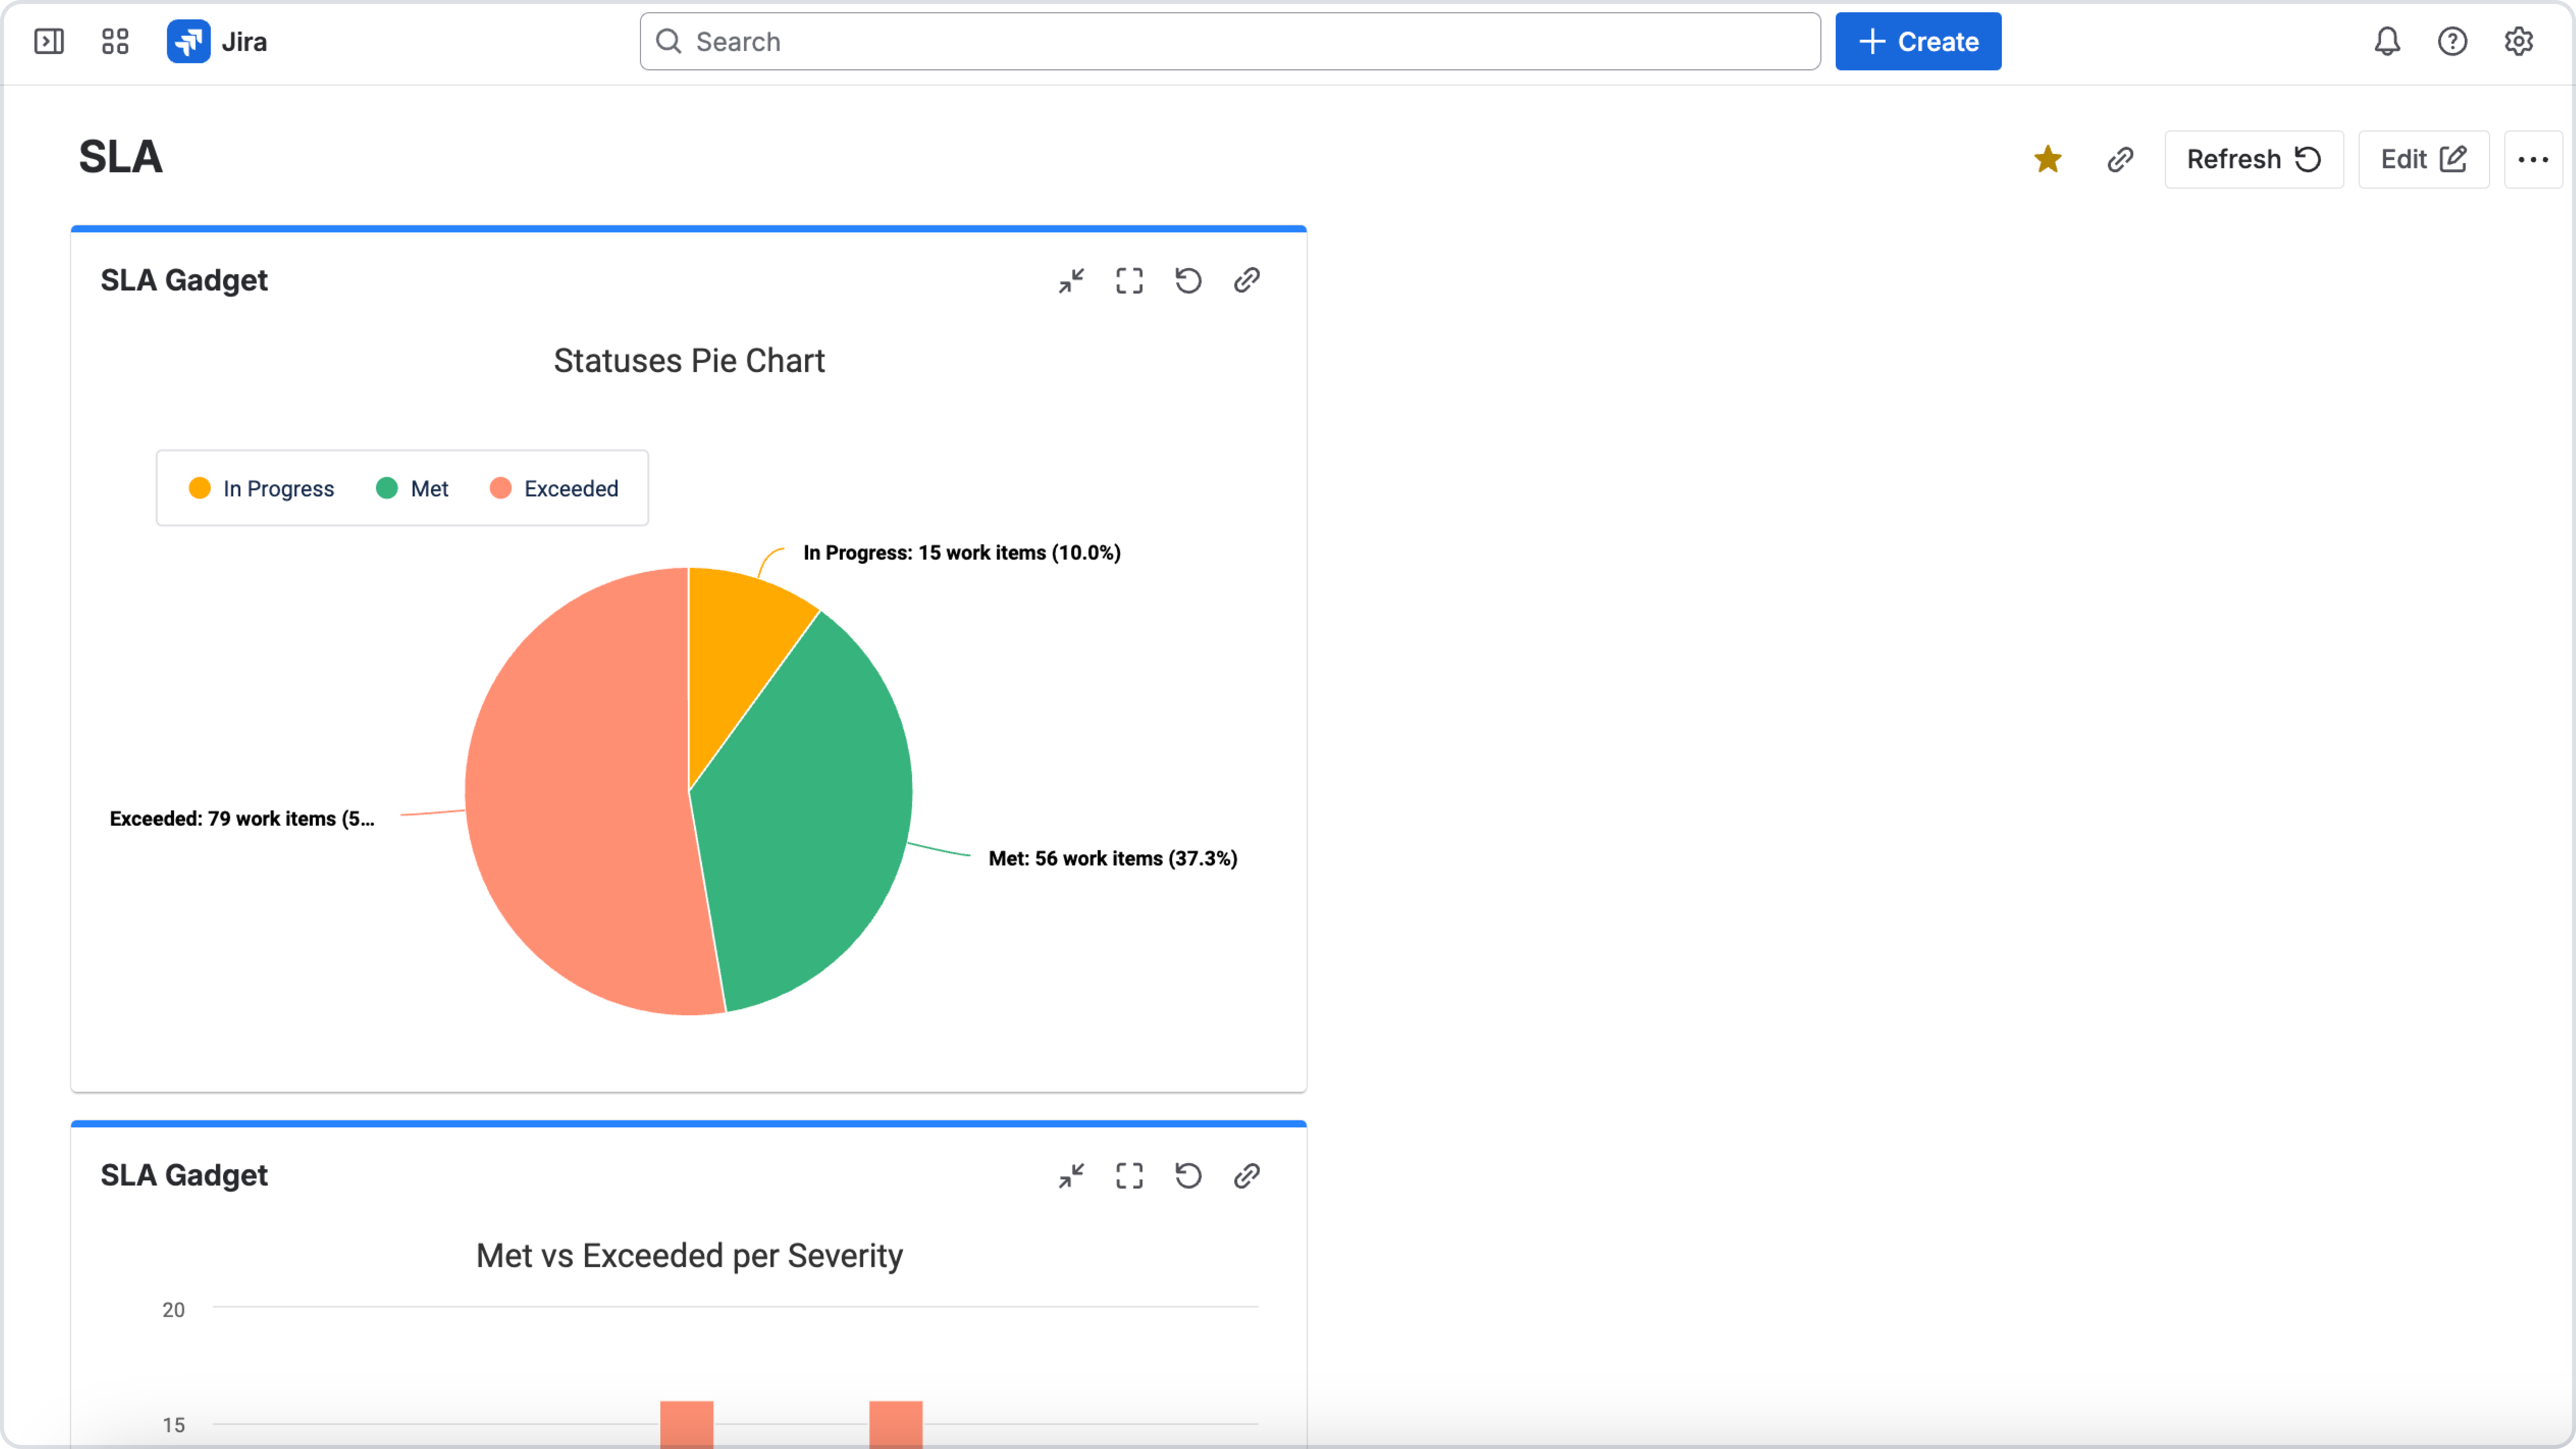
4. SLA Gadgets on Jira Dashboards
SLA charts can be added to Jira Dashboards as SLA gadgets, allowing teams to monitor SLA performance continuously without opening individual reports.
Using SLA gadgets on dashboards makes it easy to keep key SLA metrics visible in day-to-day work.
This approach is especially useful for team leads and managers who need a quick overview of SLA performance, as well as for recurring reviews and stakeholder reporting.
Learn how to add and configure SLA gadgets on this page – Adding SLA Gadgets
Helpful resources & links