
The Average Time report shows the average amount of time spent in each status.
-
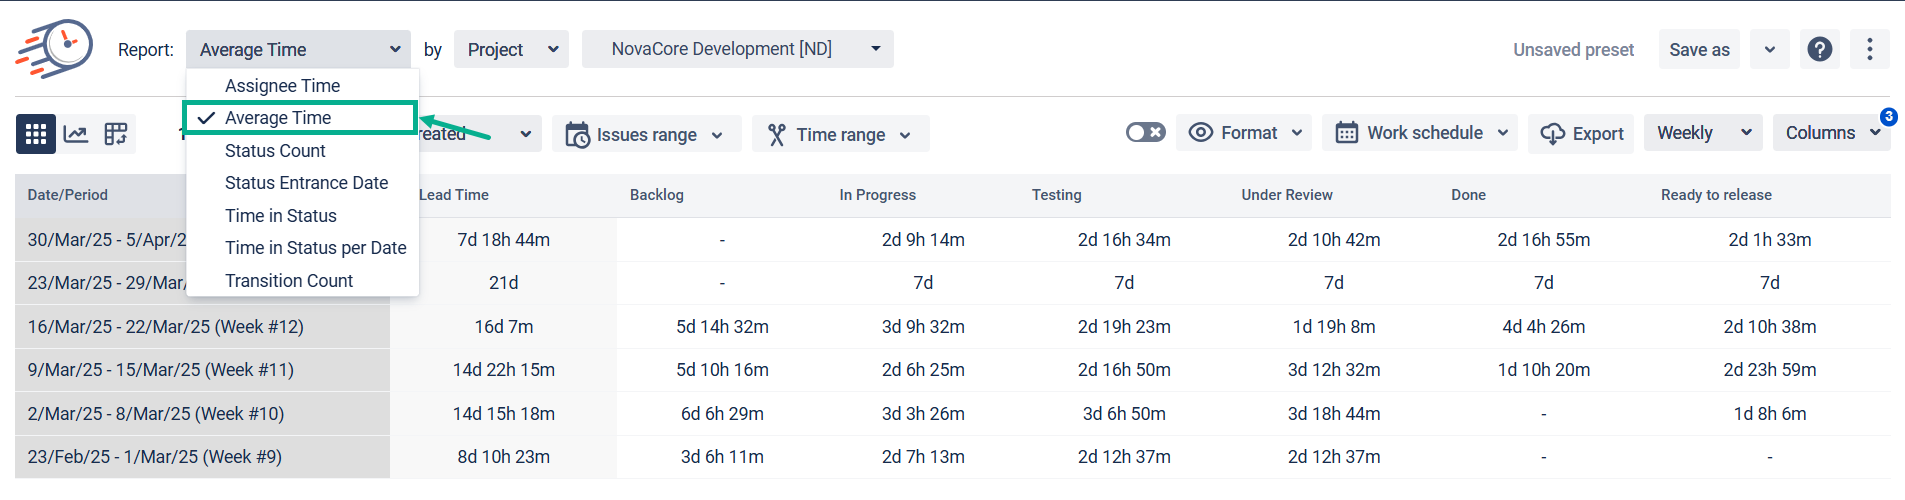
Choose the Average time report;
-
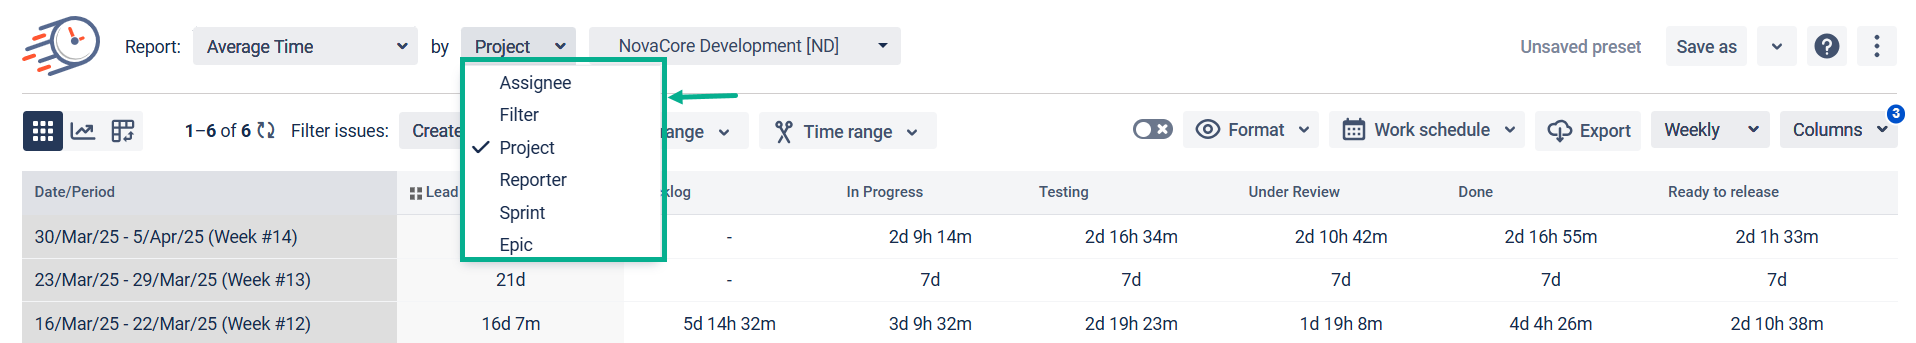
Filter by the category you need;
-
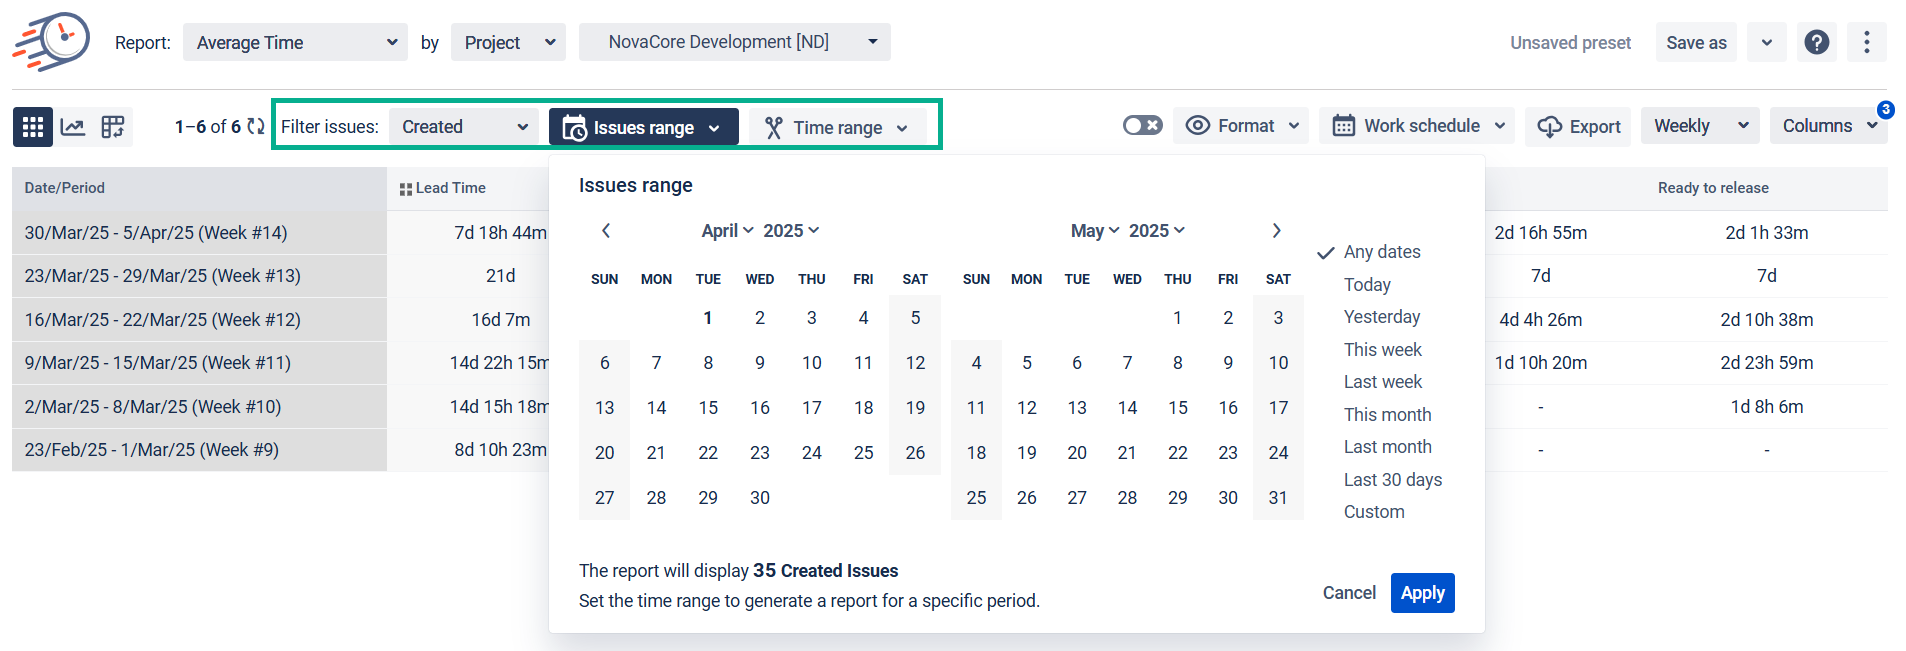
Choose the issues and date ranges for the data calculation;
-
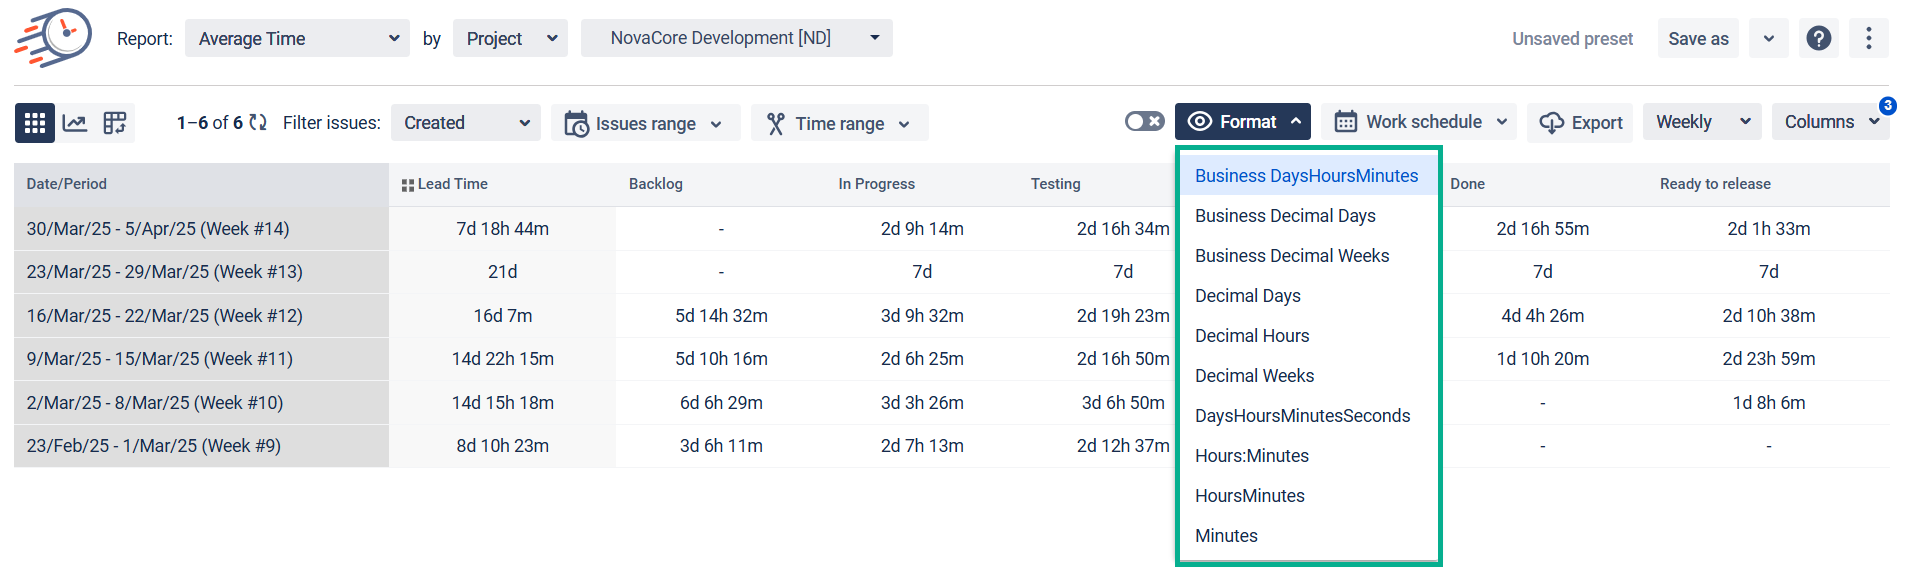
Choose the time format type that will be represented on the grid;
-
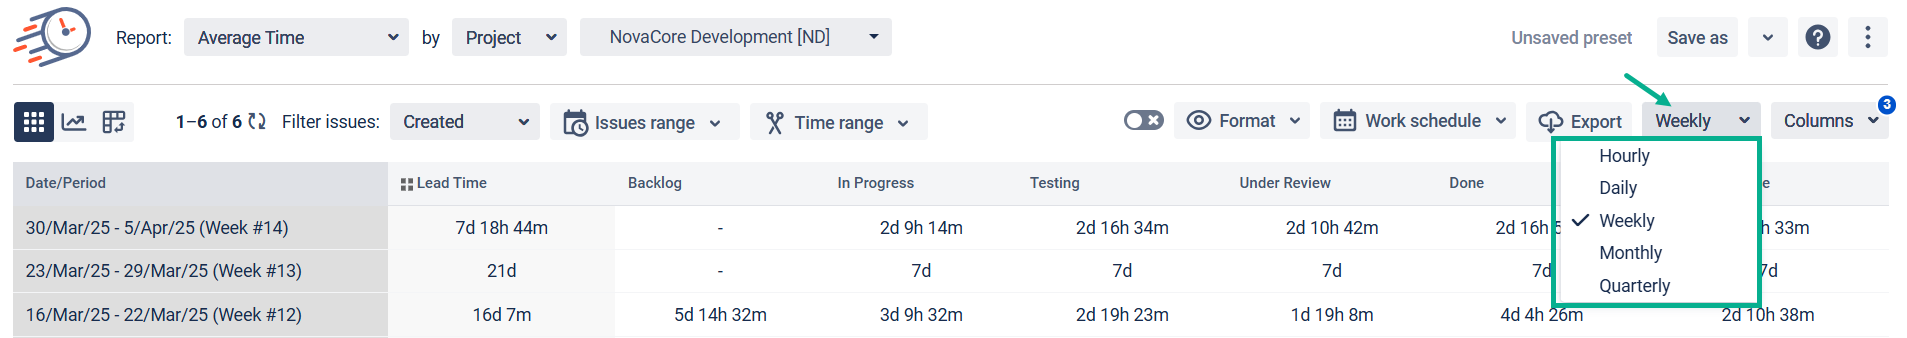
Select the period for which you want to calculate the average value for each status.
-
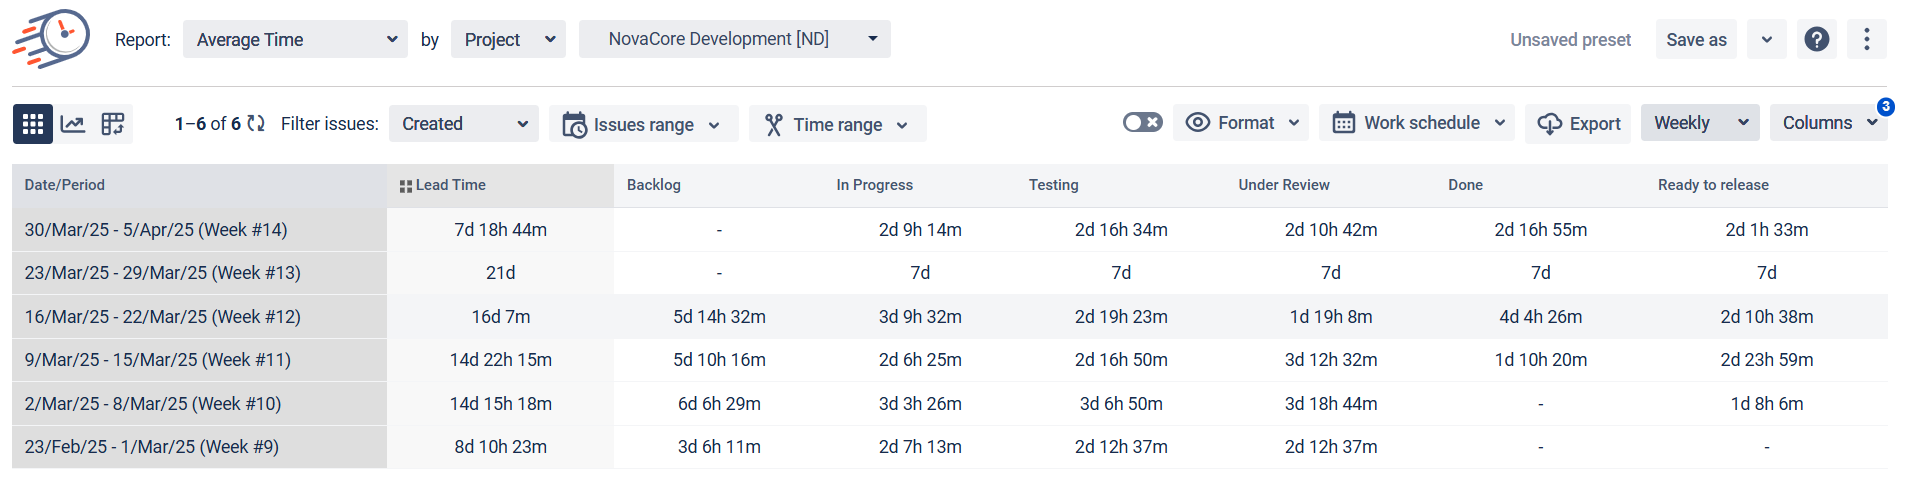
Get all the data on the grid as shown below.
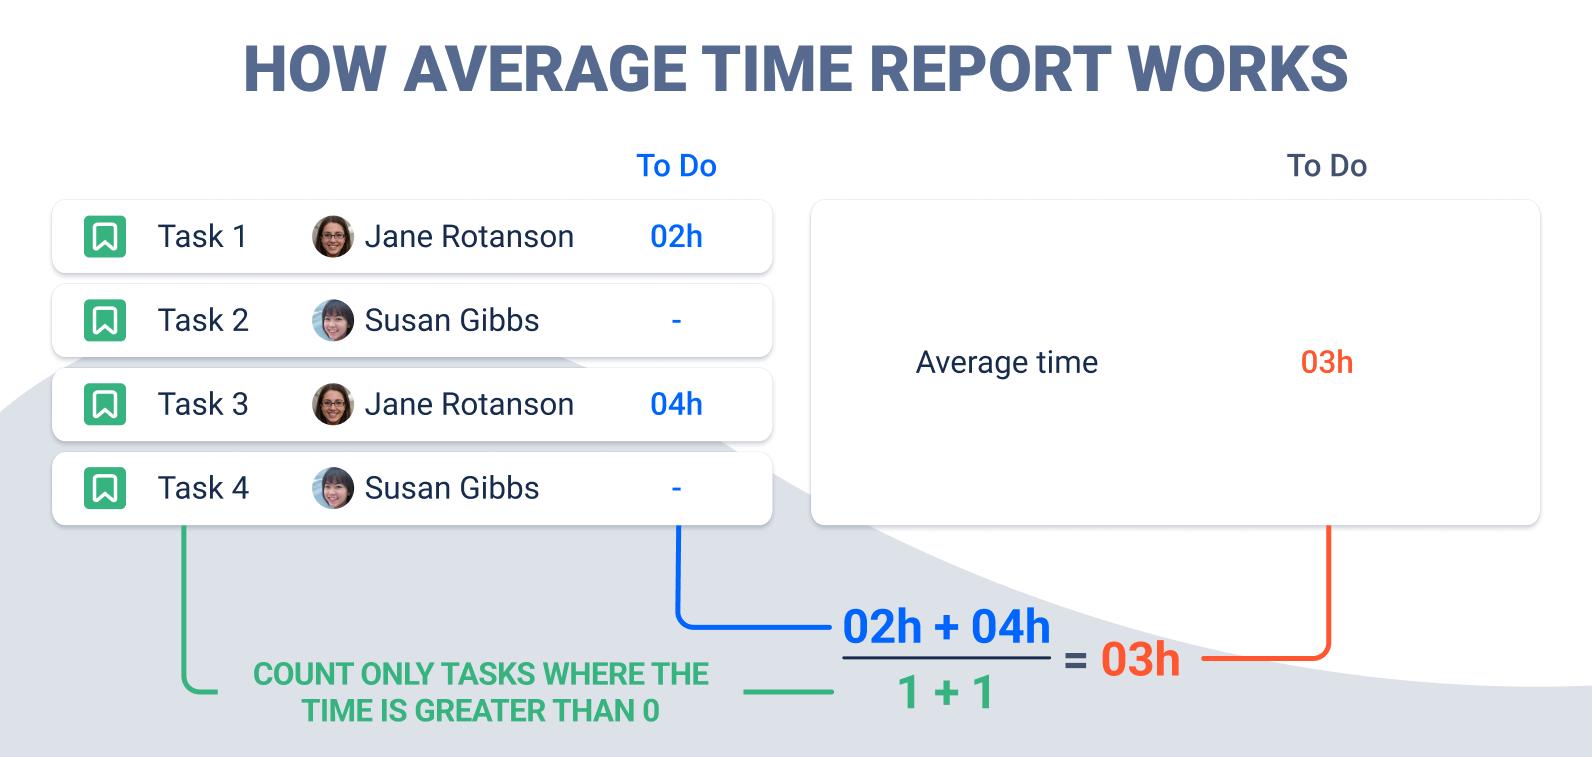
How does the calculation of the Average time occur?
The picture shows the logic of calculating the Average time.
-
We count the number of tasks that have been in a particular status (To-Do status in this case) (green line),
-
Then, sum the time of these tasks (blue line). We take into account only those tasks that have been in the status.
-
Divide the total time by the number of tasks. (1/2)
This is how the calculation of each value on the grid is occurring.
If you need help or ask questions, please contact SaaSJet Support
Haven’t worked with the add-on yet? Give it a try