Export from Jira to EazyBI Using Time in Status App
Open the Time in Status reporting page.
Filter work item list by the filter you need.
Choose date ranges (start and end dates).
Select your business calendar or create a new one.
Generate the required report. In this example, we will use JQL, but you are free to choose any sample of tasks you need.
Configure the Time in Status report using the JQL query ( including the condition "custom field" is not Empty).CODEproject = "Cloud Software" and "SCRUM TEAM[Dropdown]" is not EMPTY
.png?inst-v=0719a9cd-9e0b-4824-b730-a14ac25382db)
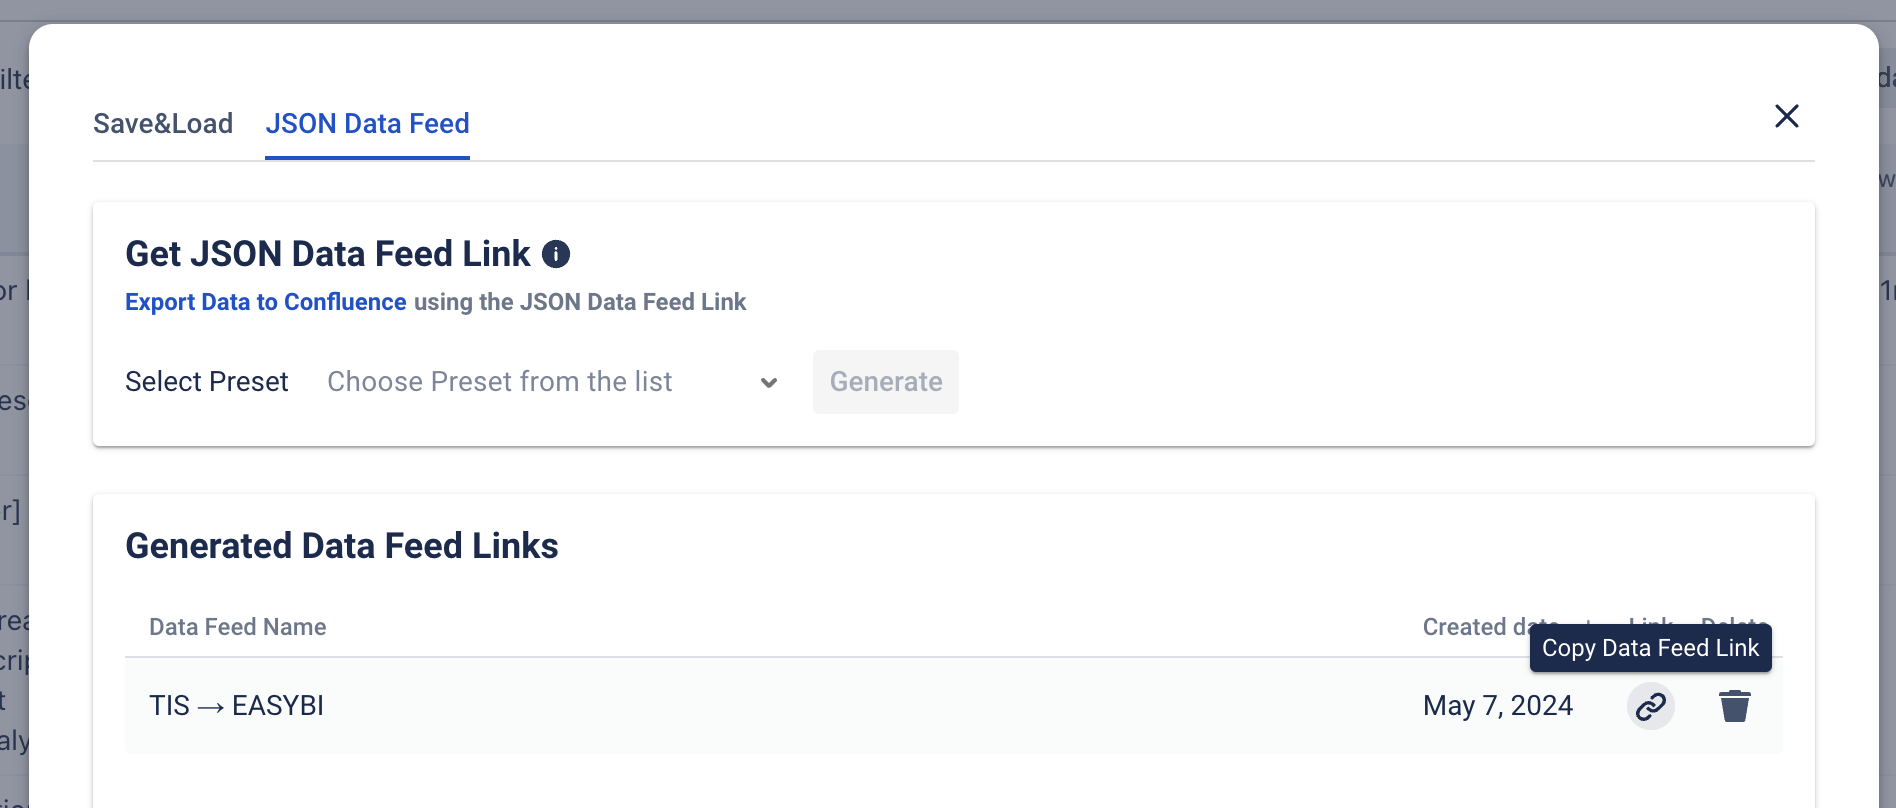
Save a report → generate a JSON link → copy JSON link

Copy JSON link

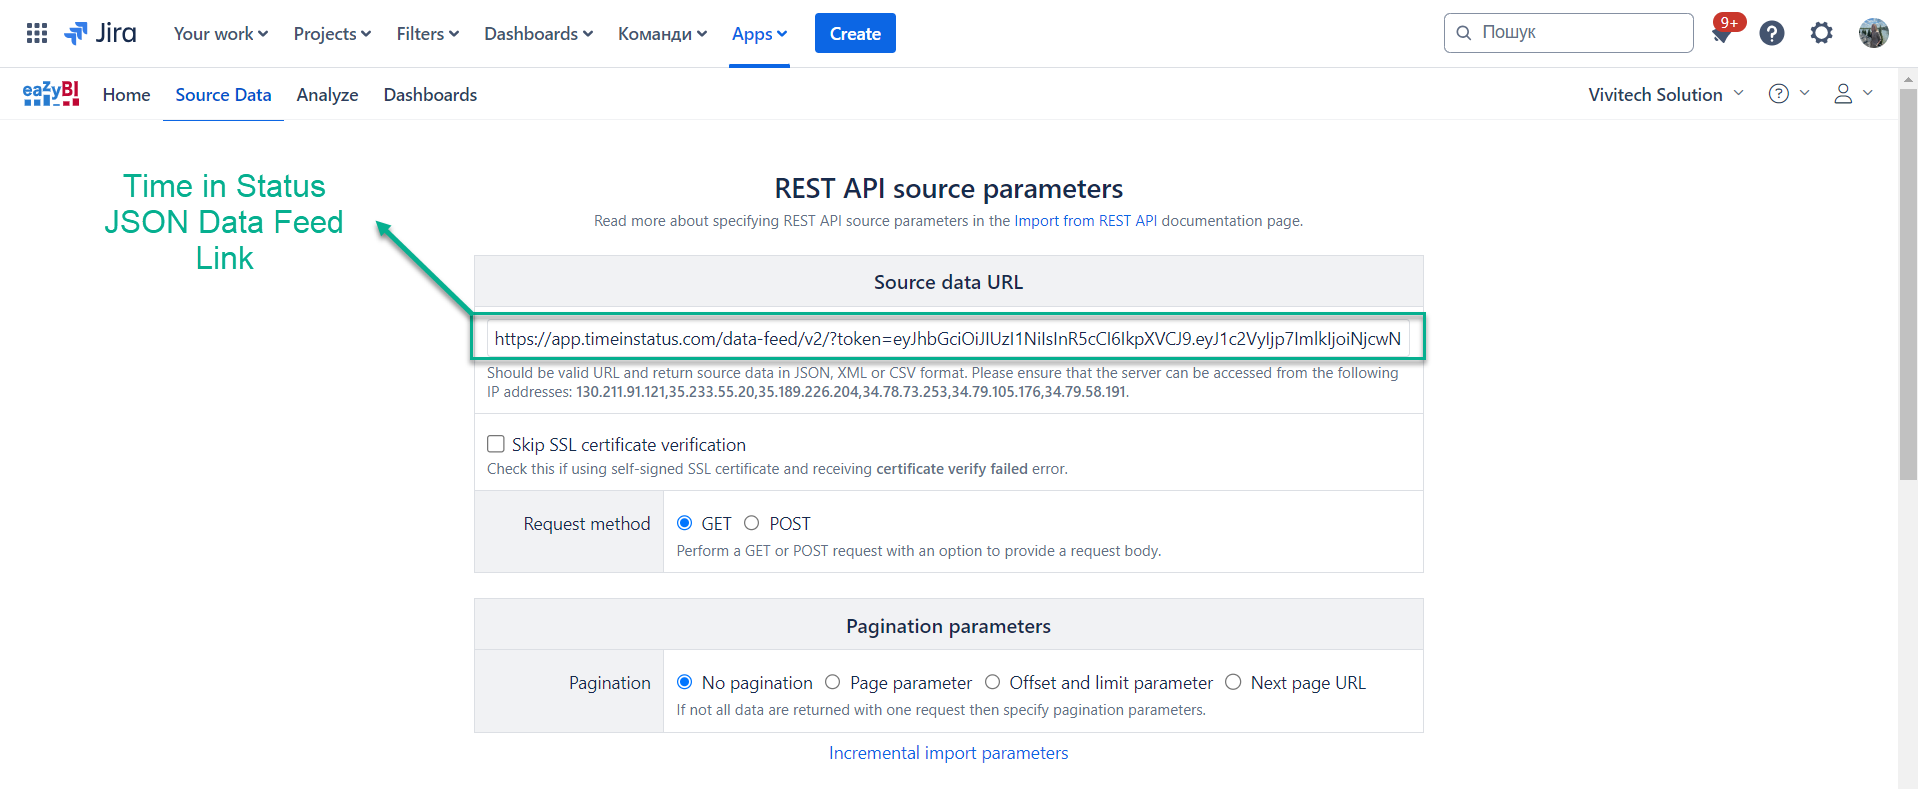
Go to the Eazy BI → Source Data → Add news source app

Select {REST:API} and paste the link into the Source data URL. Click "Continue"

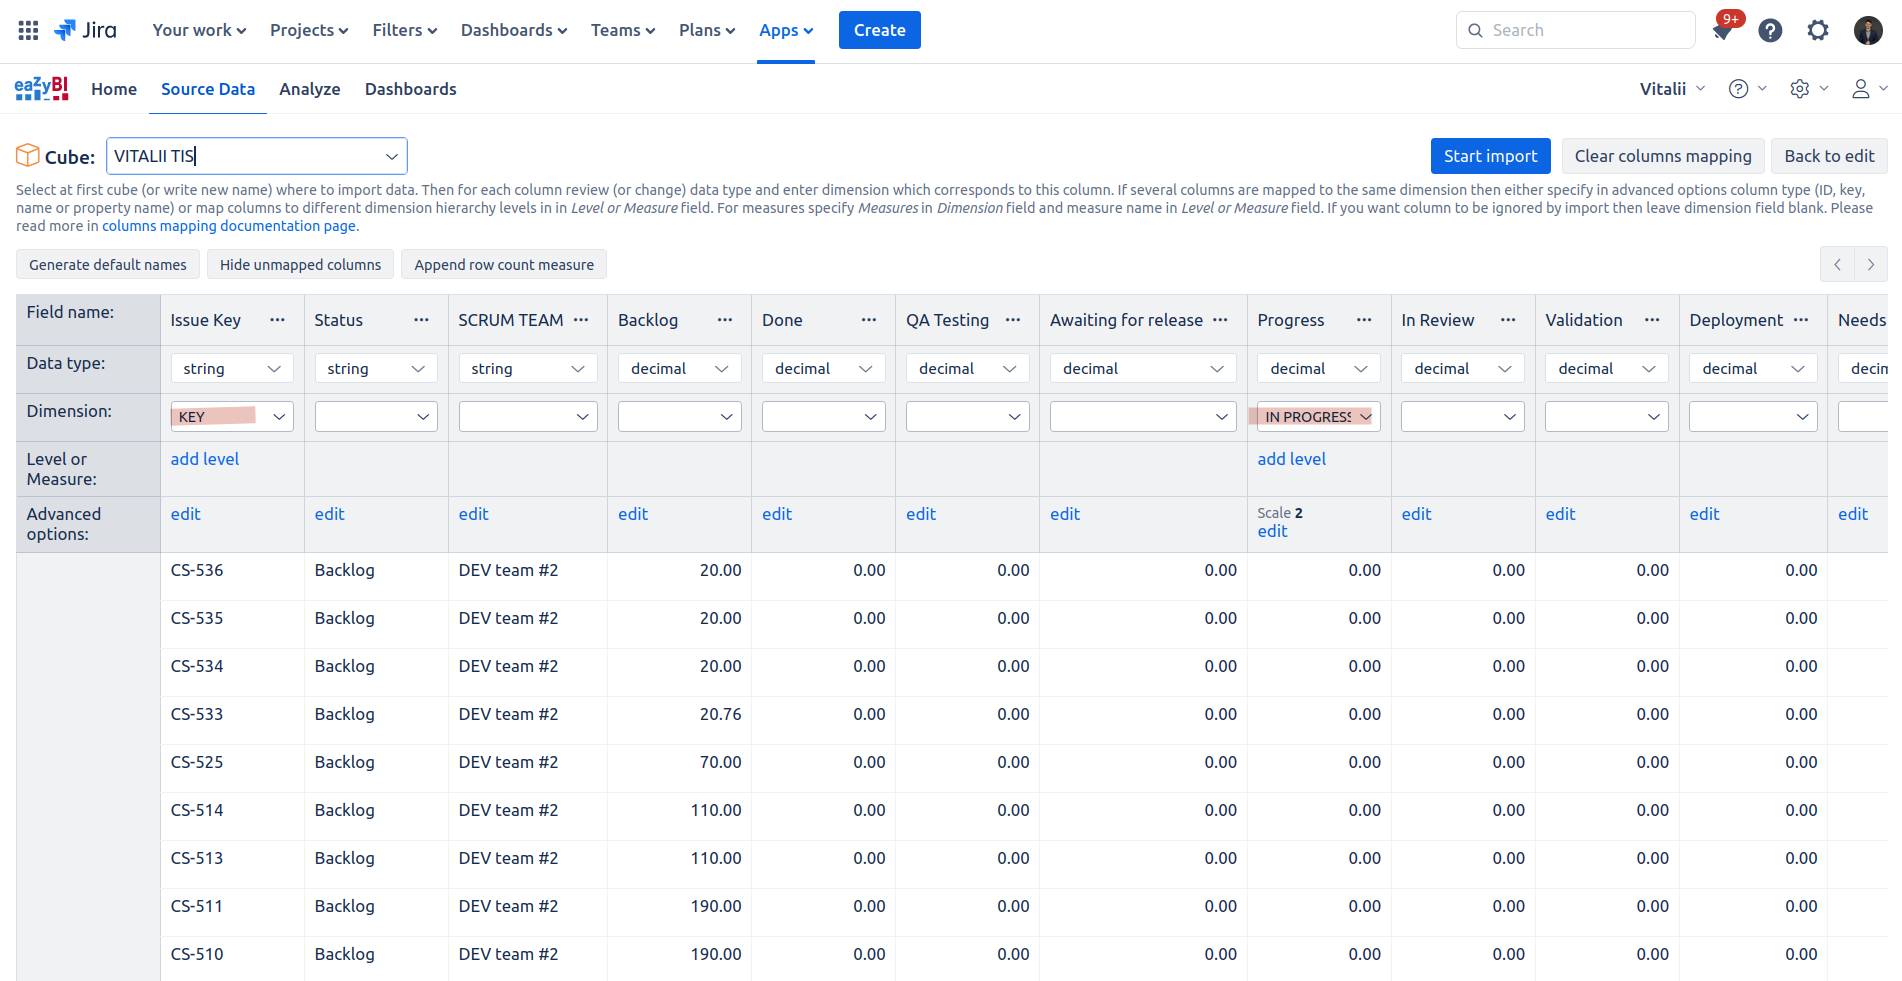
Populate the "Dimension" for the "Work item key" and "In Progress" columns plus "Measure". Click on the "Start Import"

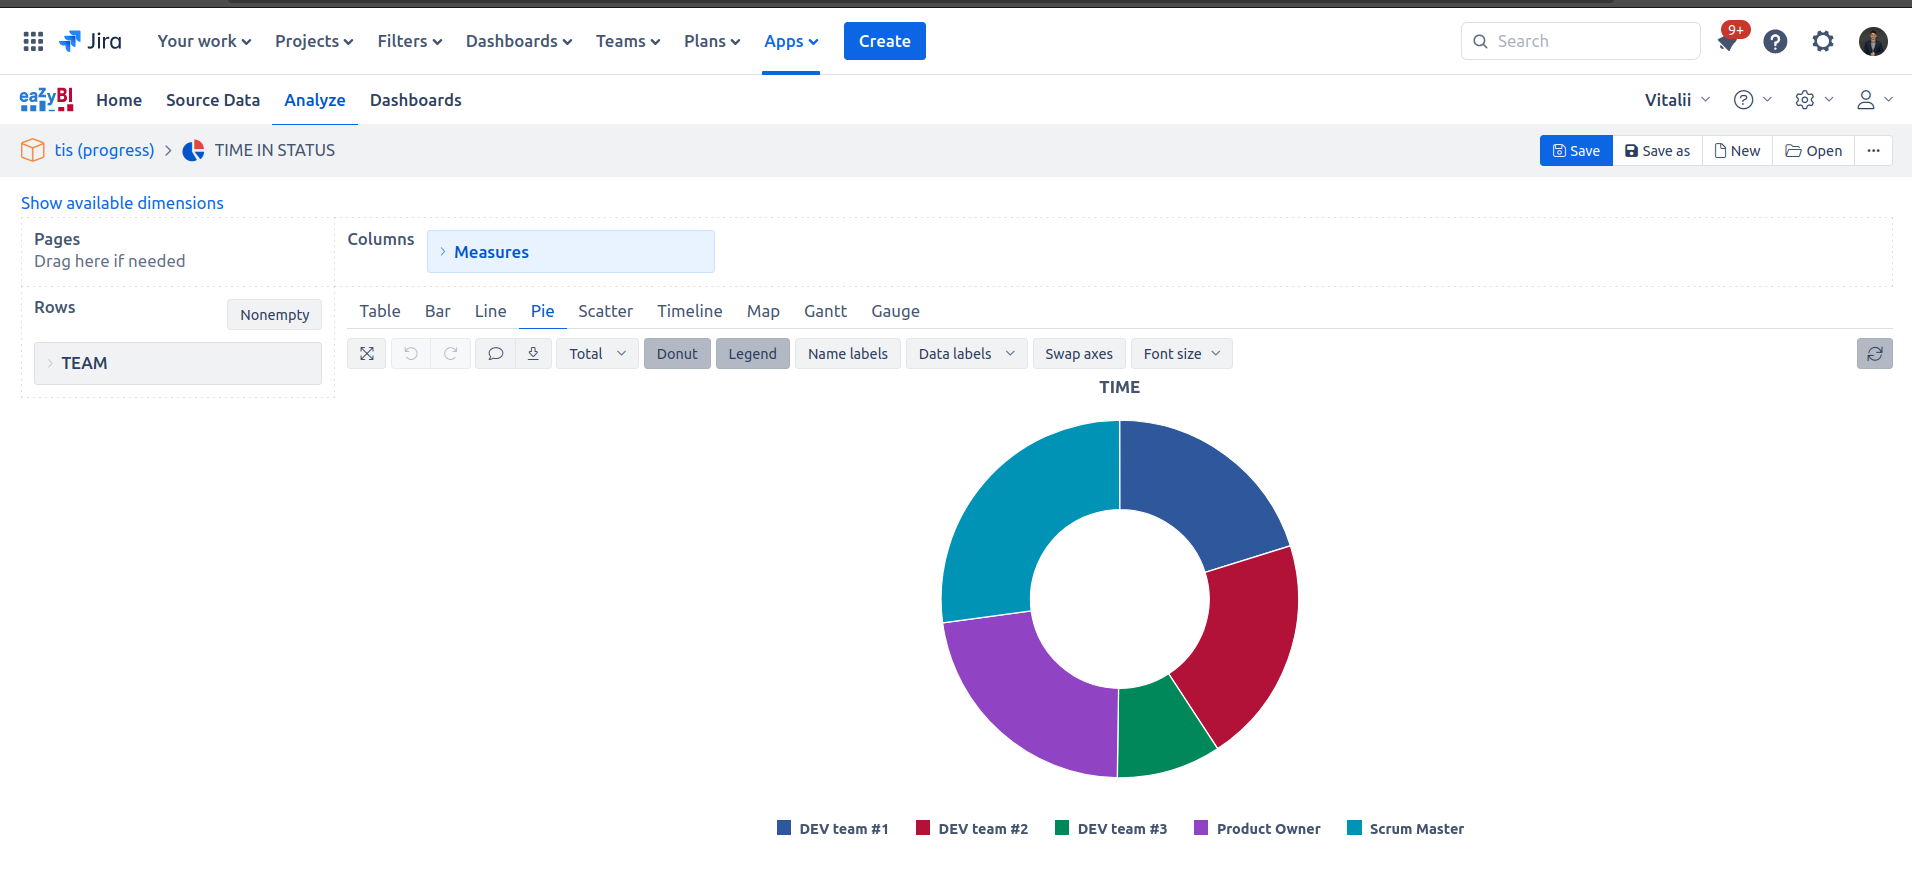
That’s all! Enjoy your data in EasyBI!

Connecting Time in Status with EasyBI allows you to efficiently manage complex data sources and provide meaningful insights through well-configured reports, thus supporting better project management decisions.
If you need help or want to ask questions, please contact SaaSJet Support or email us at support@saasjet.atlassian.net
Haven't used this add-on yet? Try it now