
Role: Financial Manager / CFO / Controller
Imagine you’re a CFO overseeing multiple client projects at once. Each project has its own budget, team members, hourly rates, and unpredictable scope changes. By the time monthly financial reports arrive, it’s already too late — the budget has been exceeded, and now you’re left explaining overruns to stakeholders.
This is the exact situation we’ve seen repeatedly when teams rely on manual spreadsheets. That’s why financial leaders turn to Time & Cost Tracker for Jira: it provides real-time visibility, automated cost calculations, and structured reports directly inside Jira. No surprises, no guesswork — just proactive budget oversight.
Goals
-
Track project and department budgets — monitor budgets at various levels to ensure financial control.
-
Monitor actual costs vs planned — make real-time visual comparisons between planned budgets and actual expenses.
-
Export reports for finance or auditing — generate structured, exportable reports to satisfy accounting or audit requirements.
Key Features Used
-
Expense Tracking
-
Cost Reports and Portfolio View
-
Forecasts
-
Excel Export
Workflow
-
Build Cost Reports
Start with creating Cost Reports, which combine worklogs, billing rates, and direct expenses into a single view.
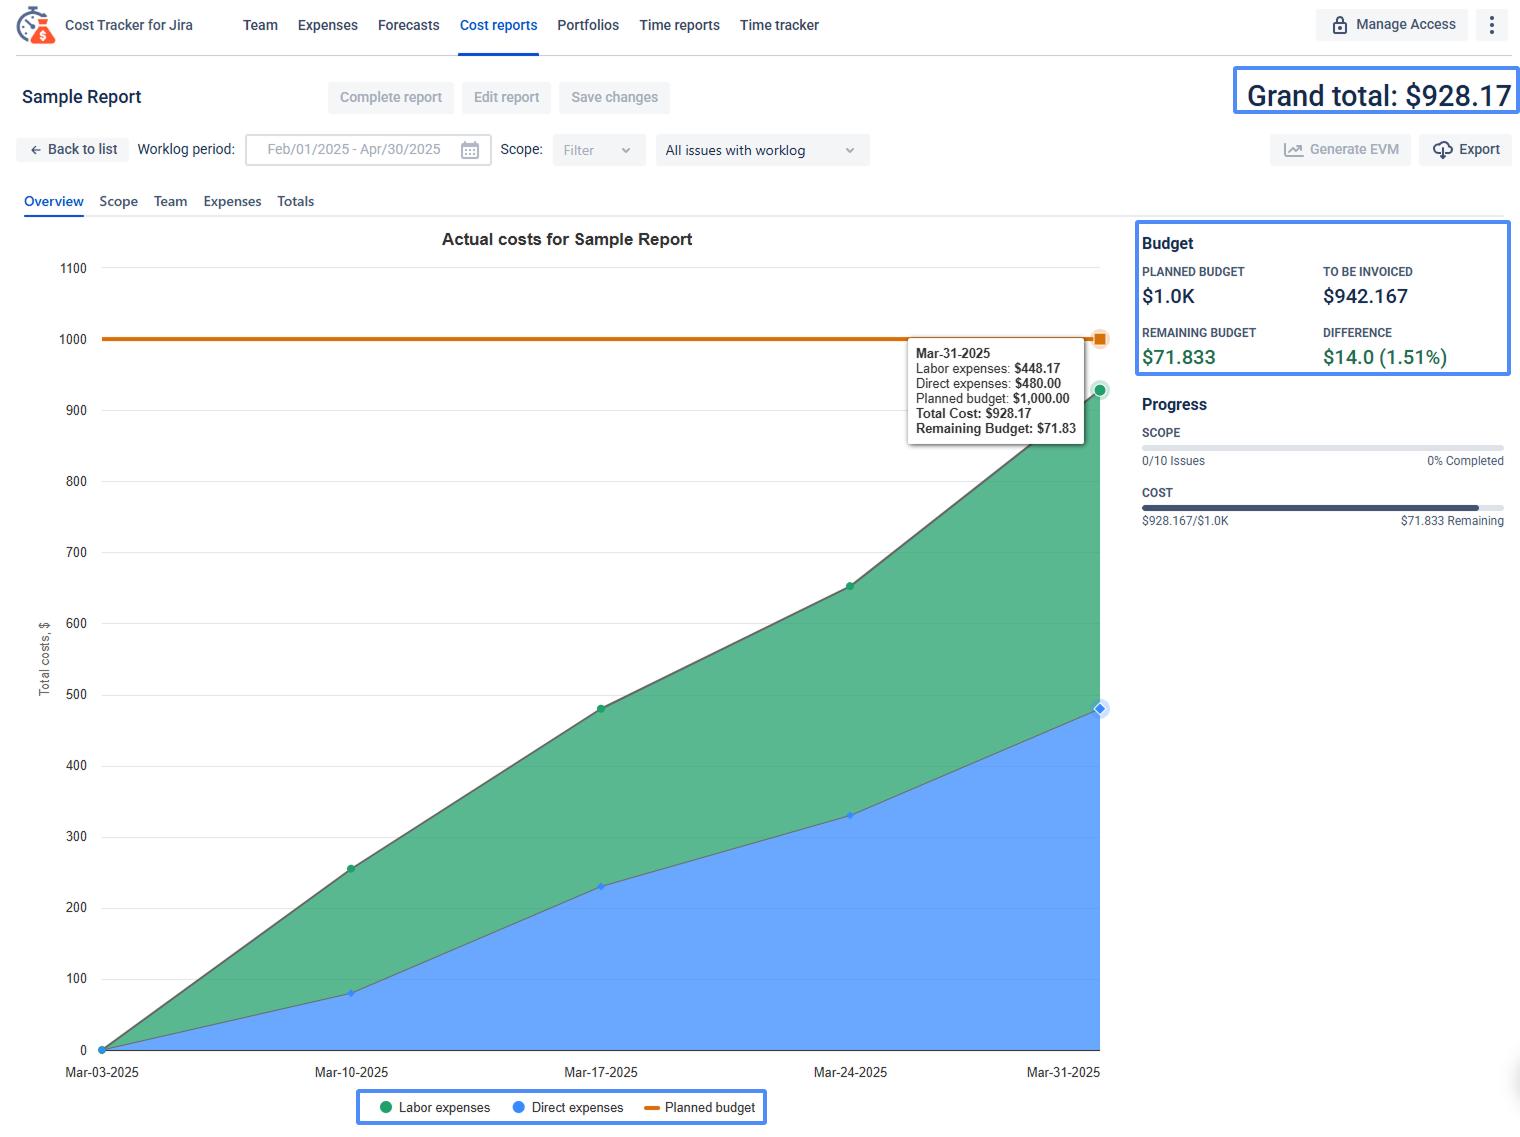
This visualization shows:
-
Stacked expenses over time – green for labor, blue for direct costs.
-
Planned budget line (orange) as a benchmark to track overspending.
-
Budget summary panel – planned vs. actual costs, remaining budget, and variance.
-
Progress bar – project costs vs. scope completion.
✅ Why it’s useful:
-
Immediate insight into budget health.
-
Clear view of cost trends and burn rate.
-
Transparency for stakeholders.
-
Early warning of potential overruns.
-
Consolidate Data with Portfolios
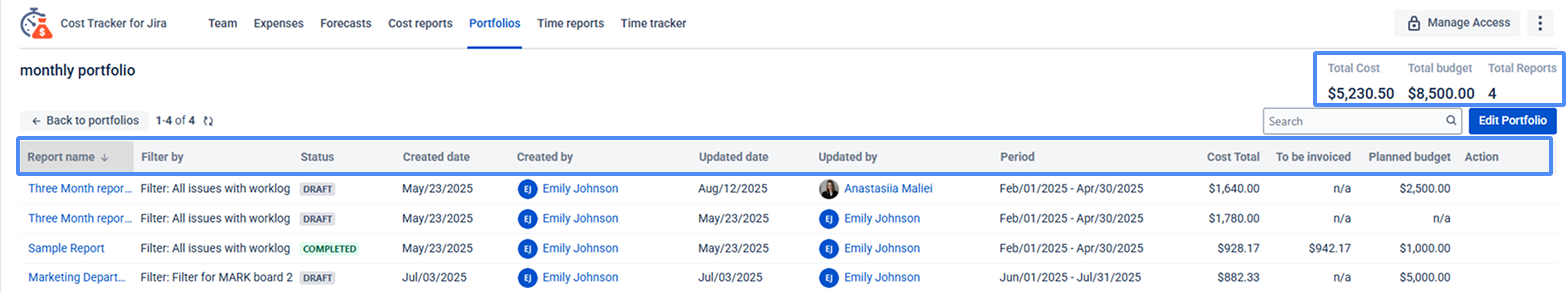
When multiple reports are available, group them into Portfolios for a centralized financial overview. A Portfolio provides:
-
Total cost vs. budget.
-
Billed amount and remaining budget.
-
Key summaries across projects or departments. This consolidated view ensures that finance teams see the complete picture and can manage resources proactively.
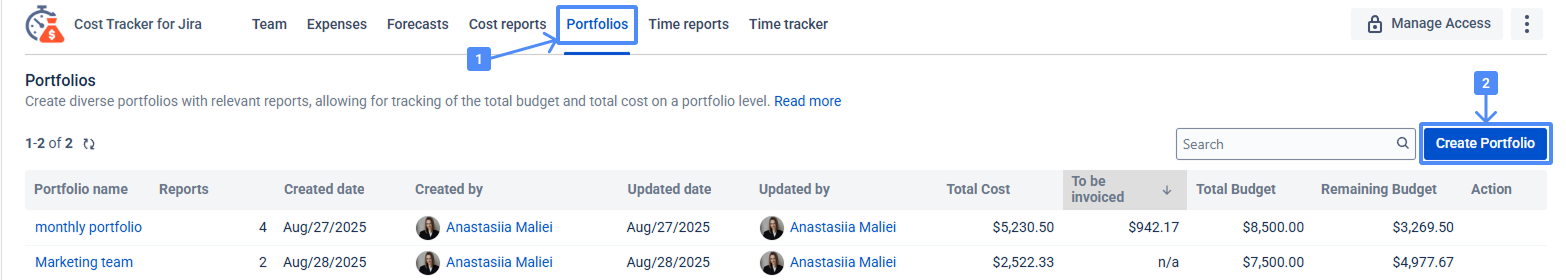
How to create Portfolios:
-
Click the “Portfolios” button in the main menu.
-
Click “Create Portfolio”, name it, select relevant reports, and optionally add a description.
-
View all portfolios to see consolidated financial data.
-
Edit or archive portfolios as needed.
This gives you a full picture of your project finances and helps ensure budgets are not exceeded.
-
Review Profitability
Evaluate whether projects are under or over budget. Compare spending trends across teams or departments to identify efficiency gaps or potential risks.
-
Forecast Expenses
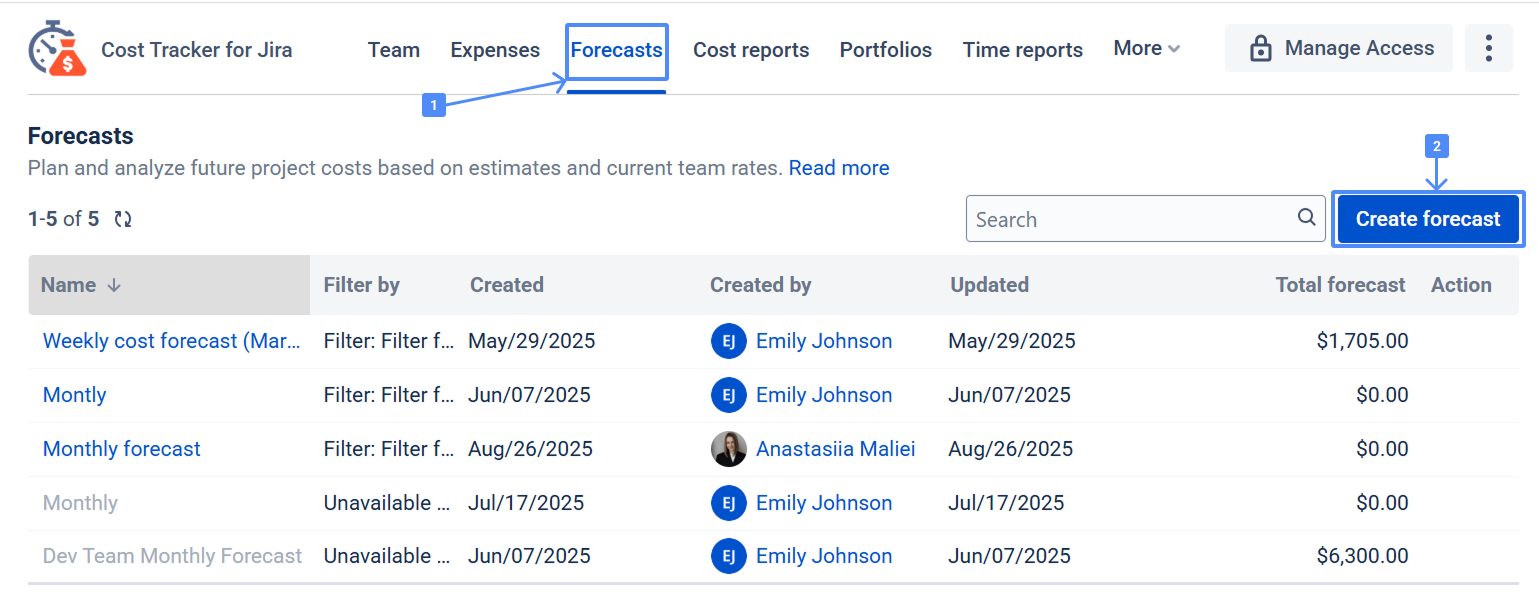
Use Forecasts to analyze trends and predict upcoming costs.
Creating a Forecast:
-
Go to the Forecasts section and click “Create Forecast”.
-
Name the forecast, choose a scope, set default forecasted rates, and select the estimated field (Original Estimate or Remaining Estimate).
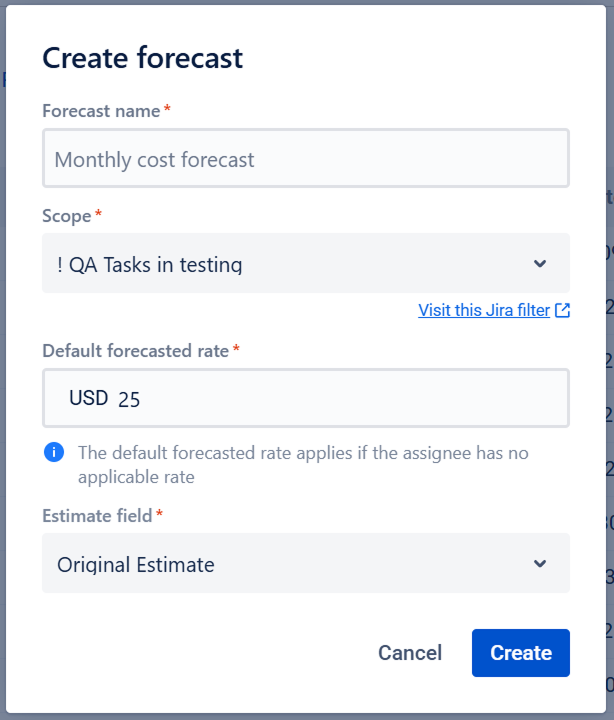
-
Click Create — the forecast is calculated as:
🧮 Estimated Time × Hourly Rate = Forecast Cost -
You can adjust hourly rates for team members, and forecasts can be updated if scope or team changes.
-
Export Reports
Once analysis is complete, generate structured Excel or CSV reports. These exports are ready for accounting teams, stakeholders, or auditors — eliminating manual effort and ensuring data consistency.
If you need help or have questions, please contact SaaSJet Support or email us at support@saasjet.atlassian.net.
Haven't used this app yet? Try it now! >>>