Get started and configure Time Metrics Tracker | Time Between Statuses app for Data Сenter
Learn more about all the features of the app Time Metrics Tracker | Time Between Statuses.
Configurations
Find the installed Time Metrics Tracker add-on below the Jira settings menu and click on it to open the add-on.
Click on a gear in the top right corner to open the Configuration manager .

1. Manage Work Schedule
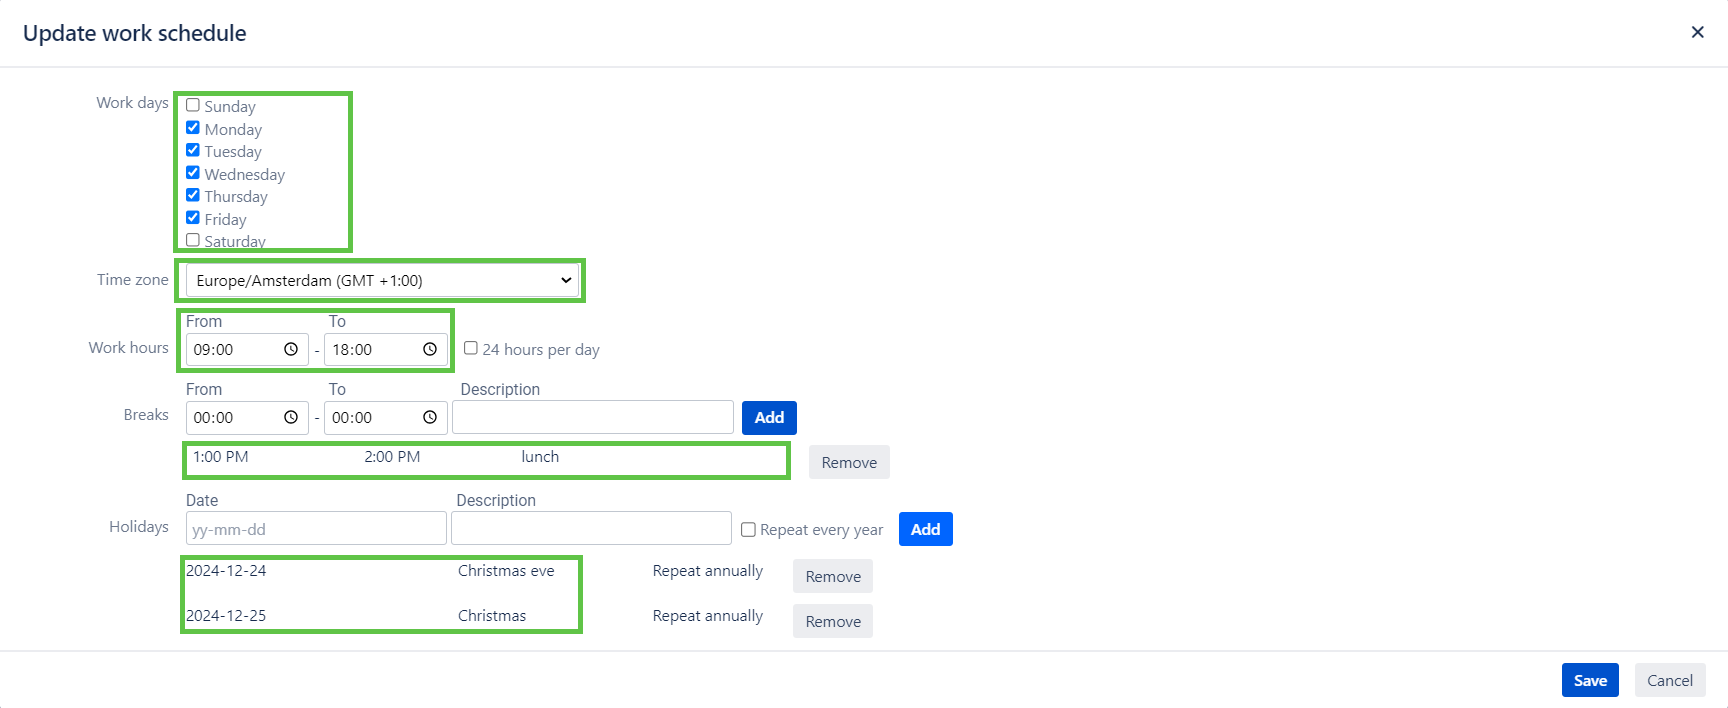
Click Work Schedule in the configuration manager to manage your team's work schedule.

You can choose working days, time zones, working hours, breaks, and holidays there.

The time that issues have been spent between statuses will be calculated according to your work schedule settings.
2. Add a new time metric
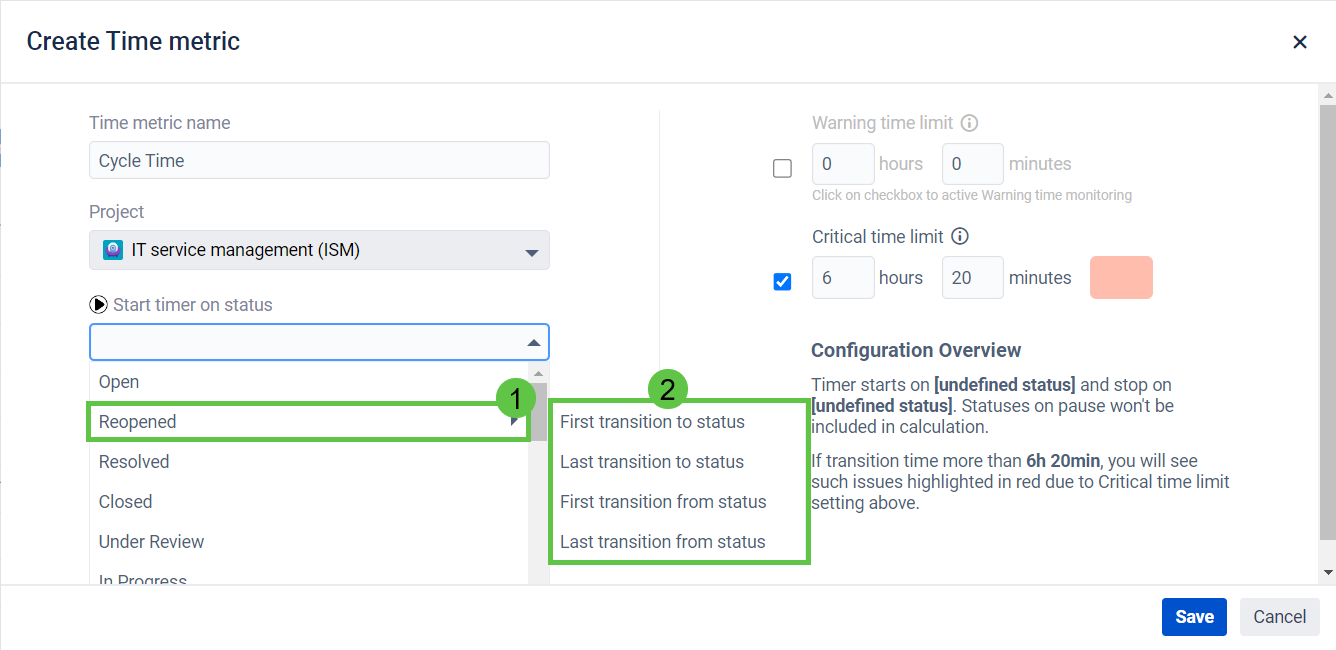
There are two ways to create a Time Metric: 1. using Configuration Manager and 2. using a dropdown on the grid.


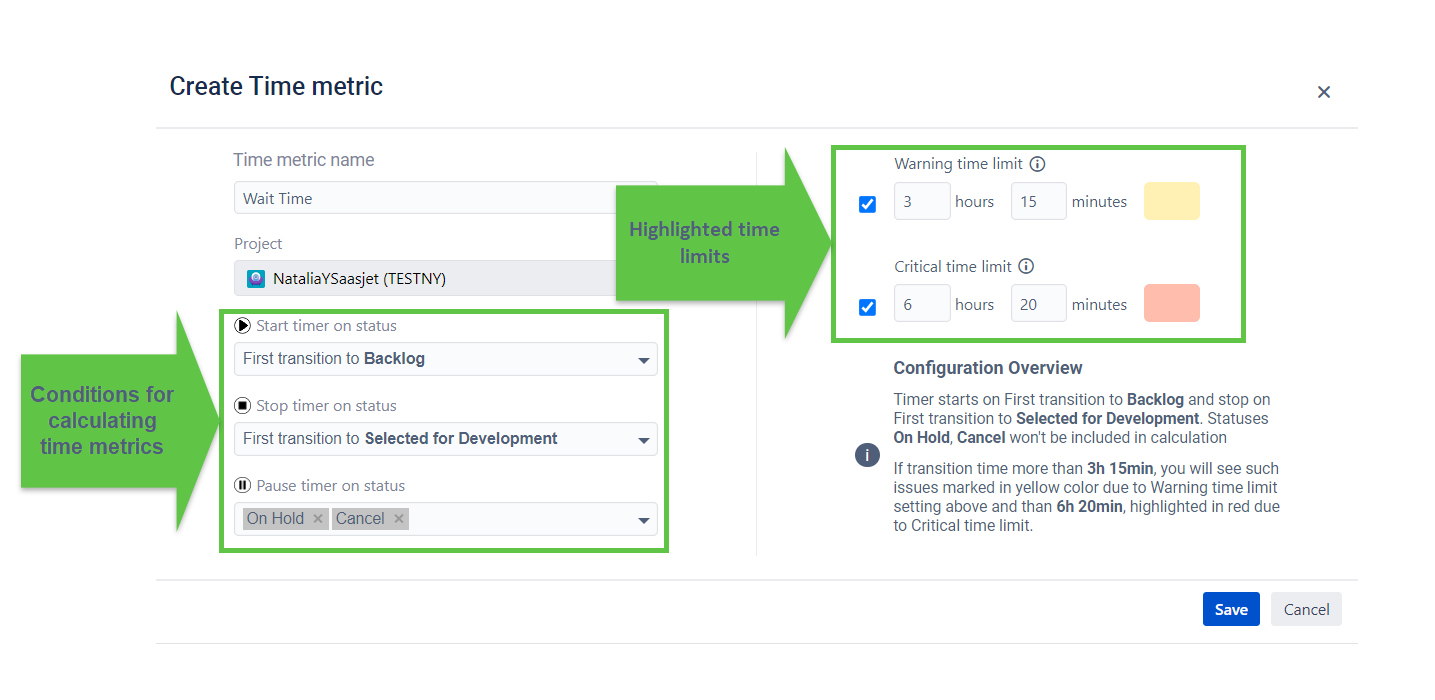
First, add a name to your time metric and select a project to monitor. Then, select statuses on which the timer should start and stop the calculation. You can also choose a status on which the timer should be on pause. After customizing your calculation preferences, set the Warning and Critical time limits.


This feature will help you to get the visual color tagging on issues to notify you when the time limits have been exceeded:
Warning time limit - yellow
Critical time limit - red
3. Choose a Time Format
Option Format lets you select the time format of status duration: h:m (hours:minutes), HM (Hours, Minutes), M (Minutes) or Decimal Hours.

All reports are available to export.

* Please note: In order to extract the data for analysis, please choose the Decimal Hours time format. This will enable you to perform calculations on the exported data and build charts.
If you need help or want to ask questions, please contact us through a SaaSJet Support or via email support@saasjet.atlassian.net
Haven't used this add-on yet, then try it now !