With the Adding Gadget feature, you can add a Pie Chart, Met vs Exceeded and Met vs Exceeded per Criteria charts to your Jira Dashboard.
How to Add an SLA Gadget
You can add an SLA gadget in two ways.
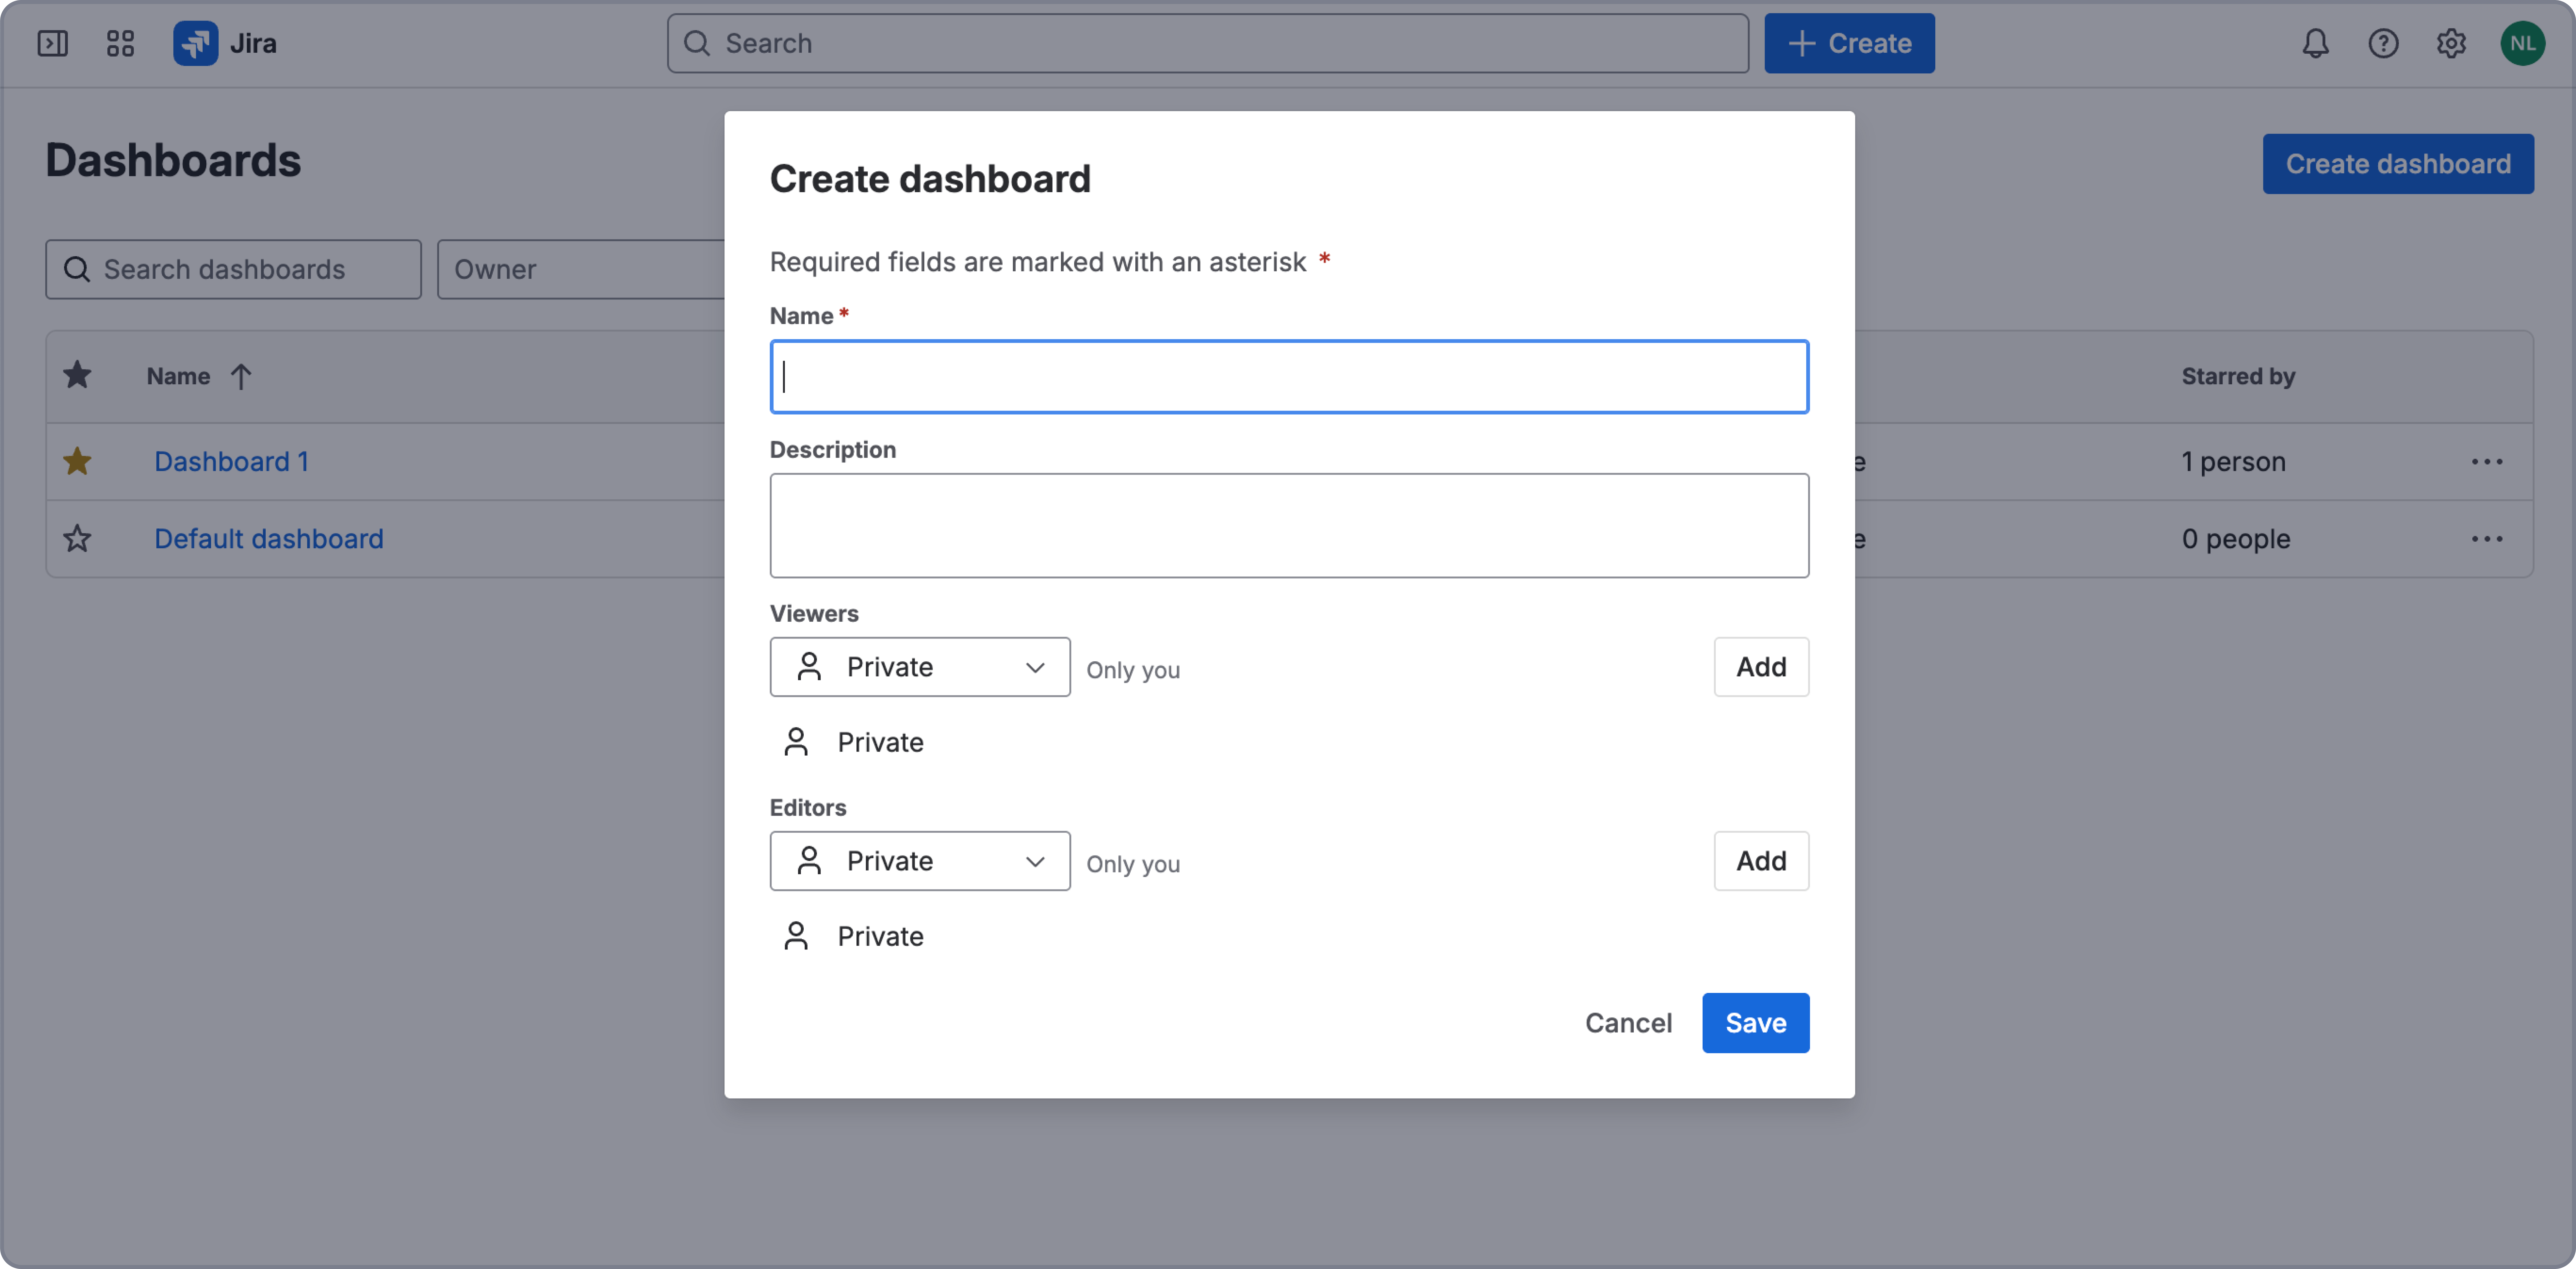
Method 1: From Jira Dashboard (when you don’t have a dashboard yet)
-
Go to Dashboards
-
Click Create dashboard
-
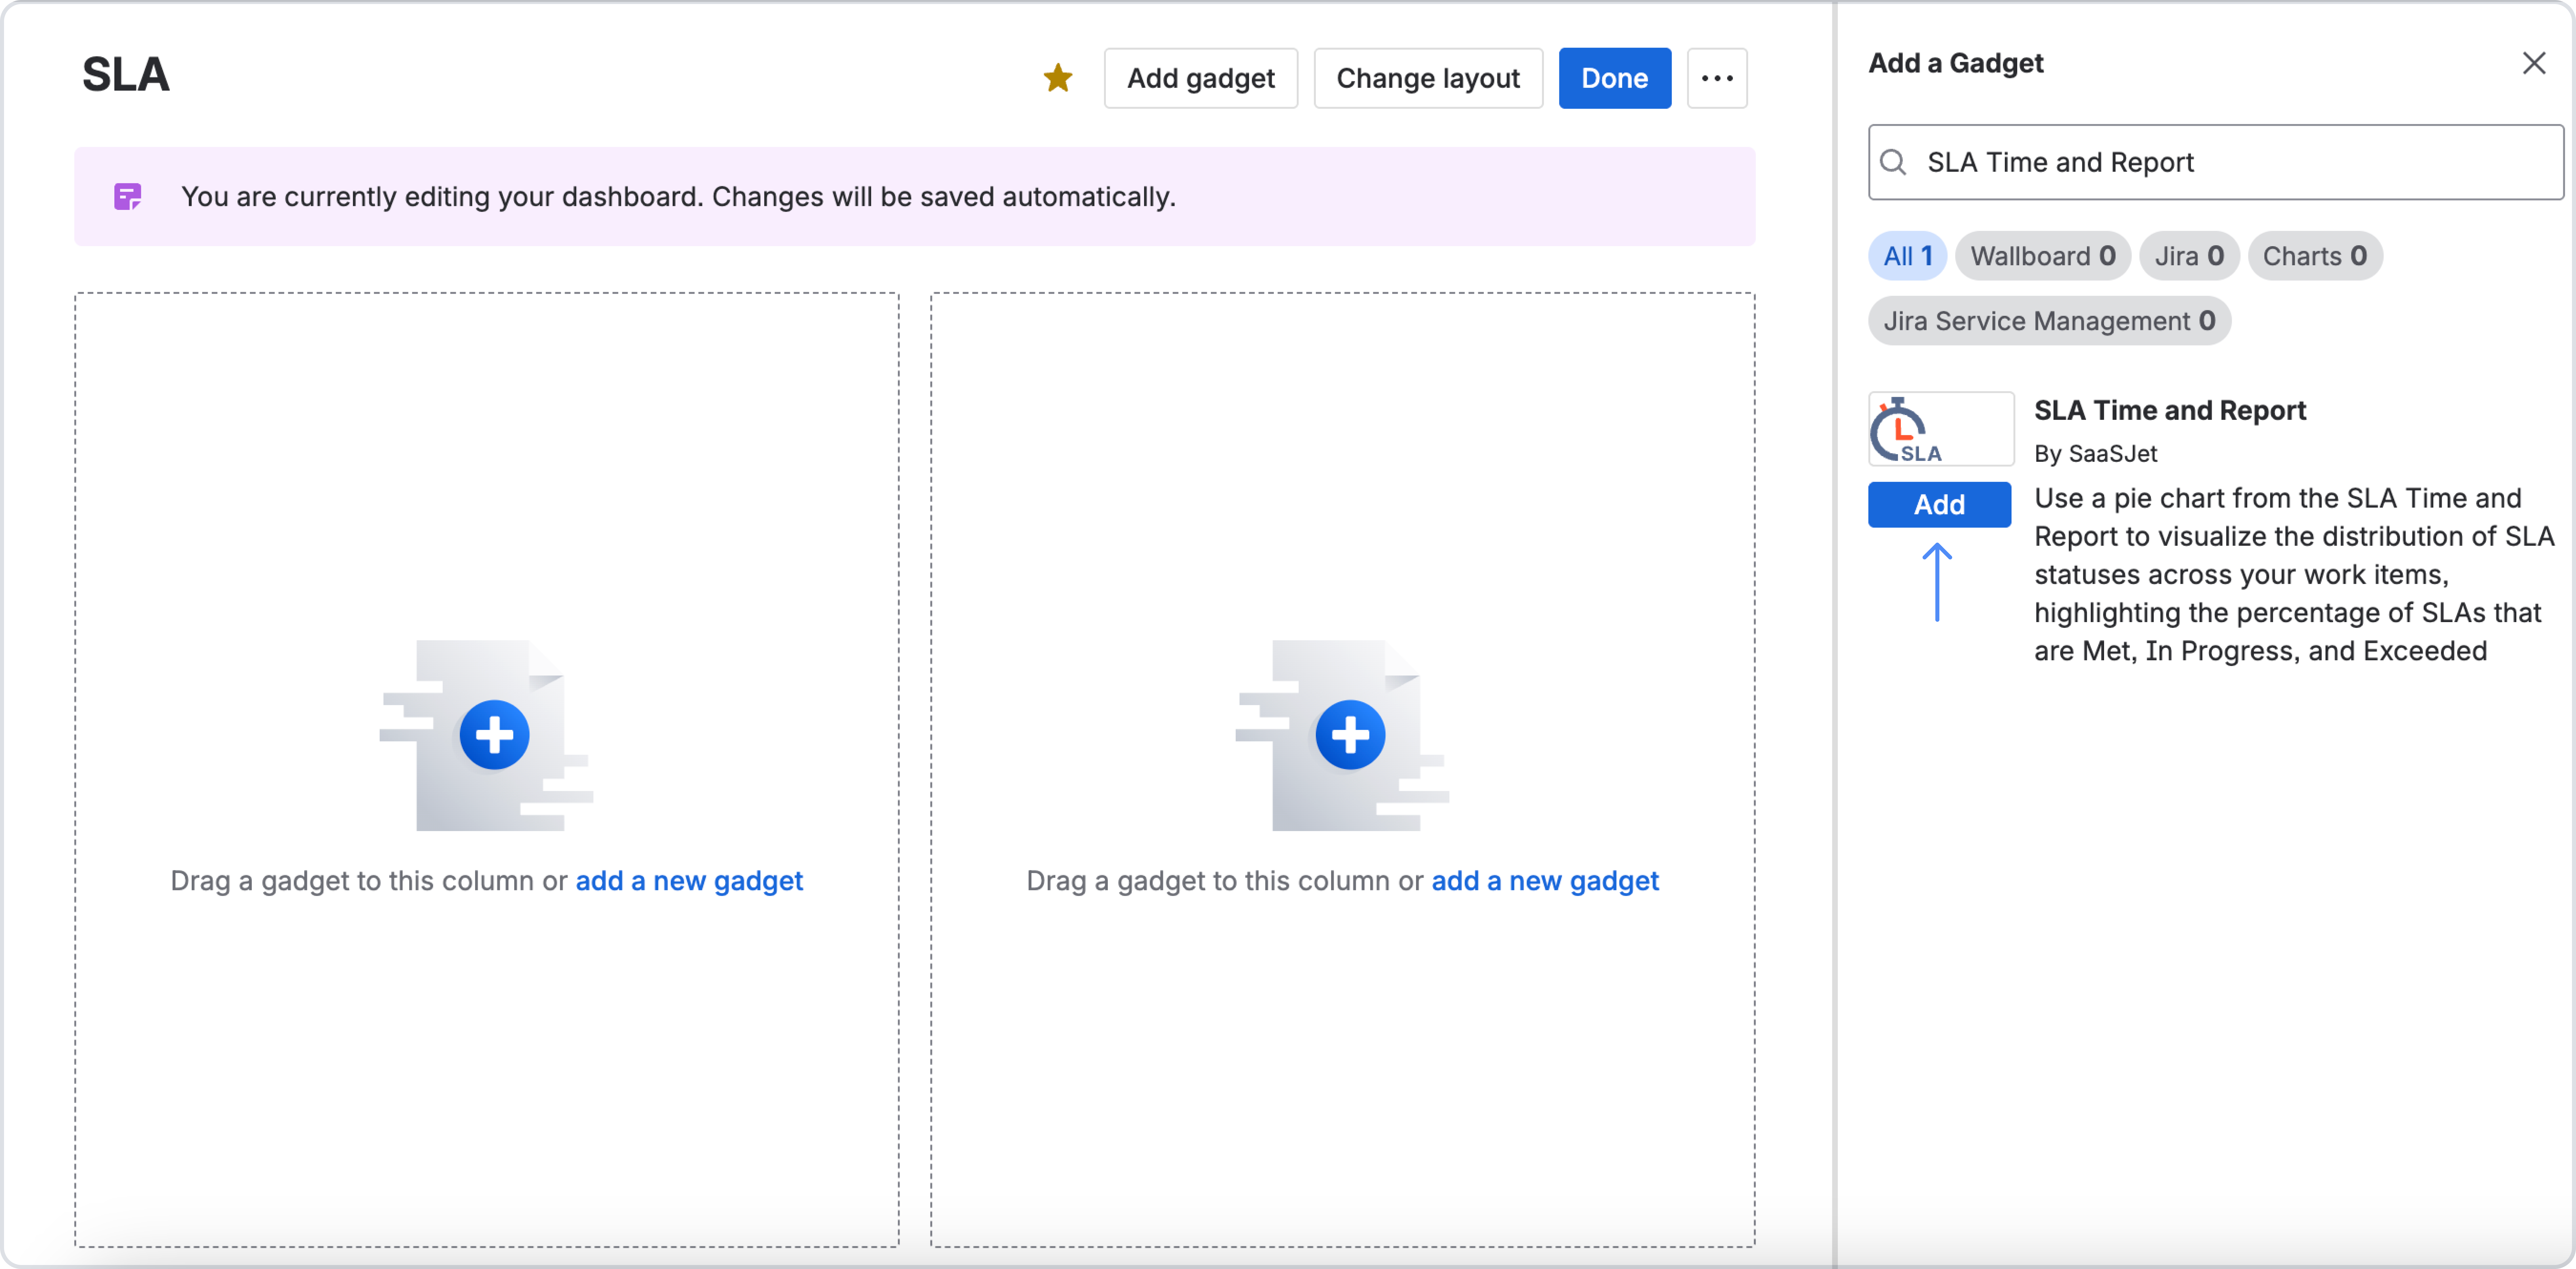
Then click Add gadget
-
Search for SLA Time and Report
-
Click Add
-
Then go to the App and configure it
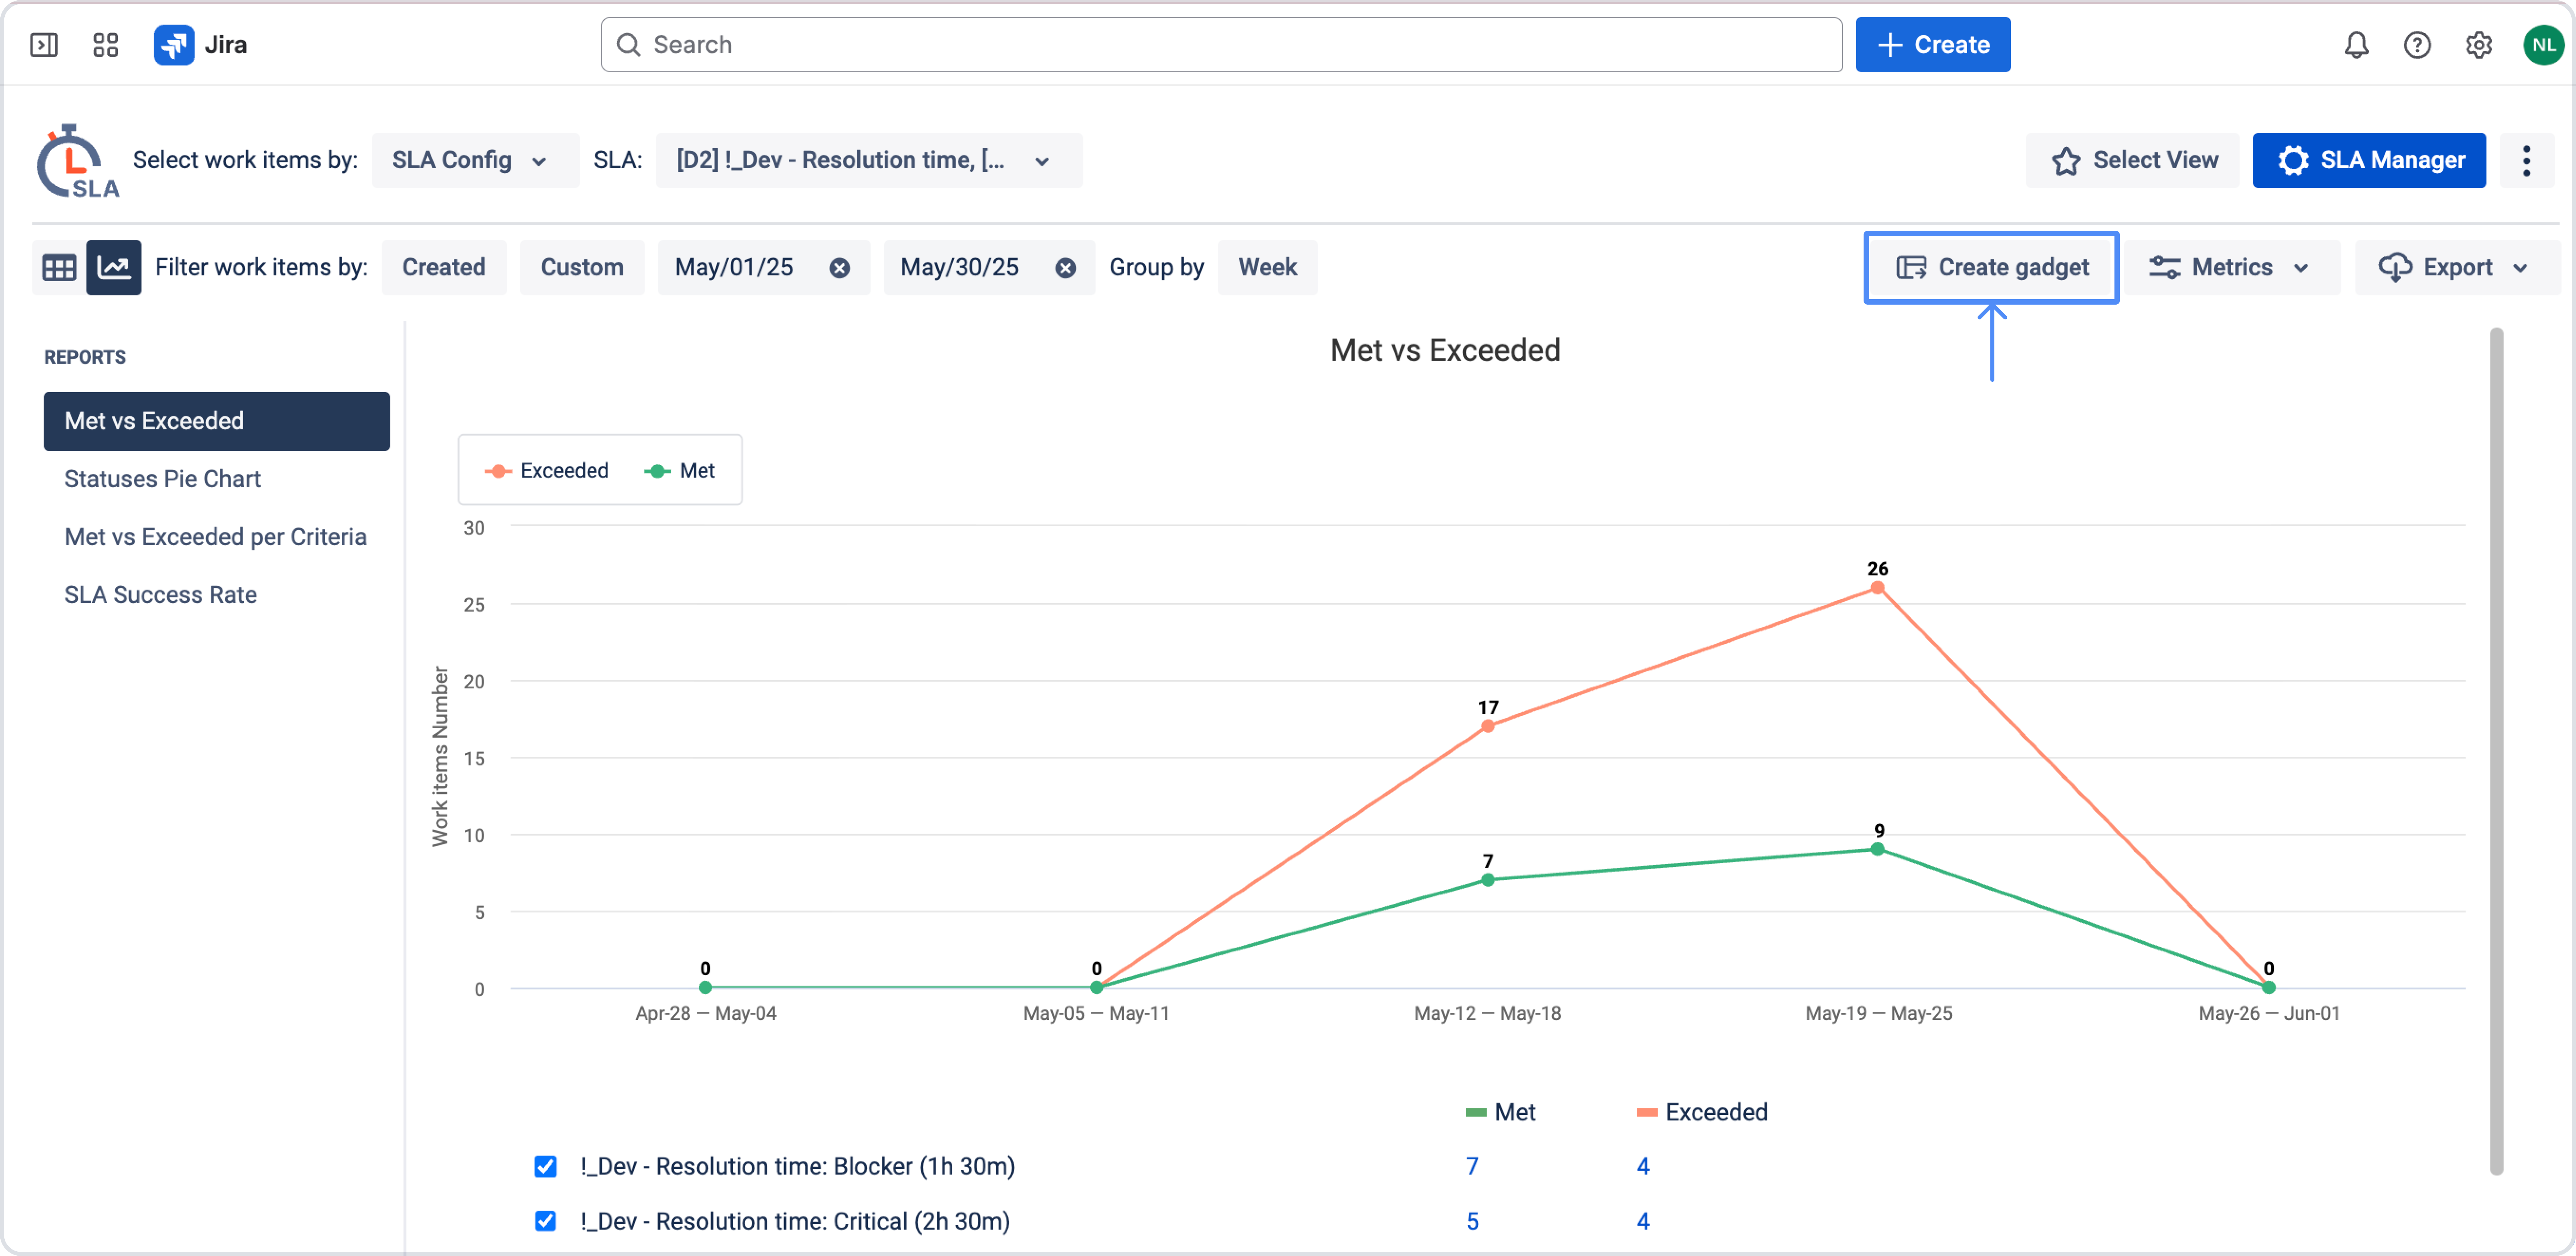
Method 2: From SLA Time and Report App (when you already have a dashboard)
-
Go to the Charts you want to add to your Dashboard and click the Create Gadget button.
-
Next, select Dashboard and click Create. If you don't have a dashboard, you need to create one.
The gadget will be added to your new dashboard.
If the operation is successful, you will receive a notification with a link to the Dashboard.
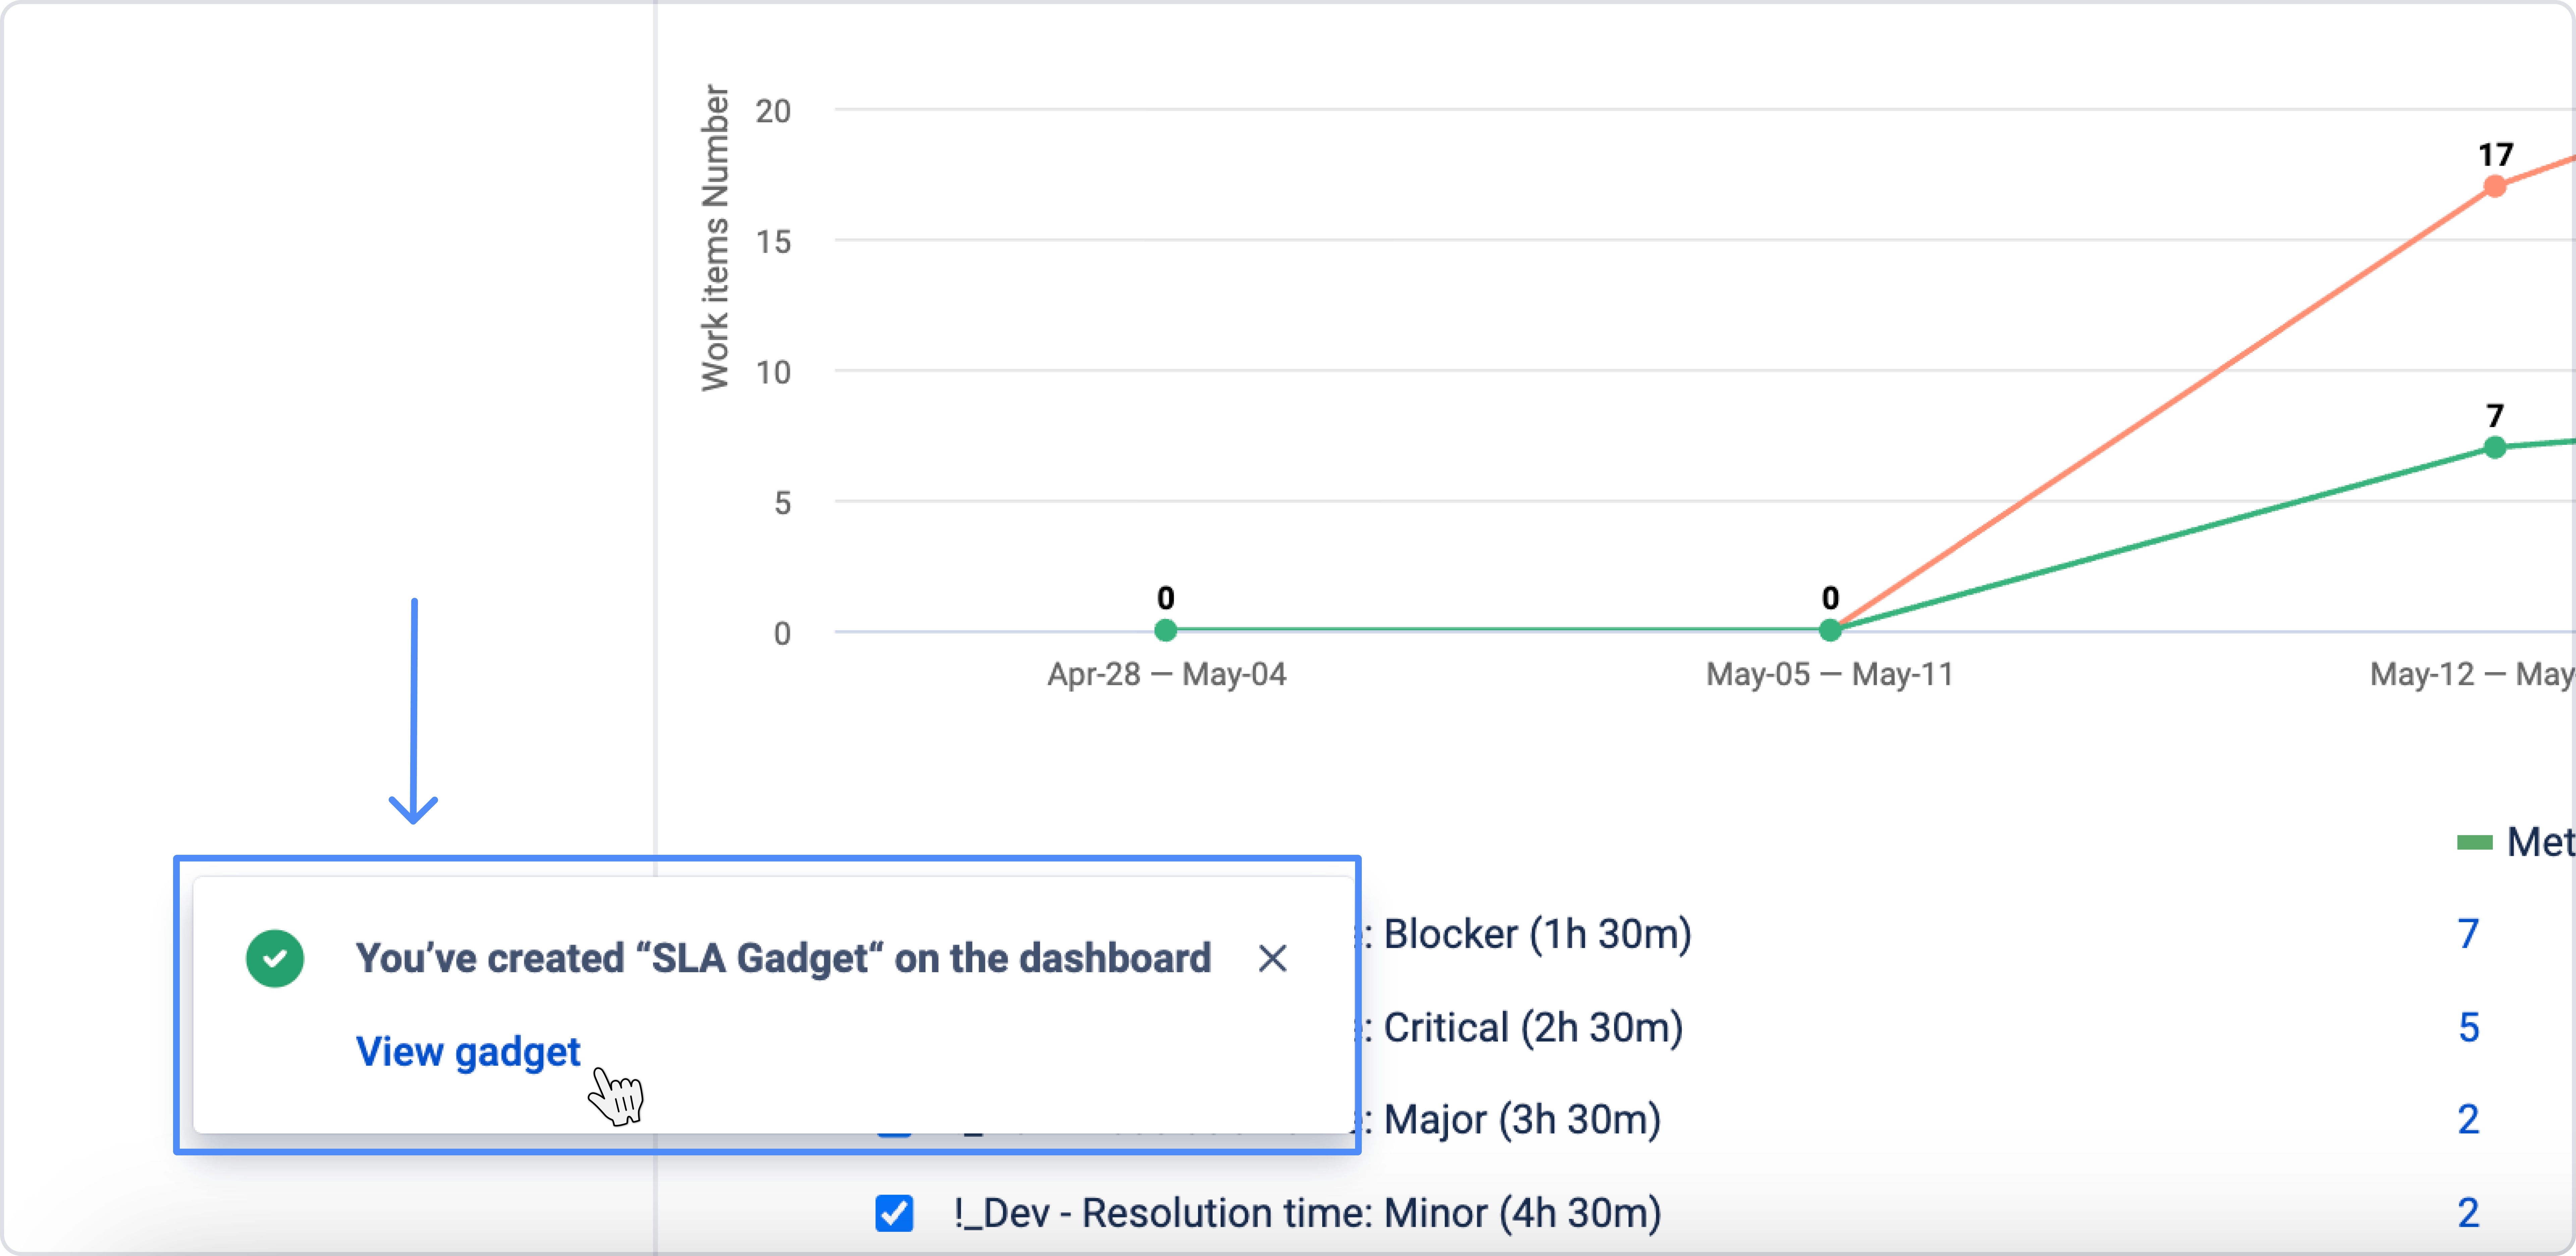
You will get charts in the Dashboard by clicking on the link.
Dashboard Permissions (Before Adding a Gadget)
Before adding an SLA gadget, check dashboard access.
How to check:
-
Open the dashboard
-
Click ••• (top right corner)
-
Click Rename or share
.png?cb=e46c28a4c76ae0761adf38e6f7d0bc5b)
You CAN add gadgets if:
-
The dashboard is Private
-
You are the owner
-
It is shared with a Group (with edit rights)
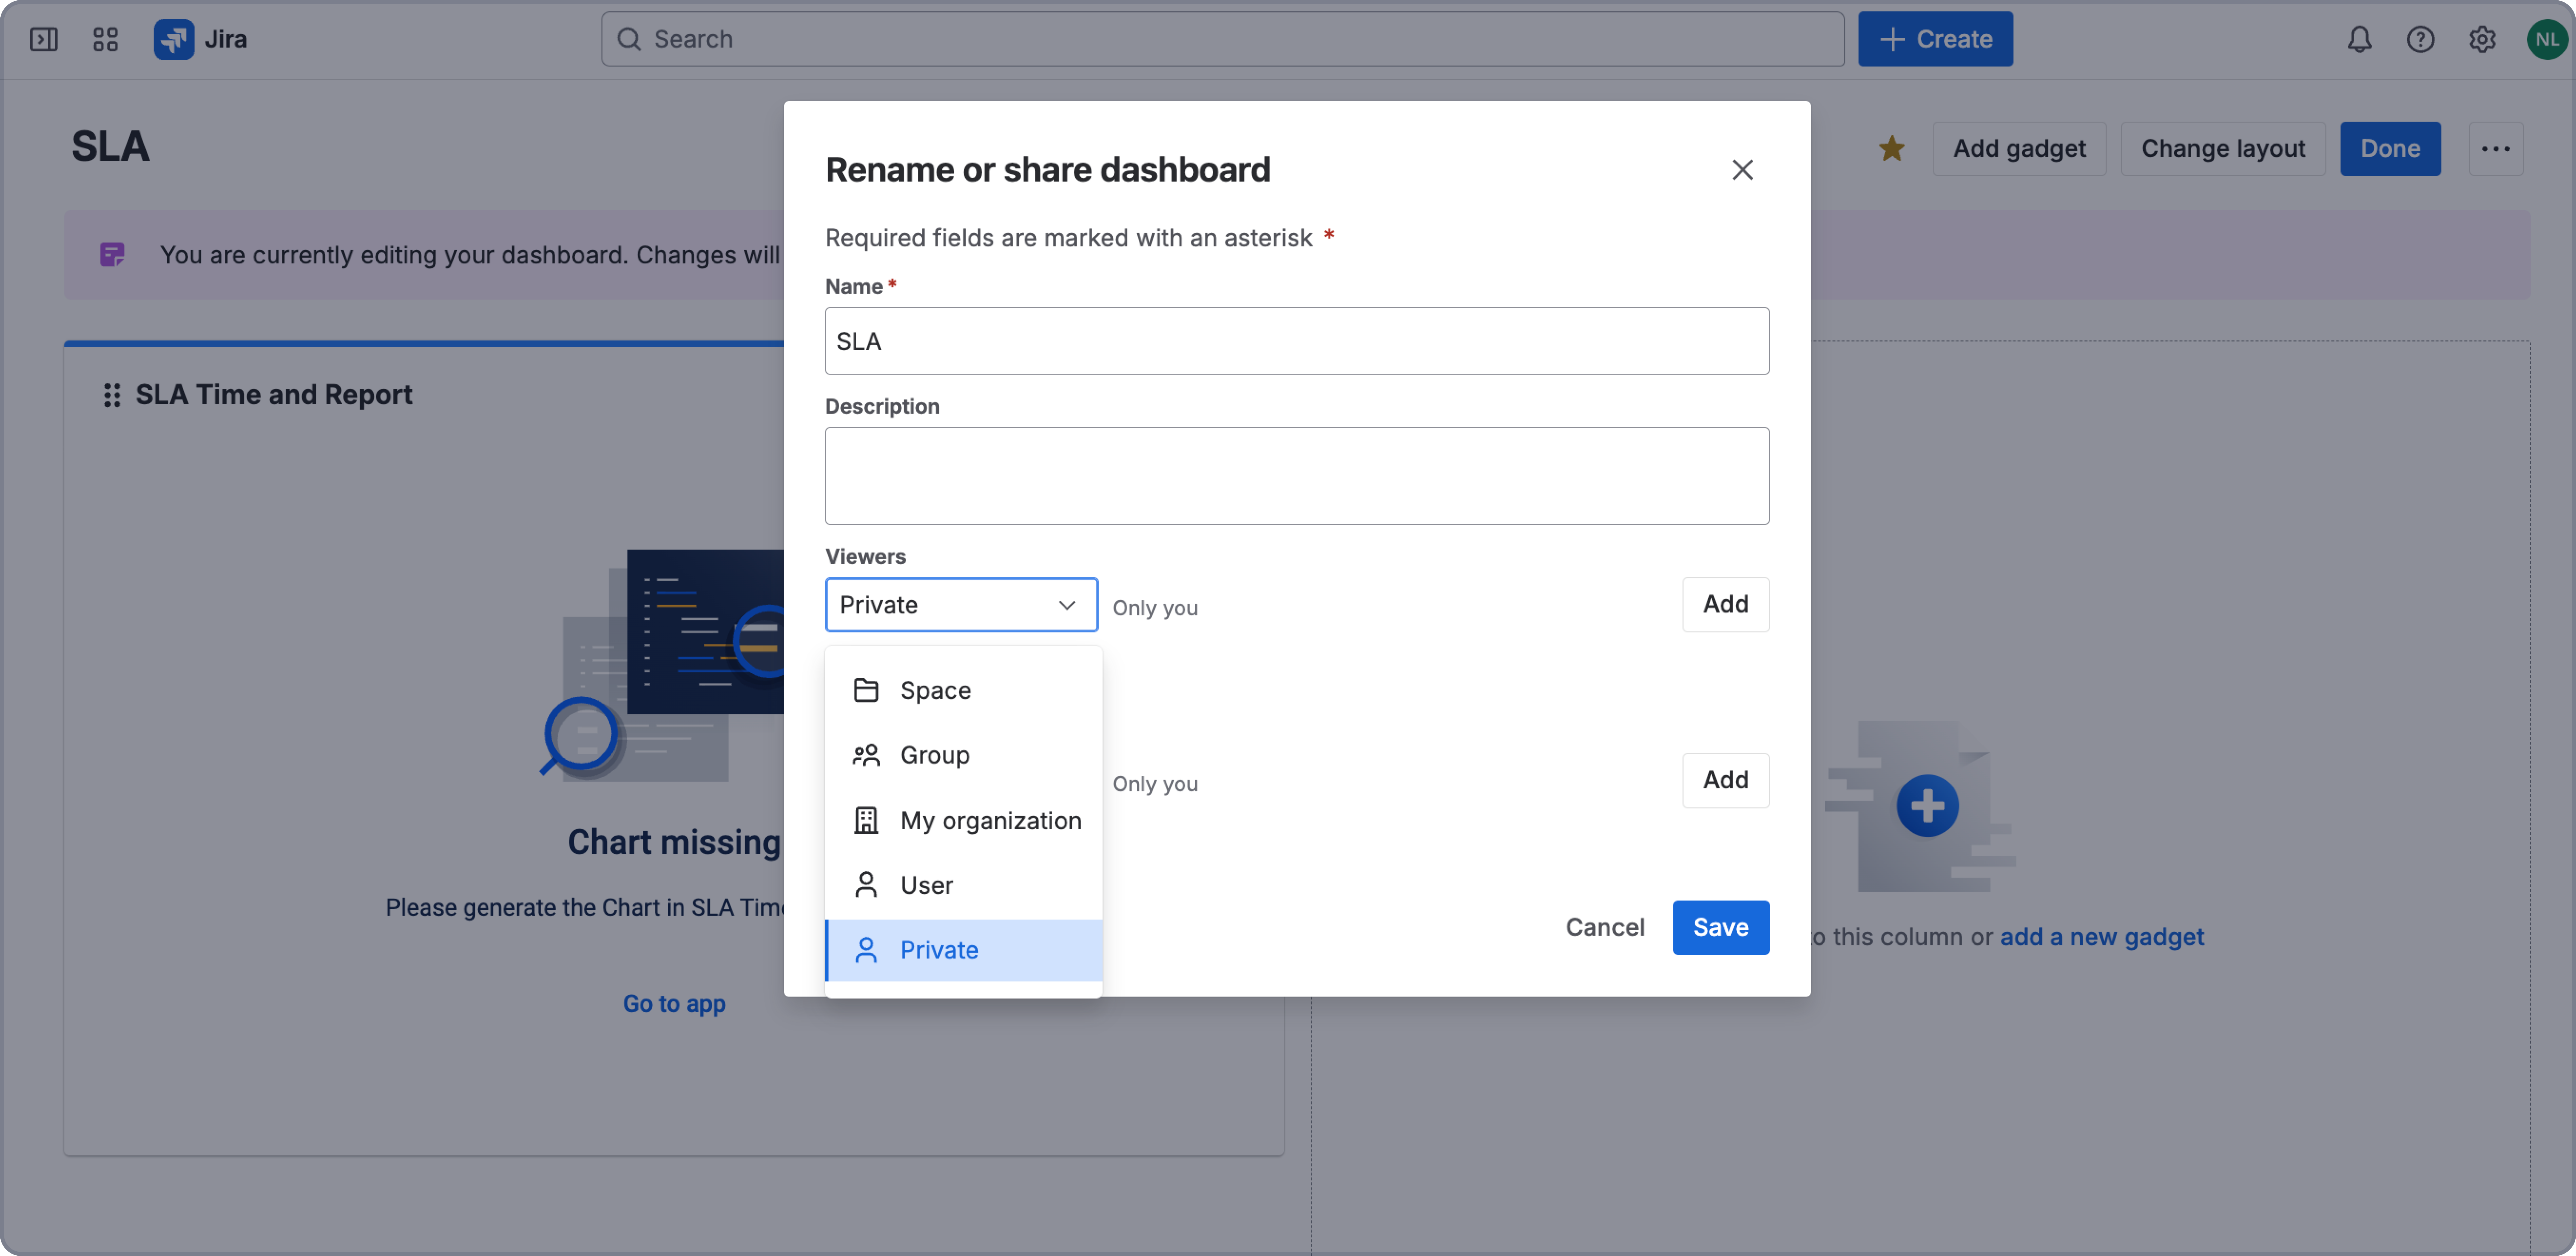
You CANNOT add gadgets if:
-
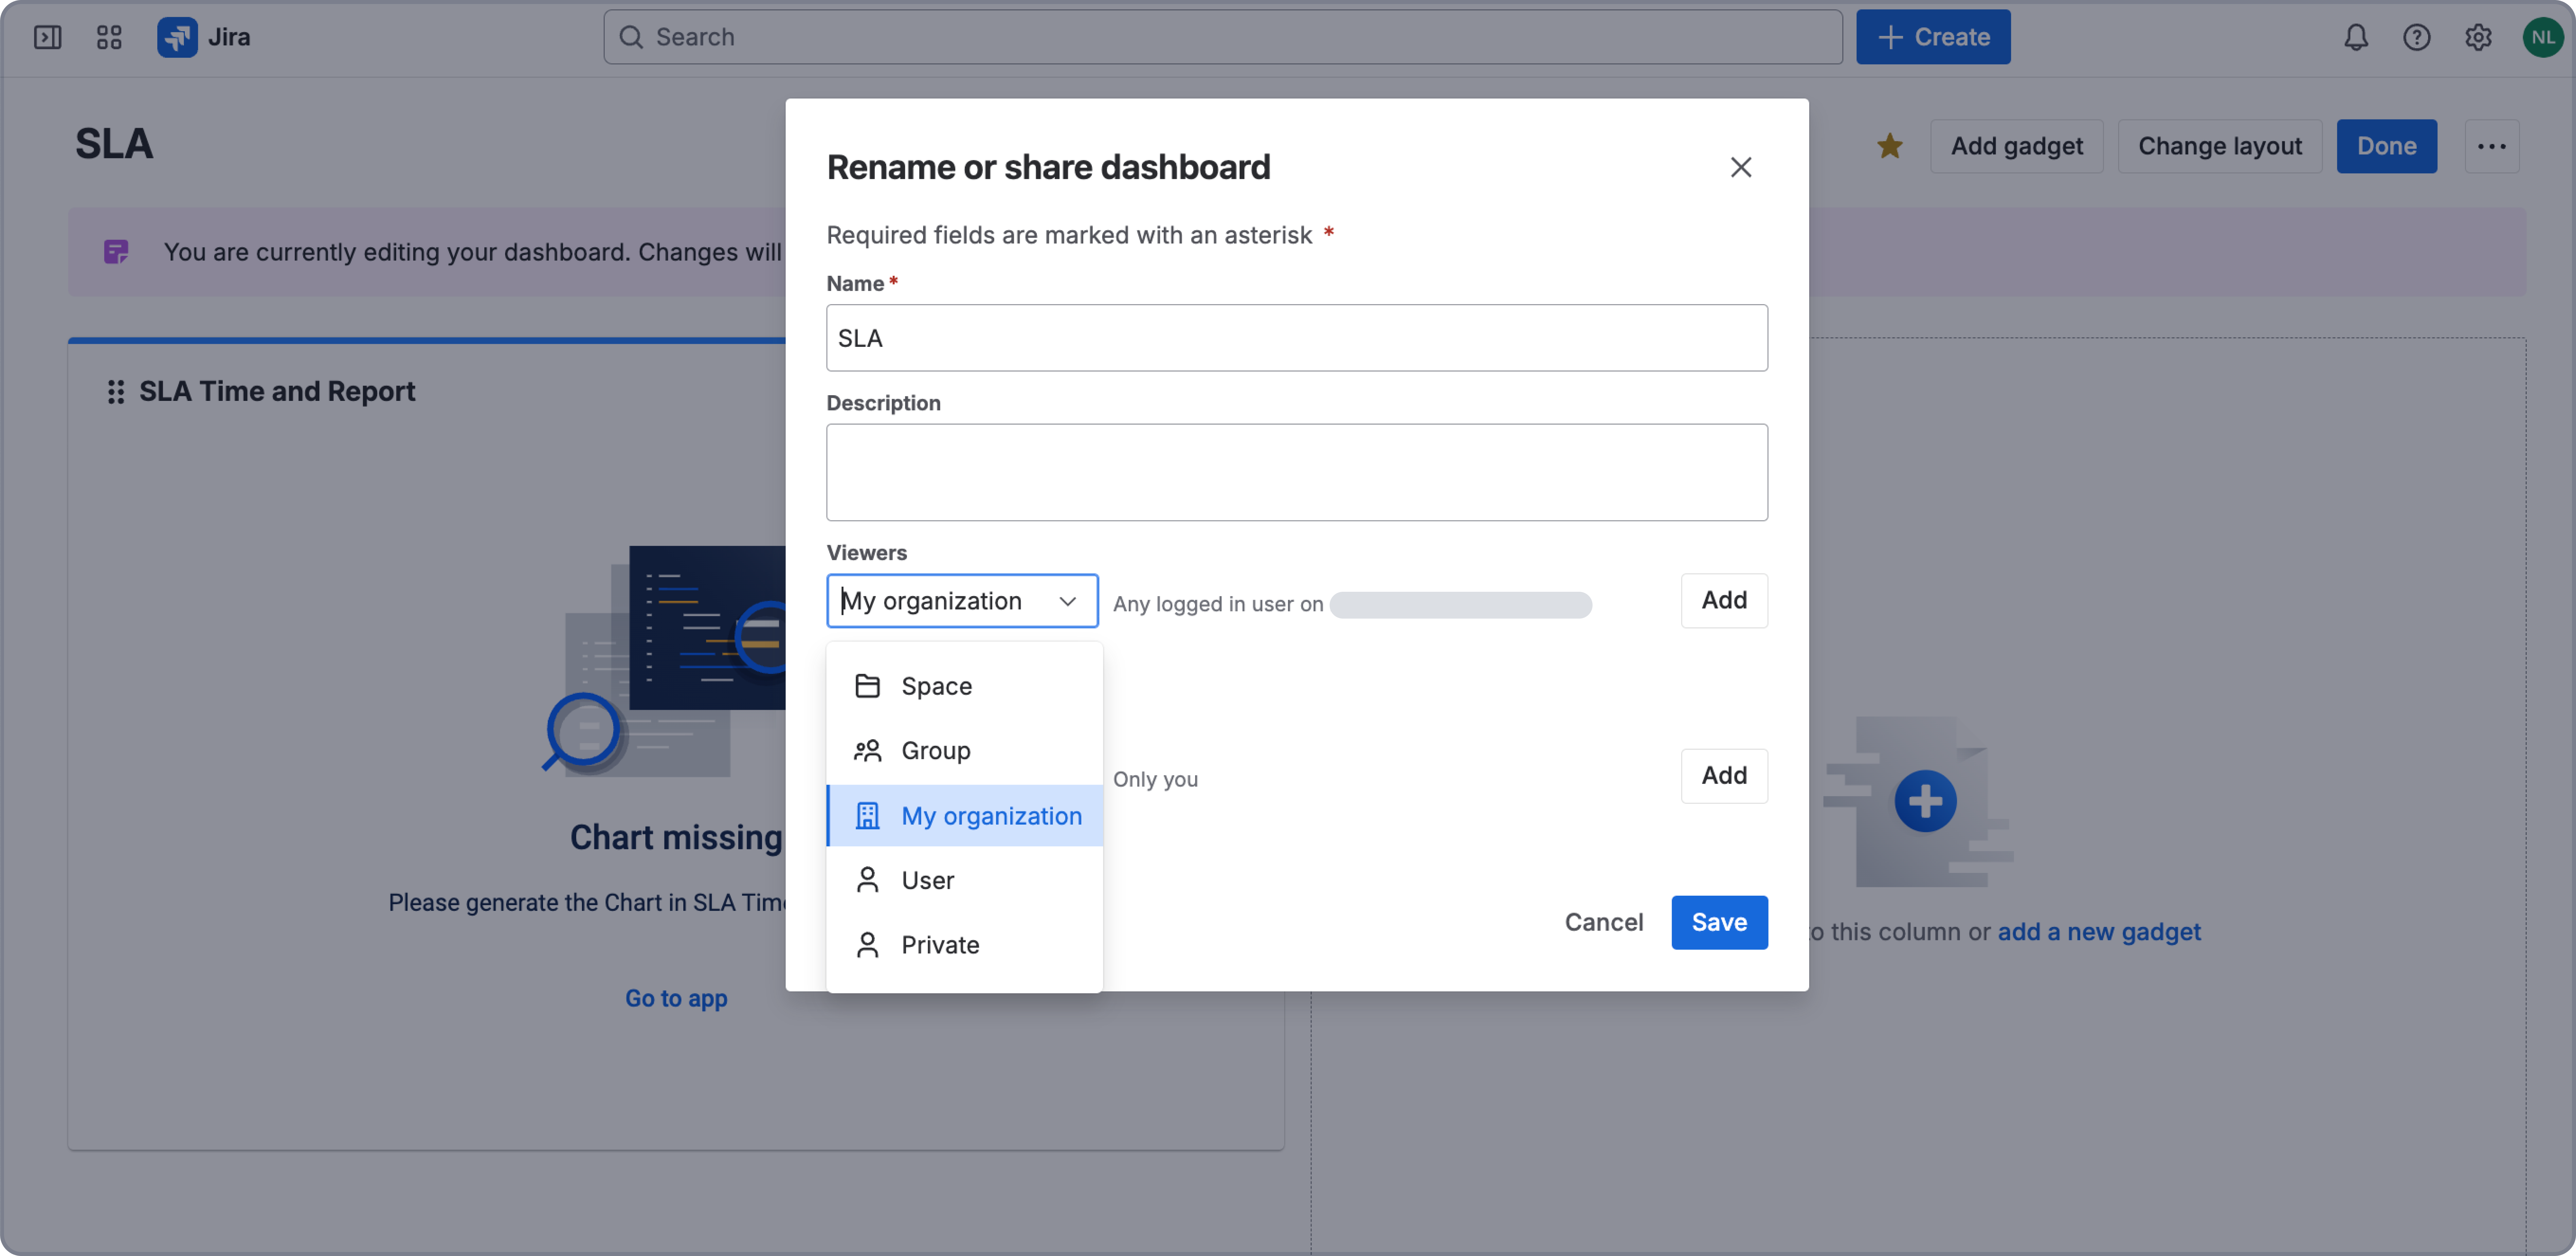
It is shared with My organization → view only
-
It is shared with Project → view only
The number of gadgets on a dashboard is limited to 20 by default. Consider managing your gadgets to stay within this limit.
Note: If you update the filter inside the SLA Time and Report add-on, you will need to re-add the gadget to your Dashboard for the changes to take effect. The updated data will not automatically refresh in the existing gadget.
Important: If you try to add a Chart directly from the Jira dashboard without creating it first in the SLA Time and Report add-on, the chart will appear blank. Make sure to generate the chart in the add-on before adding it to your Dashboard.
Helpful resources & links