
Key GA4 Metrics to Track in Jira
Marketing Campaign Analyzer integrates Google Analytics 4 (GA4) data directly into Jira so you can connect campaign performance with your team’s work. To get the most value, here are the key GA4 metrics we recommend tracking.
1. Acquisition Metrics (Reach & Source Quality)
These metrics show how many people your campaigns are bringing in and from where.
Users (Active Users) – Number of people who interacted with your site or app during the campaign period.
New Users – First-time visitors from your campaign.
Sessions – Total visits generated by campaign traffic.
Traffic Source/Medium/Campaign – UTM-based data that identifies which channel and campaign drove each session.
2. Engagement Metrics (Quality of Visits)
Engagement metrics reveal whether campaign visitors are interacting meaningfully with your content.
Engagement Rate – Percentage of sessions that were considered “engaged” (lasted more than 10 seconds, had multiple page views, or triggered a key event).
Average Engagement Time per Session – Average time users stayed actively engaged.
Engaged Sessions per User – Measures repeat interest from campaign-driven traffic.
Event Count (CTAs) – Number of times users interacted with campaign goals such as downloads, button clicks, or video plays.
📌 Use case: Spot whether high-traffic campaigns are actually keeping visitors interested.
3. Conversion Metrics (Campaign Effectiveness)
Conversion metrics connect campaign traffic to business outcomes.
Conversions (Key Events) – Actions you define as success, such as sign-ups, demo requests, or purchases.
Conversion Rate – Percentage of users or sessions that completed a key event.
Revenue / Purchase Events – For ecommerce campaigns, the monetary value generated.
Micro-Conversions – Smaller actions that signal intent (e.g., newsletter sign-ups, resource downloads).
📌 Use case: Measure which campaigns are not only attracting traffic but also driving real results.
4. Monetization & ROI Metrics (Financial Impact)
These metrics help evaluate campaign efficiency and return on investment.
Total Revenue from Campaign Traffic – Direct income from campaign-driven sessions.
Average Revenue per User (ARPU) – Efficiency of spend per user.
📌 Use case: Compare campaigns with similar traffic but different revenue contributions.
✅ Pro Tip: Use UTM Tags Consistently
Always tag campaign links with UTMs (utm_source, utm_medium, utm_campaign, utm_content). This ensures GA4 can accurately attribute campaign traffic and conversions, making your reports in Jira clearer and more reliable.
Viewing Metrics in Jira
With Marketing Campaign Analyzer, these GA4 metrics appear alongside your Jira work items. You can:
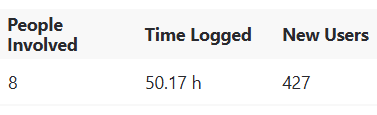
Track campaign tasks, hours logged, and tasks completed next to campaign performance data.
Align team effort with campaign results in one place.
Use Rovo-powered insights to get recommendations on how to improve performance.

✨ Haven’t used it yet? Try the free trial now and see your GA4 metrics directly in Jira.