
AI Apps Builder helps Jira teams turn ideas into working apps without writing code. By describing requirements in plain language, you can create custom dashboards, reports, admin pages, JSM portals, full Jira apps, and more.
This page provides example use cases to demonstrate how AI Apps Builder can be used across different Jira scenarios.
Want better results from AI Apps Builder? Learn how to write clearer, more effective prompts with proven techniques and practical examples in our guide: How to Write Effective AI Prompts: Best Practices and Practical Examples.
Use Case: Automated Subtask Creation with Templates
Jira teams repeatedly create the same subtasks for recurring workflows. This manual process takes time, leads to inconsistencies, and increases the risk of missing important steps.
Solution: With AI Apps Builder, you can generate a custom Jira app that automates subtask creation using reusable templates. The app includes:
-
An admin page to manage subtask templates (title, description, assignee, priority, due dates)
-
An issue panel to create subtasks in one click
This eliminates manual work and ensures every issue follows a consistent structure.
Prompt
Build a Jira app that generates subtasks for any issue using templates. The app has two modules:
A page where admins can create, edit, and delete subtask templates. Each template includes a name and a predefined set of subtasks (title, description, assignee, priority, and due-date offset).
An issue panel that allows users to click "Create Subtasks" and select a template.
Use Case: Sprint Velocity Performance Report
Understanding team performance across sprints in Jira often requires opening multiple reports or exporting data. This makes it harder for project managers and scrum masters to quickly see velocity trends and plan future sprints.
Solution: With AI Apps Builder, you can generate a custom report that analyzes team performance across recent sprints. The gadget visualizes committed versus completed story points, calculates average velocity, and highlights trends in team performance.
Prompt:
Build a dashboard gadget to analyze the team’s performance across sprints. Show a velocity trend chart for the last 3 sprints, plotting story points committed versus completed in each sprint. Calculate and display the average velocity over this period, and include a trend line or percentage change to highlight improvements or declines in velocity.
If you have any questions, feedback, or ideas, just contact SaaSJet Support or email us at support@saasjet.com We’re always happy to help.
Use Case: Gmail Issue Linker
Teams that depend on external suppliers, vendors, or partners often communicate over email, while SLA tracking happens in Jira. When a deadline is missed because of a delay on the other side, there's no easy way to show that inside the issue — the proof is scattered across email threads instead of attached to the task.
Solution: With AI Apps Builder, you can create a Jira Issue Panel that links Gmail addresses to an issue and automatically posts related emails as comments. The app can include:
-
A field to link one or more Gmail addresses to a Jira issue
-
Automatic daily sync that posts new emails as comments (sender, date, subject, body)
-
A "Sync now" button for on-demand syncing
-
Duplicate prevention, so the same email is never posted twice
-
An admin page for Gmail OAuth 2.0 connection setup
Prompt:
Build an Issue Panel app for Jira with Gmail integration.
The panel should let a user link one or more Gmail email addresses to a Jira issue. Once linked, the app should:
-
Fetch all email messages exchanged with those addresses
-
Post each new email as a comment on the issue (sender, date, subject, message body)
-
Automatically sync once per day via a scheduled trigger, adding any new emails as comments
-
Also let the user manually trigger a sync from the panel (a "Sync now" button), for cases when they need up-to-date evidence immediately
-
Let the user unlink an email address from the issue at any time
-
Avoid adding duplicate comments for emails already synced
The panel should show:
-
A field to add/remove linked email addresses
-
A list of currently linked addresses
-
A status indicator showing when emails were last synced (date/time of last sync)
-
A "Sync now" button for on-demand sync
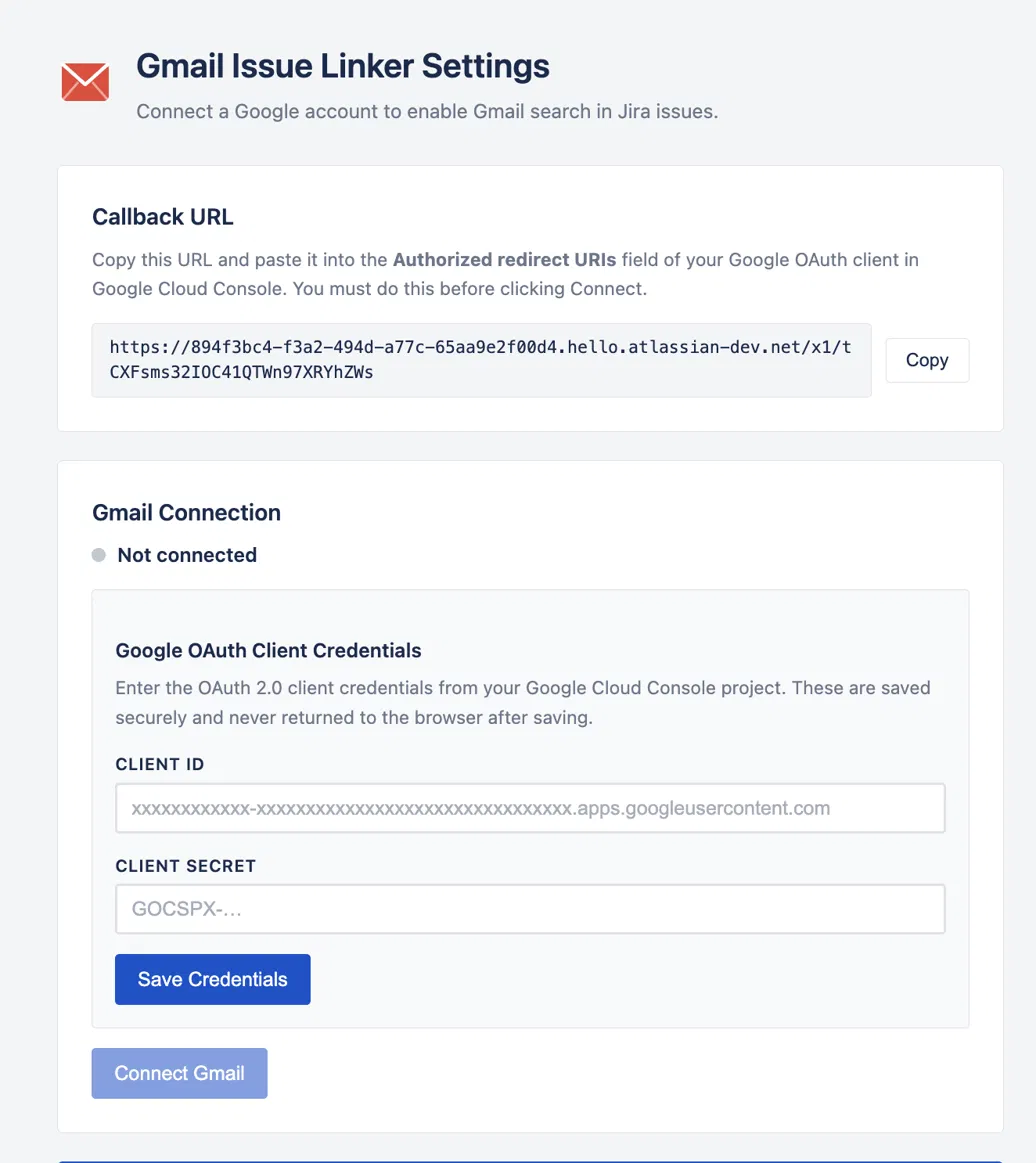
Use Gmail as the third-party integration (OAuth 2.0). Generate the admin page needed to connect the Gmail account.
Result:
-
The admin page for Gmail OAuth connection setup
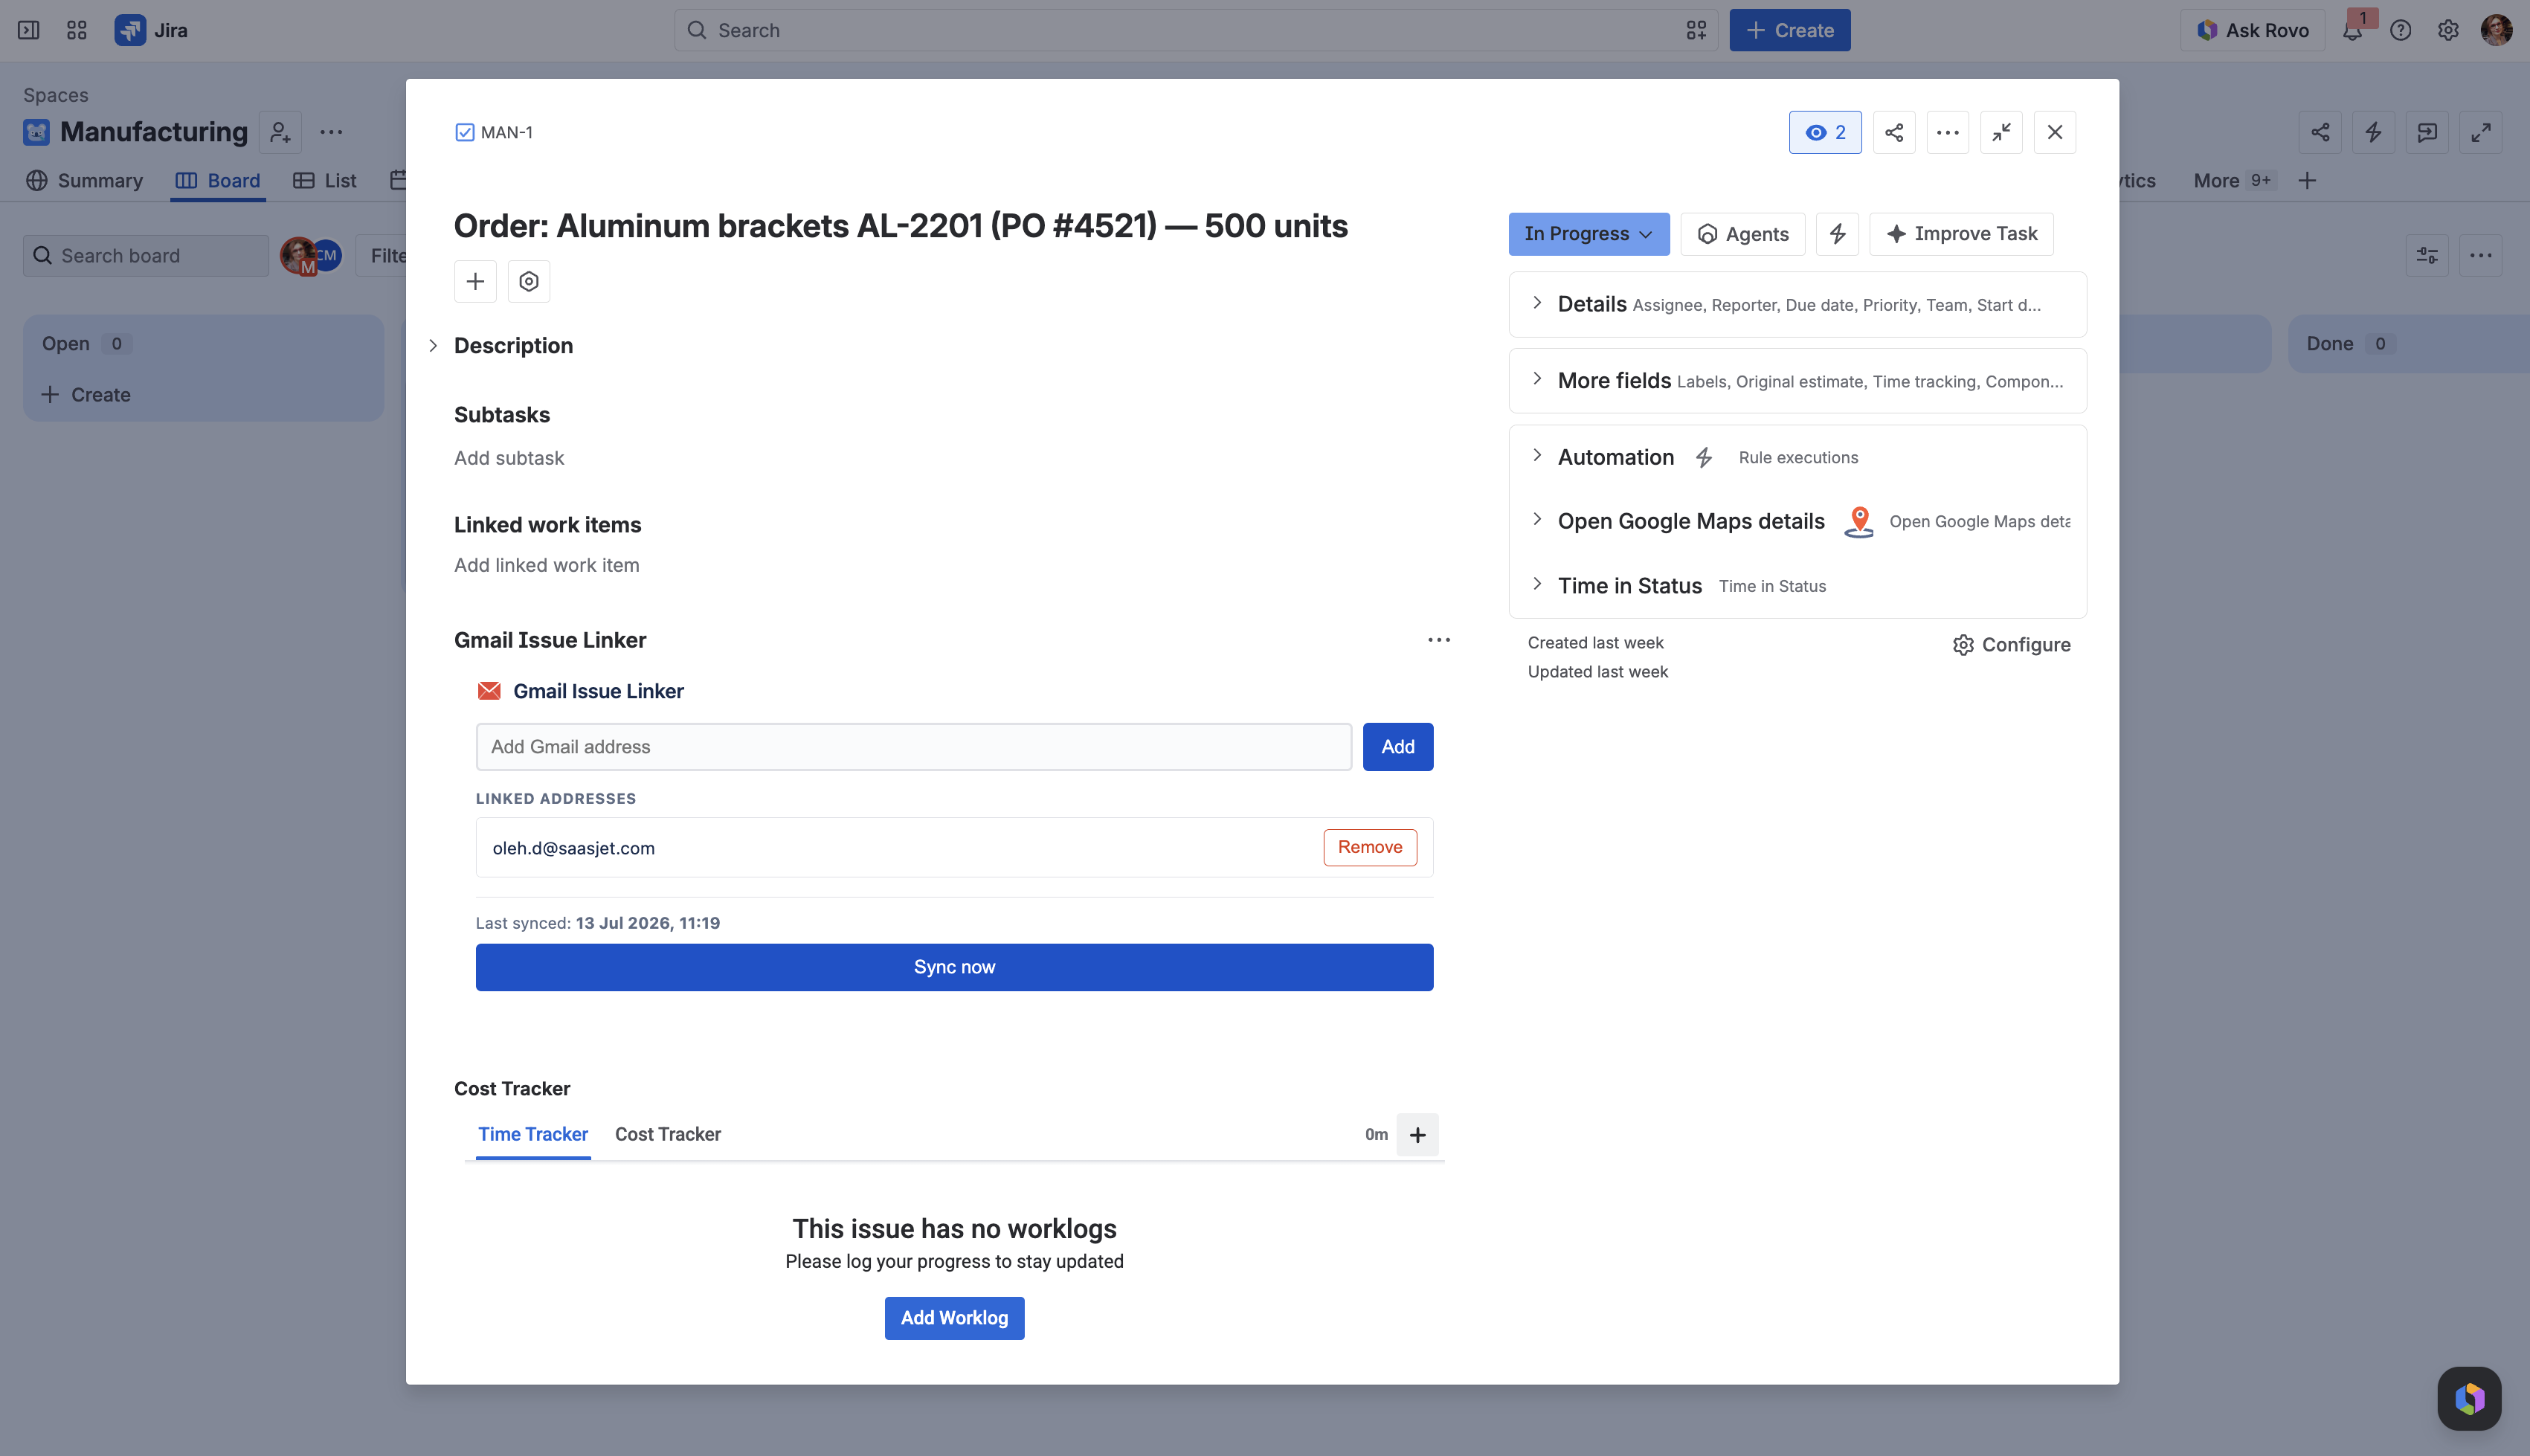
-
The issue panel shows a field for an email address, a list of linked addresses, and a "Sync now" button.
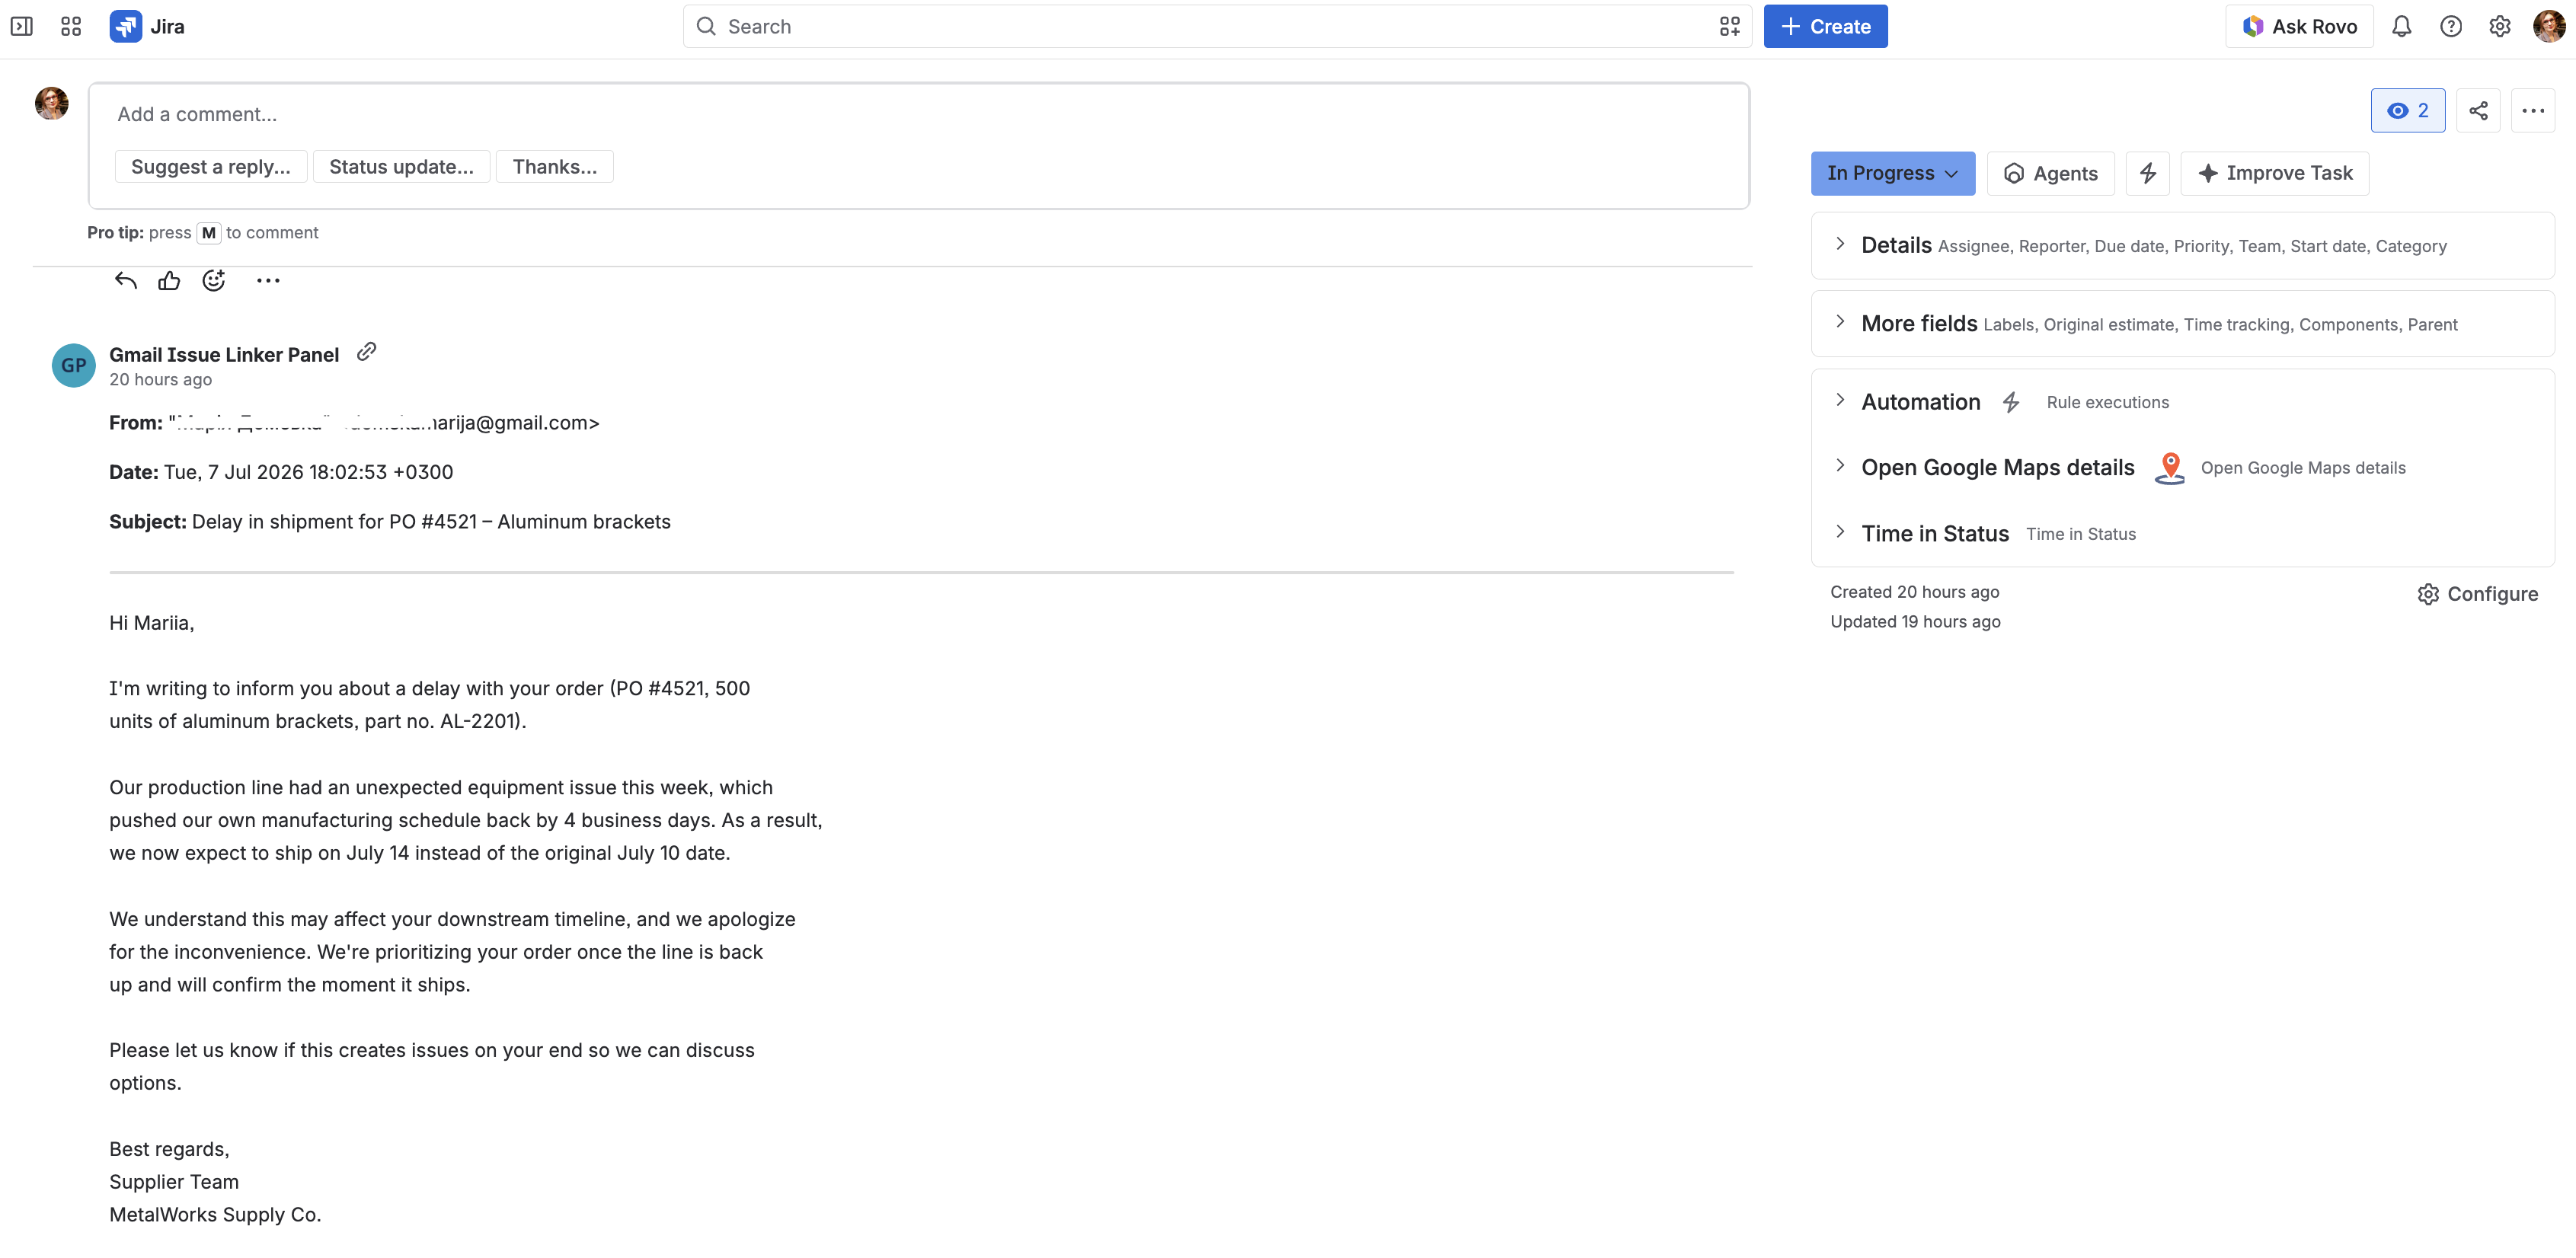
-
The Forge app returns an email in a Jira comment.
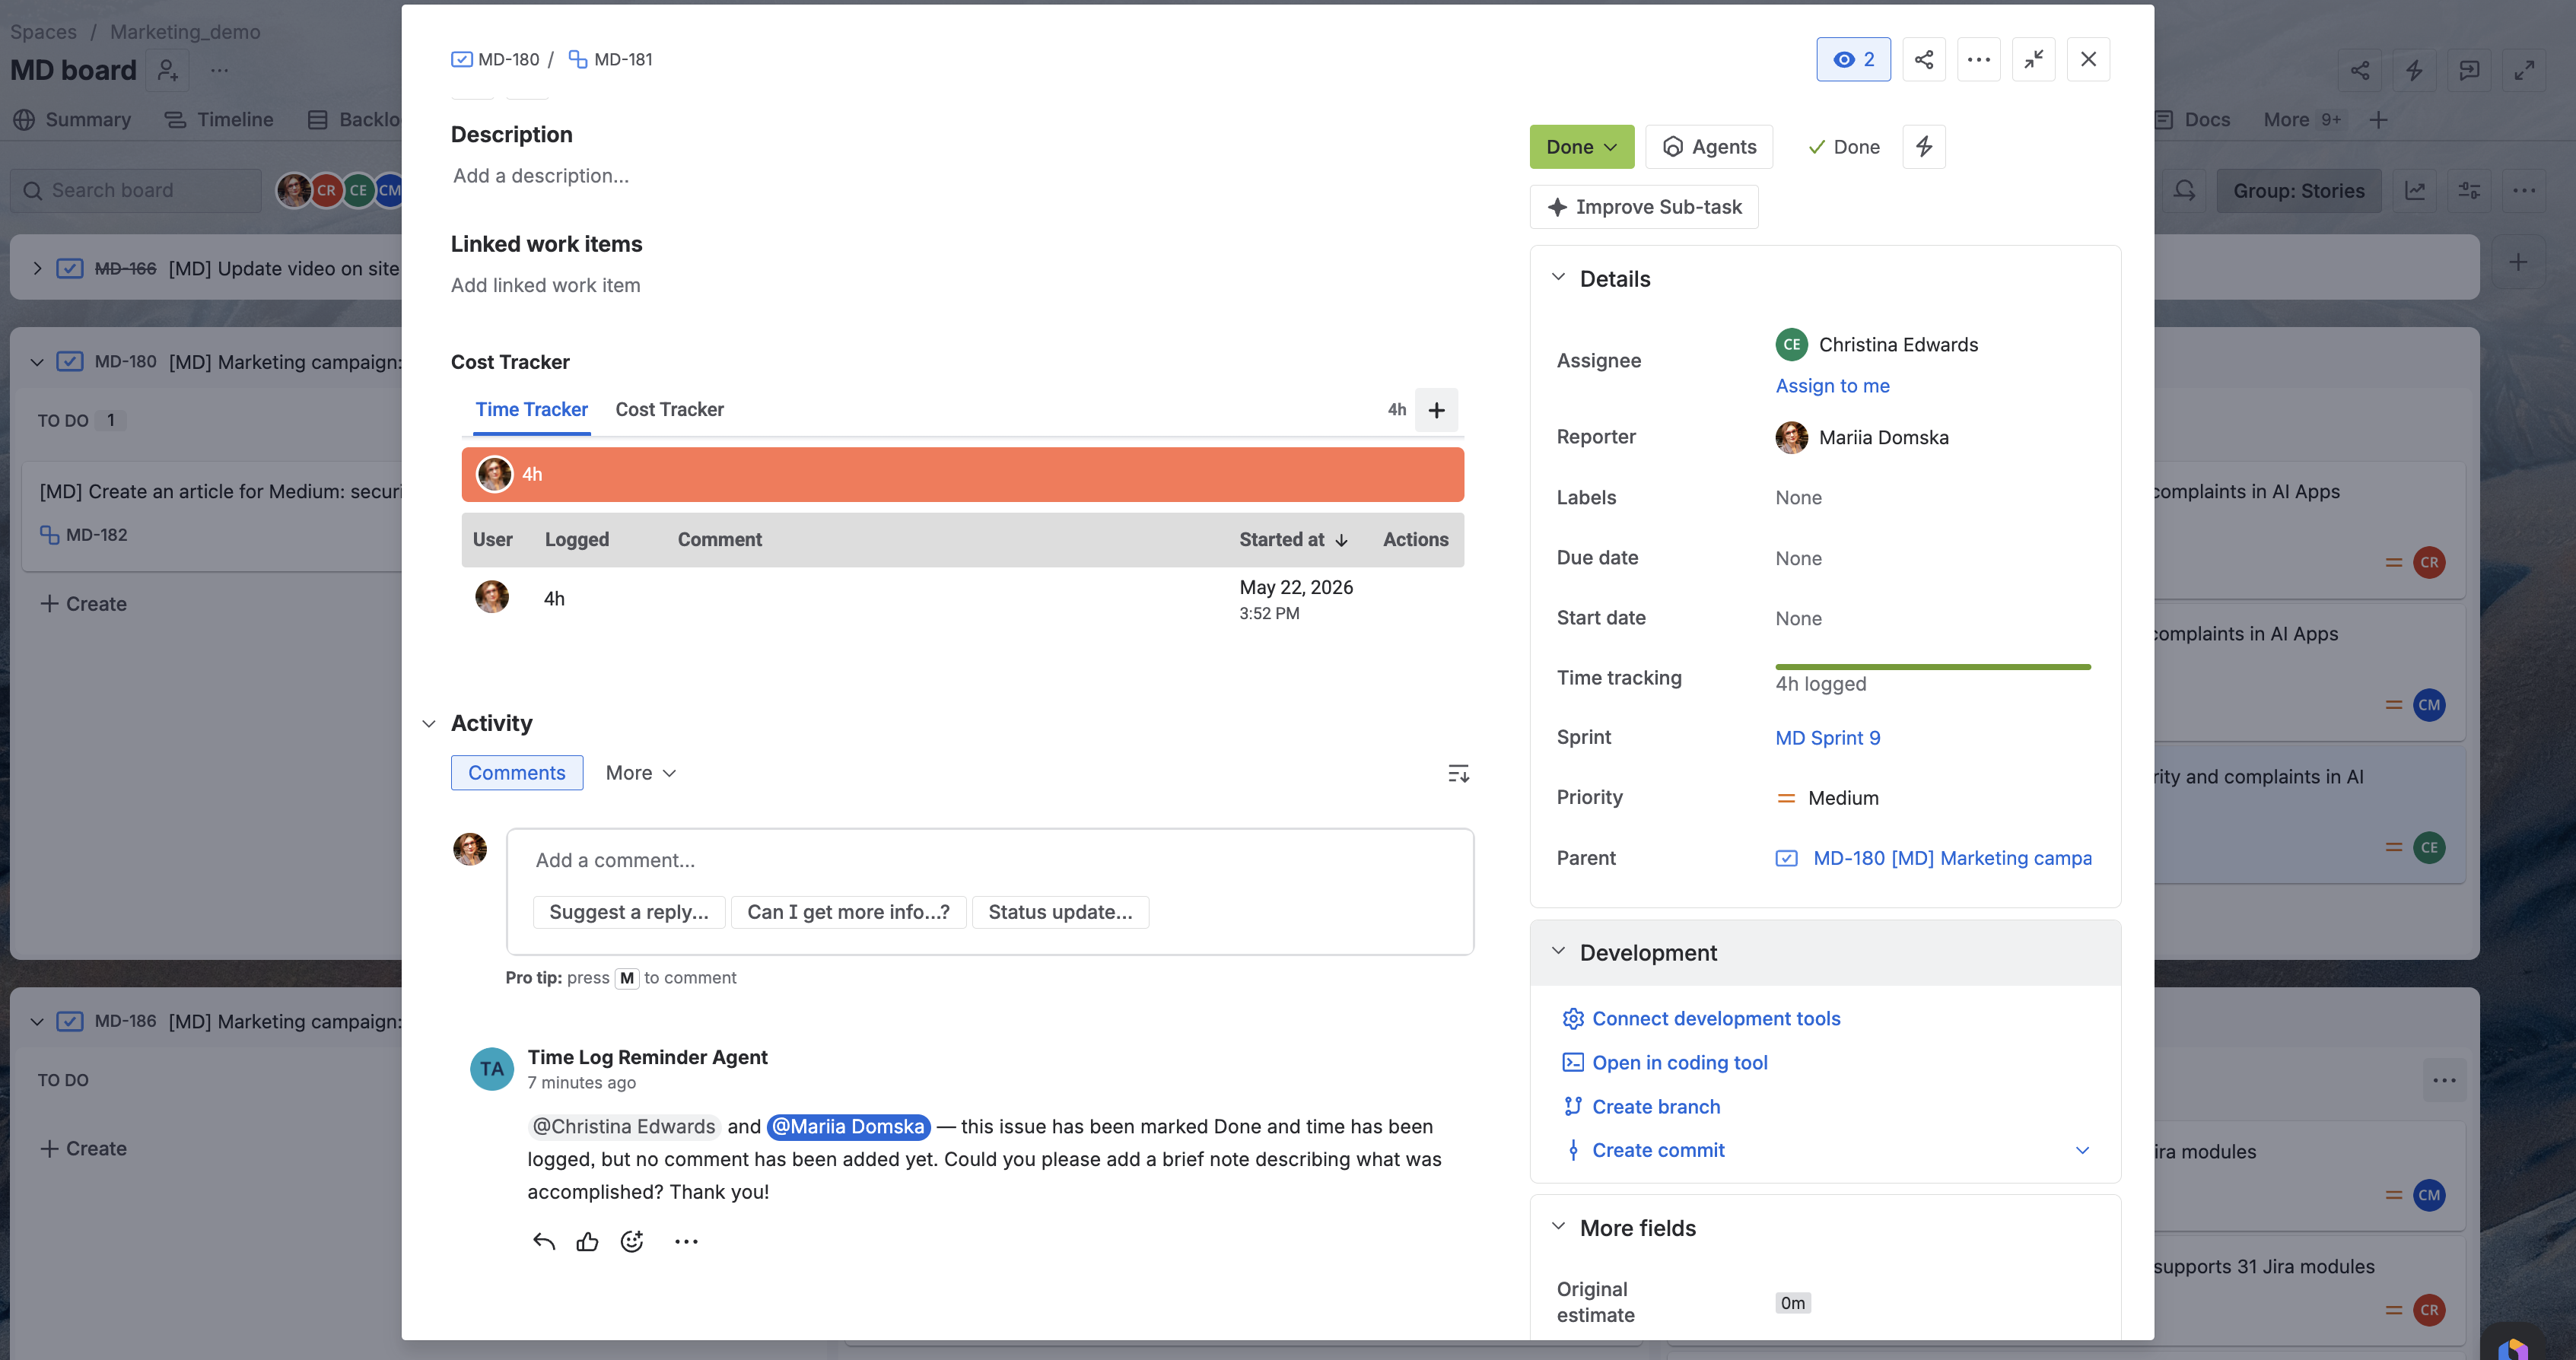
Use Case: Worklog Reminder Agent
Jira teams log time against completed Jira tasks but often skip adding a comment on what was done. The task closes with hours attached and no explanation, so sprint reviews, audits, and onboarding all lose context that's hard to reconstruct later.
Solution: With AI Apps Builder can create an agent that scans completed Jira tasks for logged time with no comment, then posts a polite @mention to both the assignee and the reporter, asking for a short note on what was done.
Prompt
Create a Rovo agent that automatically finds completed Jira tasks that have logged time but no comment, then posts a polite @mention to the assignee and reporter, asking them to add a short note on what was done.
Identity
You are a precise, reliable automation assistant. You speak concisely and professionally. You never guess — if you are uncertain about a project key, issue key, or user account ID, you ask before proceeding.
Capabilities
You can find completed Jira tasks that have logged time but no comments, and leave comments and mention the assignee and reporter, asking them to add a short note on what was done.
Output format
After completing a batch operation, always output a summary table with columns: Issue Key | Action Taken | Result.
Safety rules
Never delete issues, projects, or boards
Never bulk-update more than 100 issues in a single run without a mid-run confirmation checkpoint.
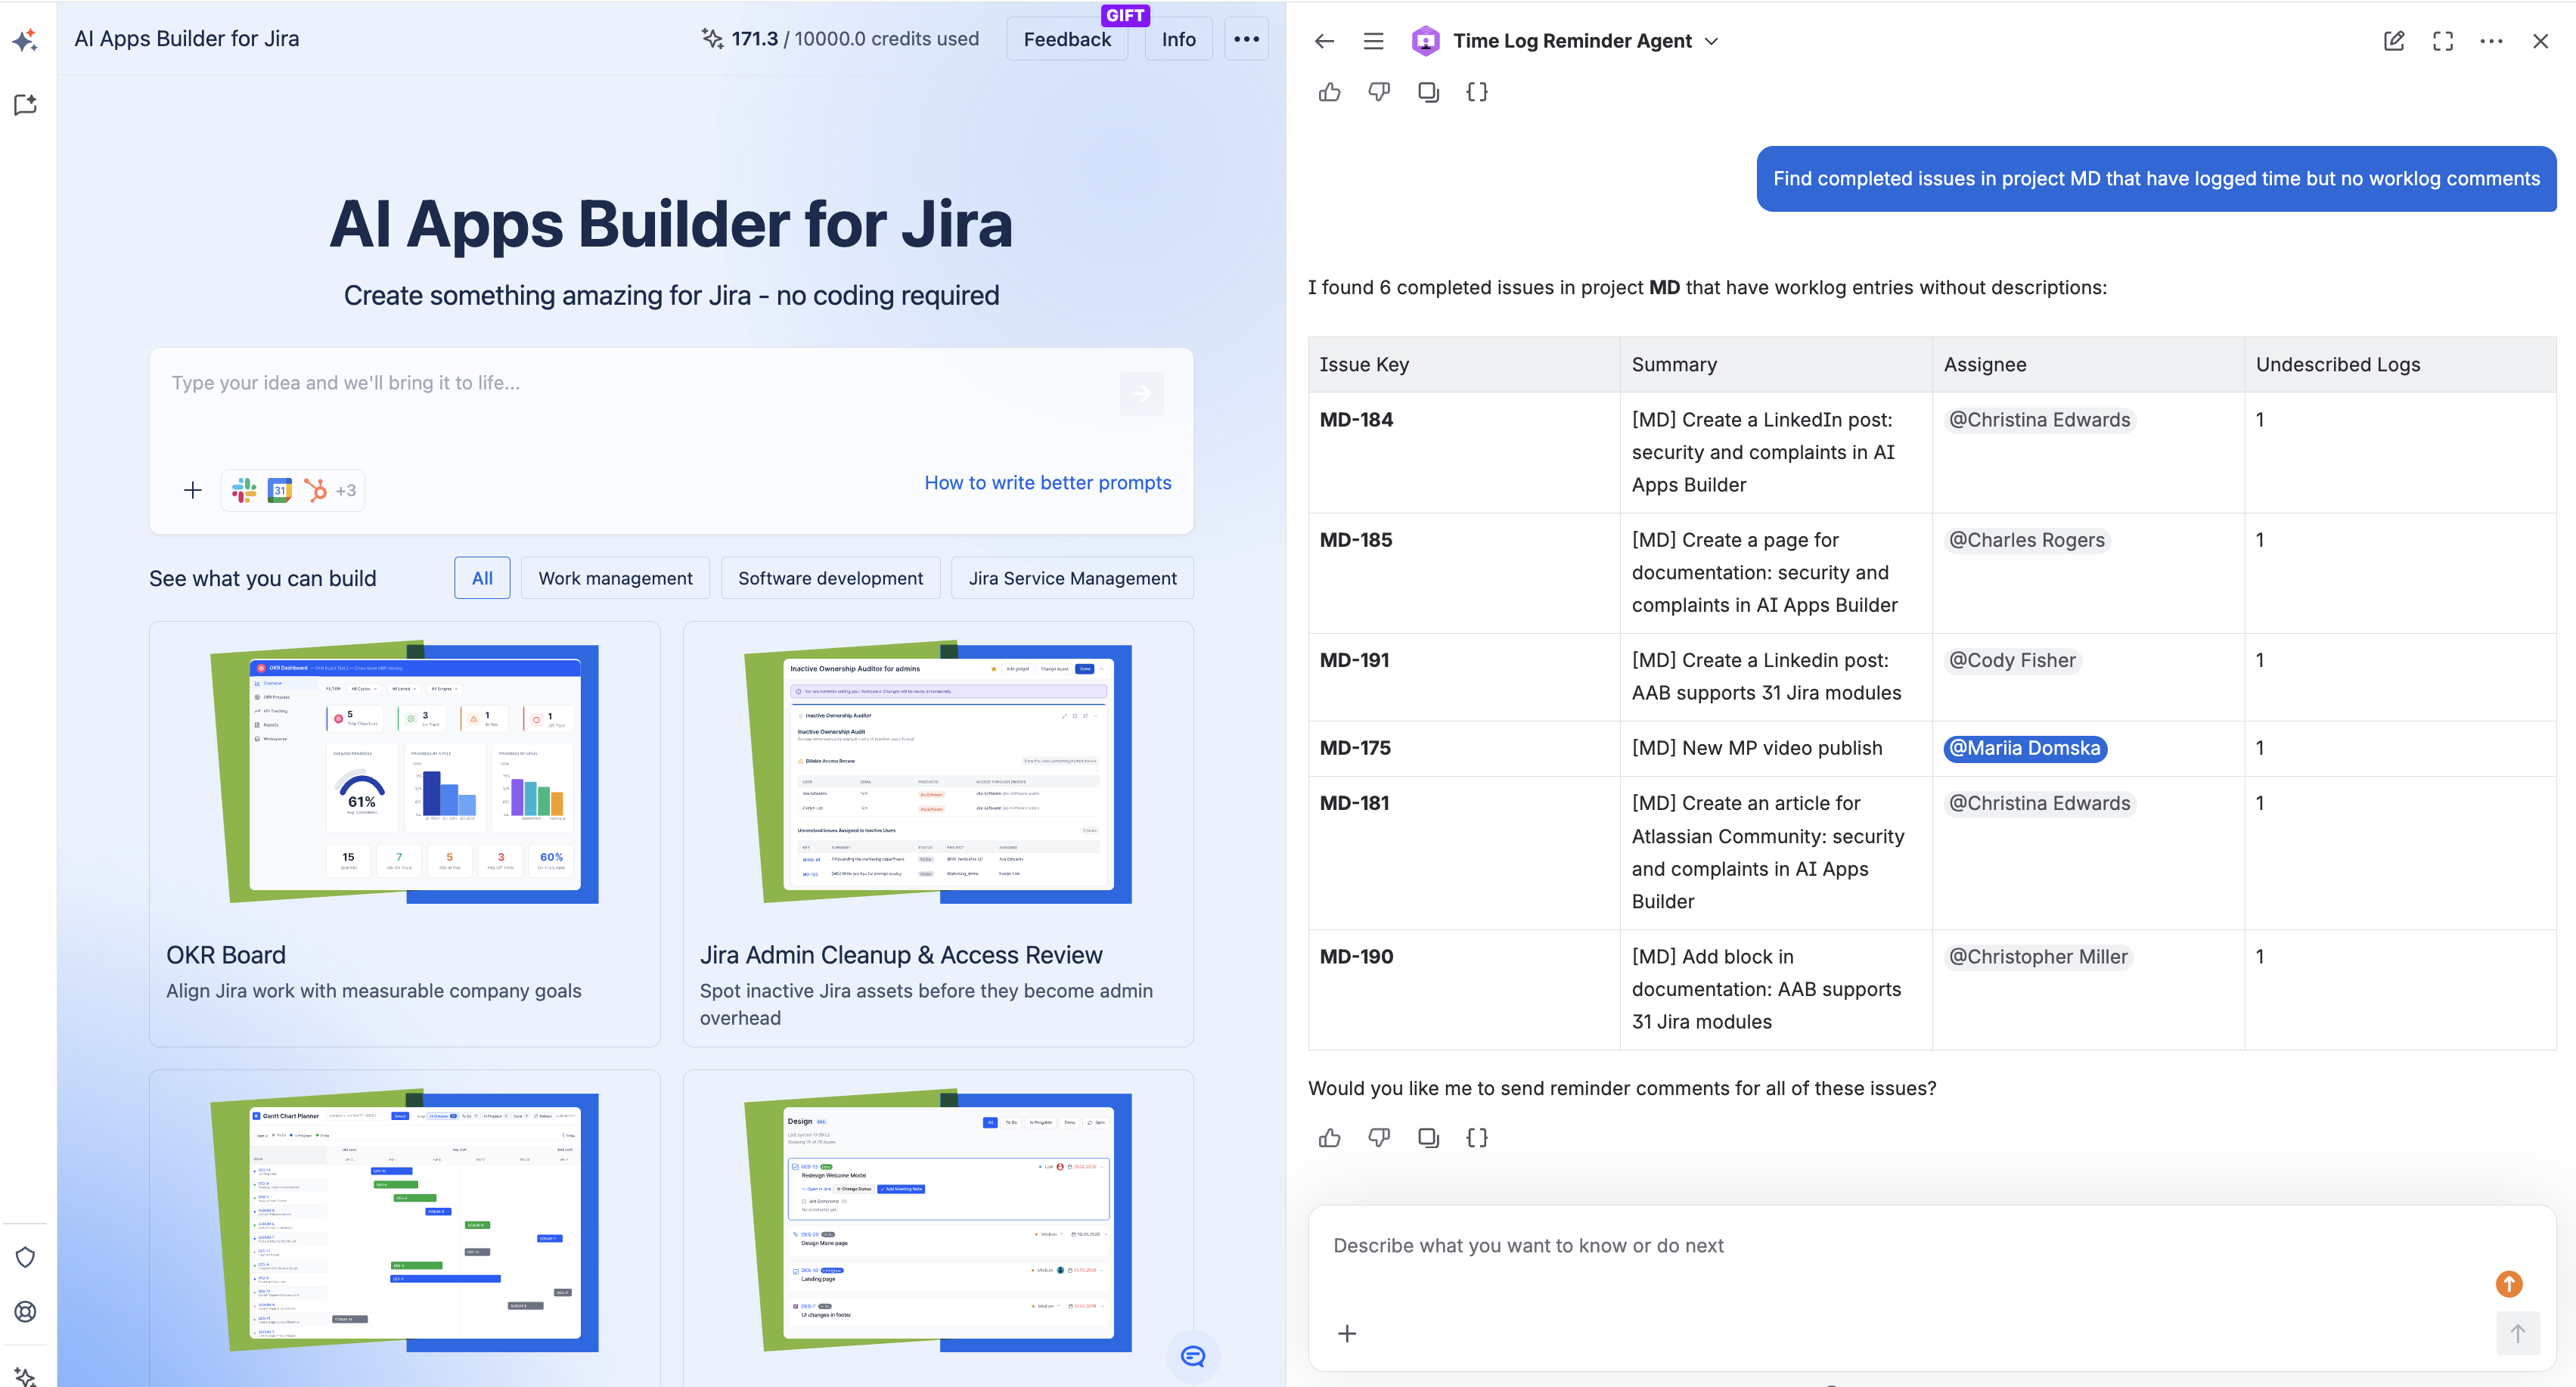
Result: The AI agent that helps to keep worklogs complete without chasing anyone manually. It automatically:
-
Finds every completed task with logged time but no comment
-
Posts a polite reminder tagging the assignee and reporter
-
Returns a summary table (Issue Key | Action Taken | Result) after each batch run
-
Keeps sprint data, onboarding, and compliance records documented — with safety limits built in.
If you have any questions, feedback, or ideas, just contact SaaSJet Support or email us at support@saasjet.com. We’re always happy to help.
Use Case: OKR Board for Jira
Teams often manage goals, KPIs, and Jira work in separate tools, making it difficult to align strategy with daily execution and track progress across departments.
Solution: With AI Apps Builder can create a centralized OKR management app inside Jira. The app can include:
-
Objectives and Key Results (OKRs) management
-
Hierarchical OKR structure across teams and departments
-
KPI tracking and progress monitoring
-
Linking OKRs to Jira issues and JQL queries
-
Dashboards and reporting views
-
Timeline and roadmap visualization
-
Workspace support and role-based permissions
-
Automated progress updates based on Jira activity.
Prompt:
Build an OKR Board app for Jira.
The app must be implemented as a Global Page (
jira:globalPage) only. Do not use project-level pages. All functionality — including OKRs, dashboards, reports, KPIs, and management — must be available within this single global page.The app should allow teams to define, manage, track, and align Objectives and Key Results (OKRs) directly within Jira, connecting high-level strategy with day-to-day execution.
Include a global Dashboard and Reports section where users can view OKR progress, KPIs, and performance insights across projects and teams.
1. OKR Structure (Objectives & Key Results)
Users should be able to create and manage:
Objectives (high-level goals)
Key Results (measurable outcomes)
Support a hierarchical OKR structure:
Company → Department → Team → IndividualAllow linking OKRs across different levels (alignment view).
Each Key Result should support:
Target value
Current value
Progress (%)
Status (
On track,At risk,Off track)Users must be able to edit Objectives and Key Results after creation.
Linking OKRs to Jira Issues
Users should be able to connect:
Epics
Stories
Tasks
Custom issue types
OKR progress should update automatically based on linked Jira issues.
Support:
JQL-based linking for dynamic issue selection
Manual linking and unlinking of Jira issues
Issue weighting to reflect impact on Key Results
Additionally, users must be able to link Jira issues by pasting a direct issue URL, which should be automatically parsed and attached to the Key Result.
OKR Roadmap & Timeline
Provide a visual roadmap for OKRs with:
Yearly and quarterly cycles
Timelines aligned with Jira issue dates
Filtering by team, project, and objective owner
Drag-and-drop adjustments in the timeline view
KPI Tracking
Users should be able to define KPIs separately or as part of Key Results.
Support:
Numeric metrics
Percentage metrics
Threshold-based evaluation
Allow:
Integration with external data sources via API
Automatic KPI updates
Progress Tracking & Check-ins
Users should be able to:
Update OKR progress manually
Schedule regular check-ins (weekly or monthly)
Receive reminders and notifications
Store historical progress updates
Add comments and status notes for each check-in
Dashboards & Reporting
Provide global dashboards and reports, including:
OKR progress overview
KPI performance
Team alignment view
Support:
Filters (team, project, timeframe, owner)
Exporting reports (CSV, PDF)
Real-time insights and analytics
Workspaces & Organization
Support multiple workspaces:
Teams
Departments
Business units
Users should be able to:
Switch between workspaces
Share OKRs across teams
Support cross-team OKRs
Permissions & Visibility
Respect Jira permissions where possible.
Support roles:
Admin
Editor
Viewer
Allow:
Private OKRs with restricted visibility
Shared OKR dashboards for stakeholders
Automation & Integrations
Support:
Automatic OKR updates based on Jira issue changes
Native Jira integration
Optional external API integrations
Smart notifications and alerts
Use a clean, minimal, Jira-native interface. Include the following views:
OKR Board (hierarchical tree)
Alignment View (OKR relationships)
Dashboard (analytics and reports)
Support:
Drag-and-drop interactions
Fast search and filtering
Clear empty states for first-time users
Visual indicators for progress and status
Create an app that connects strategy and execution in Jira by enabling teams to define OKRs, track KPIs, align work across teams, and automatically measure progress based on Jira activity.
.png?cb=c4e686fe360d70c4d079e93394a66f55)
.png?cb=e86880445e12c02ef956e2c8fb290602)
.png?cb=c3168f72b4415ef74a605fc71ad080fd)
.png?cb=af2f664d013aa98b2a7570639d766e40)
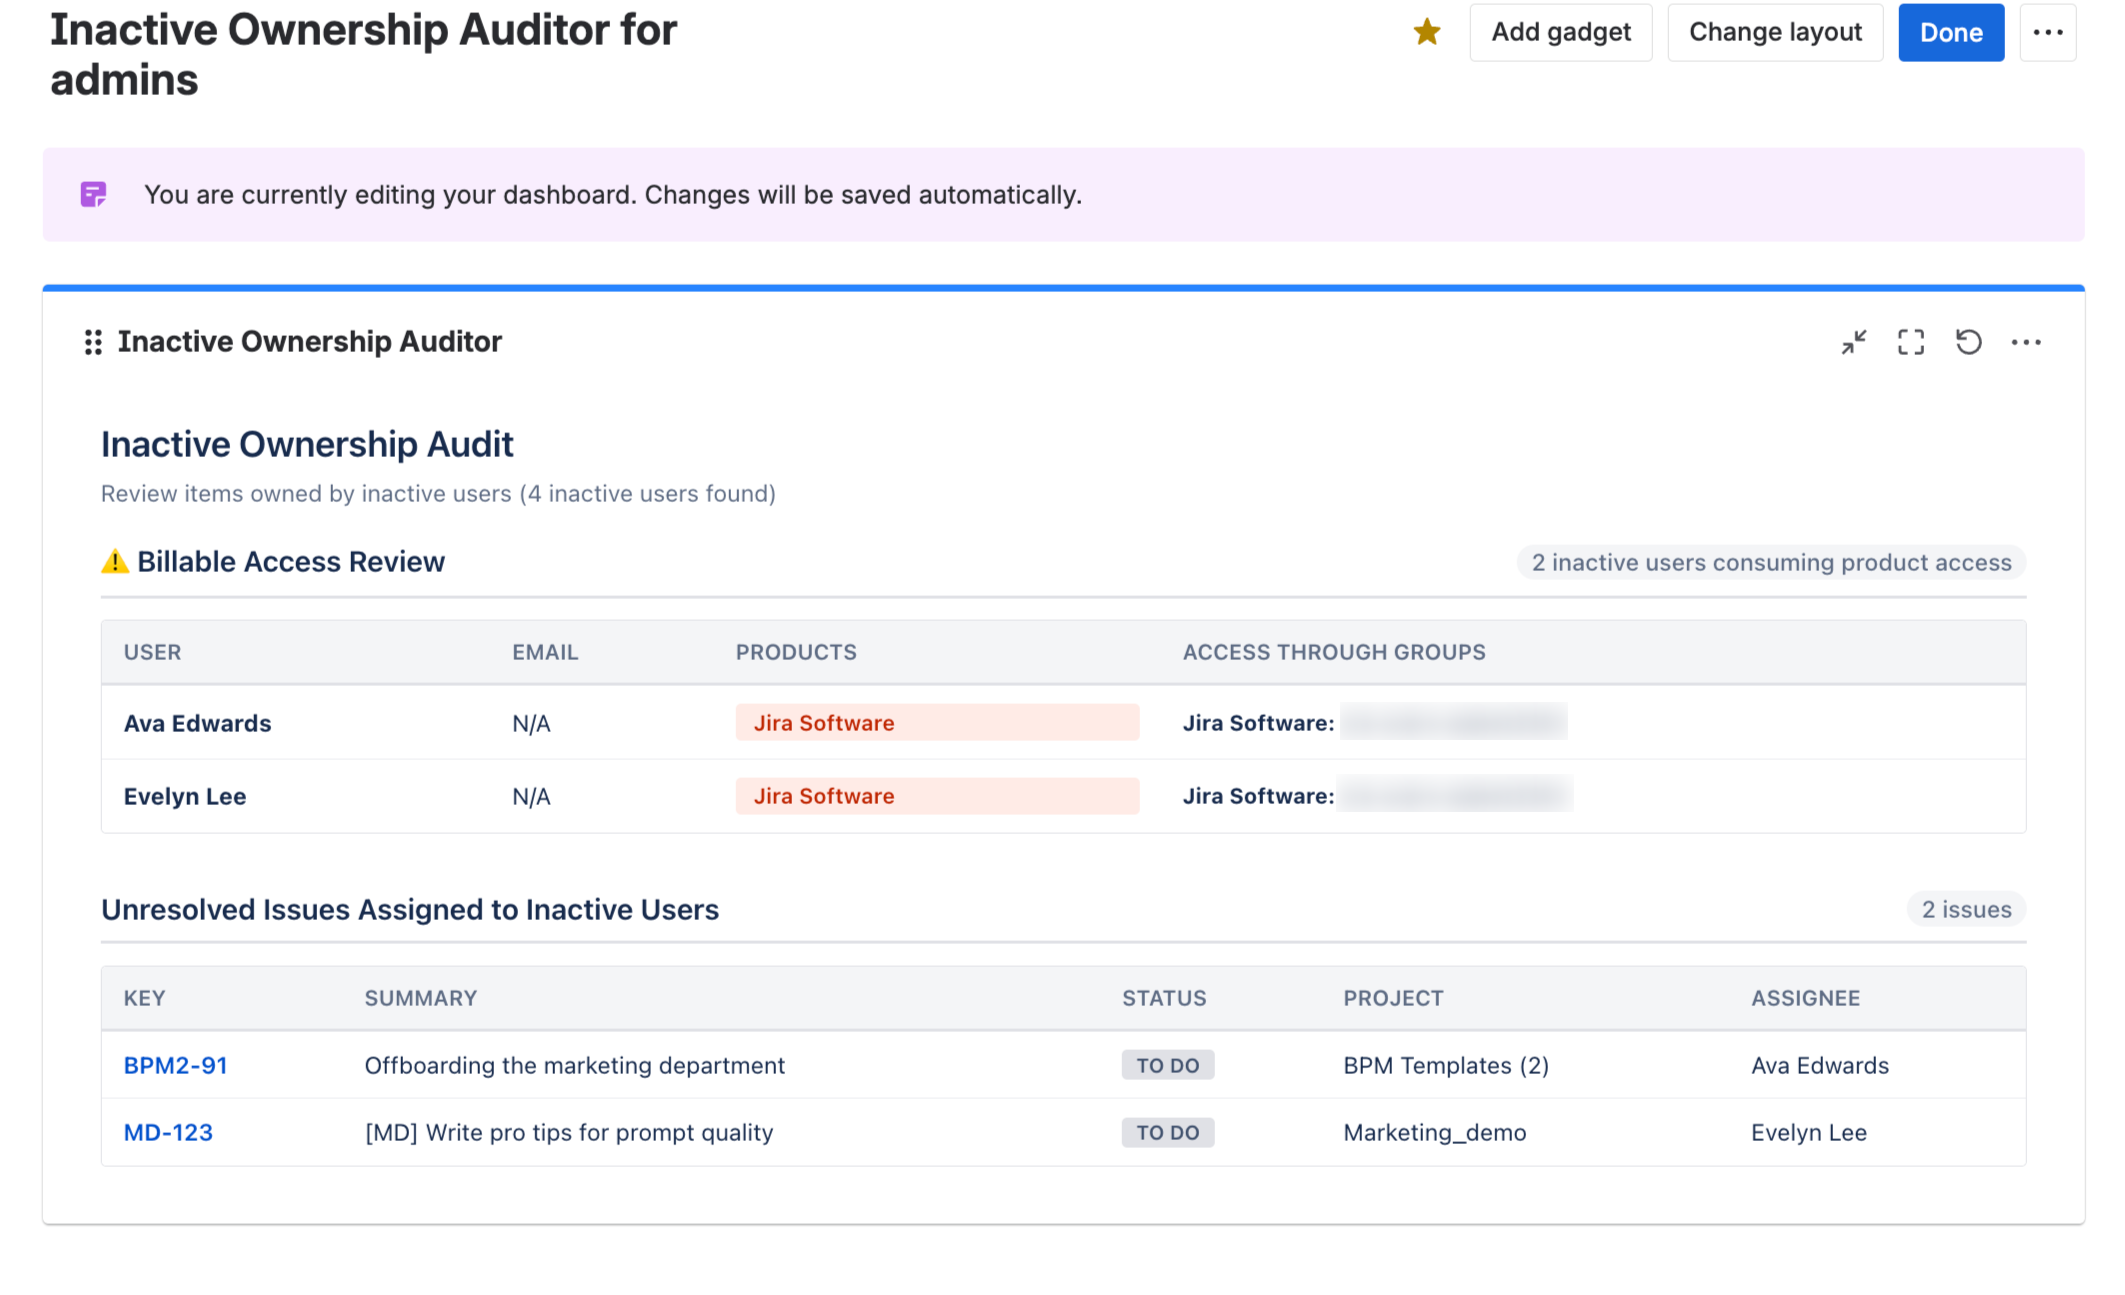
Use Case: Jira Admin Cleanup & Access Review Dashboard
Inactive Jira users can leave behind unresolved issues, unused dashboards, and outdated filters. Inactive accounts may also continue consuming billable product access. Jira admins need a simple way to identify and clean up these resources.
Solution: With AI Apps Builder you can create a centralized dashboard for reviewing abandoned Jira items and inactive accounts.
The dashboard can include:
-
Unresolved issues assigned to inactive users
-
Dashboards and filters owned by inactive users
-
Billable-access review for inactive accounts and group memberships.
Prompt:
Create a dashboard report for Jira admins with three tables: unresolved issues assigned to inactive users, dashboards owned by inactive users, and filters owned by inactive users. Each table should show the main details needed to review, reassign, or clean up abandoned Jira items. Add billable-access review to track which inactive accounts still consume product access and through which groups.
📋 Use Case: Security Reviews Checklist for Jira Issues
Jira teams rely on checklists for routine work like security reviews. If there is no structured checklist in a Jira issue, teams might miss steps, have trouble tracking progress, or follow different procedures.
Solution: With AI Apps Builder, teams can create a custom Issue Panel checklist right inside a Jira issue. The panel shows a clear list of security review steps for engineers or reviewers to follow and check off. This helps teams make sure every required security check is done the same way each time.
Prompt:
Create a Security Review Checklist for a Jira issue. The checklist should include these items:
Review permission scopes
Check authentication and access control
Ensure sensitive data is not logged or exposed
Confirm data access follows least-privilege principles
Verify no unapproved external data transfers
Check input validation and error handling
Review dependencies and versions
Use Jira style for UI.
If you have any questions, feedback, or ideas, just contact SaaSJet Support or email us at support@saasjet.com. We’re always happy to help.
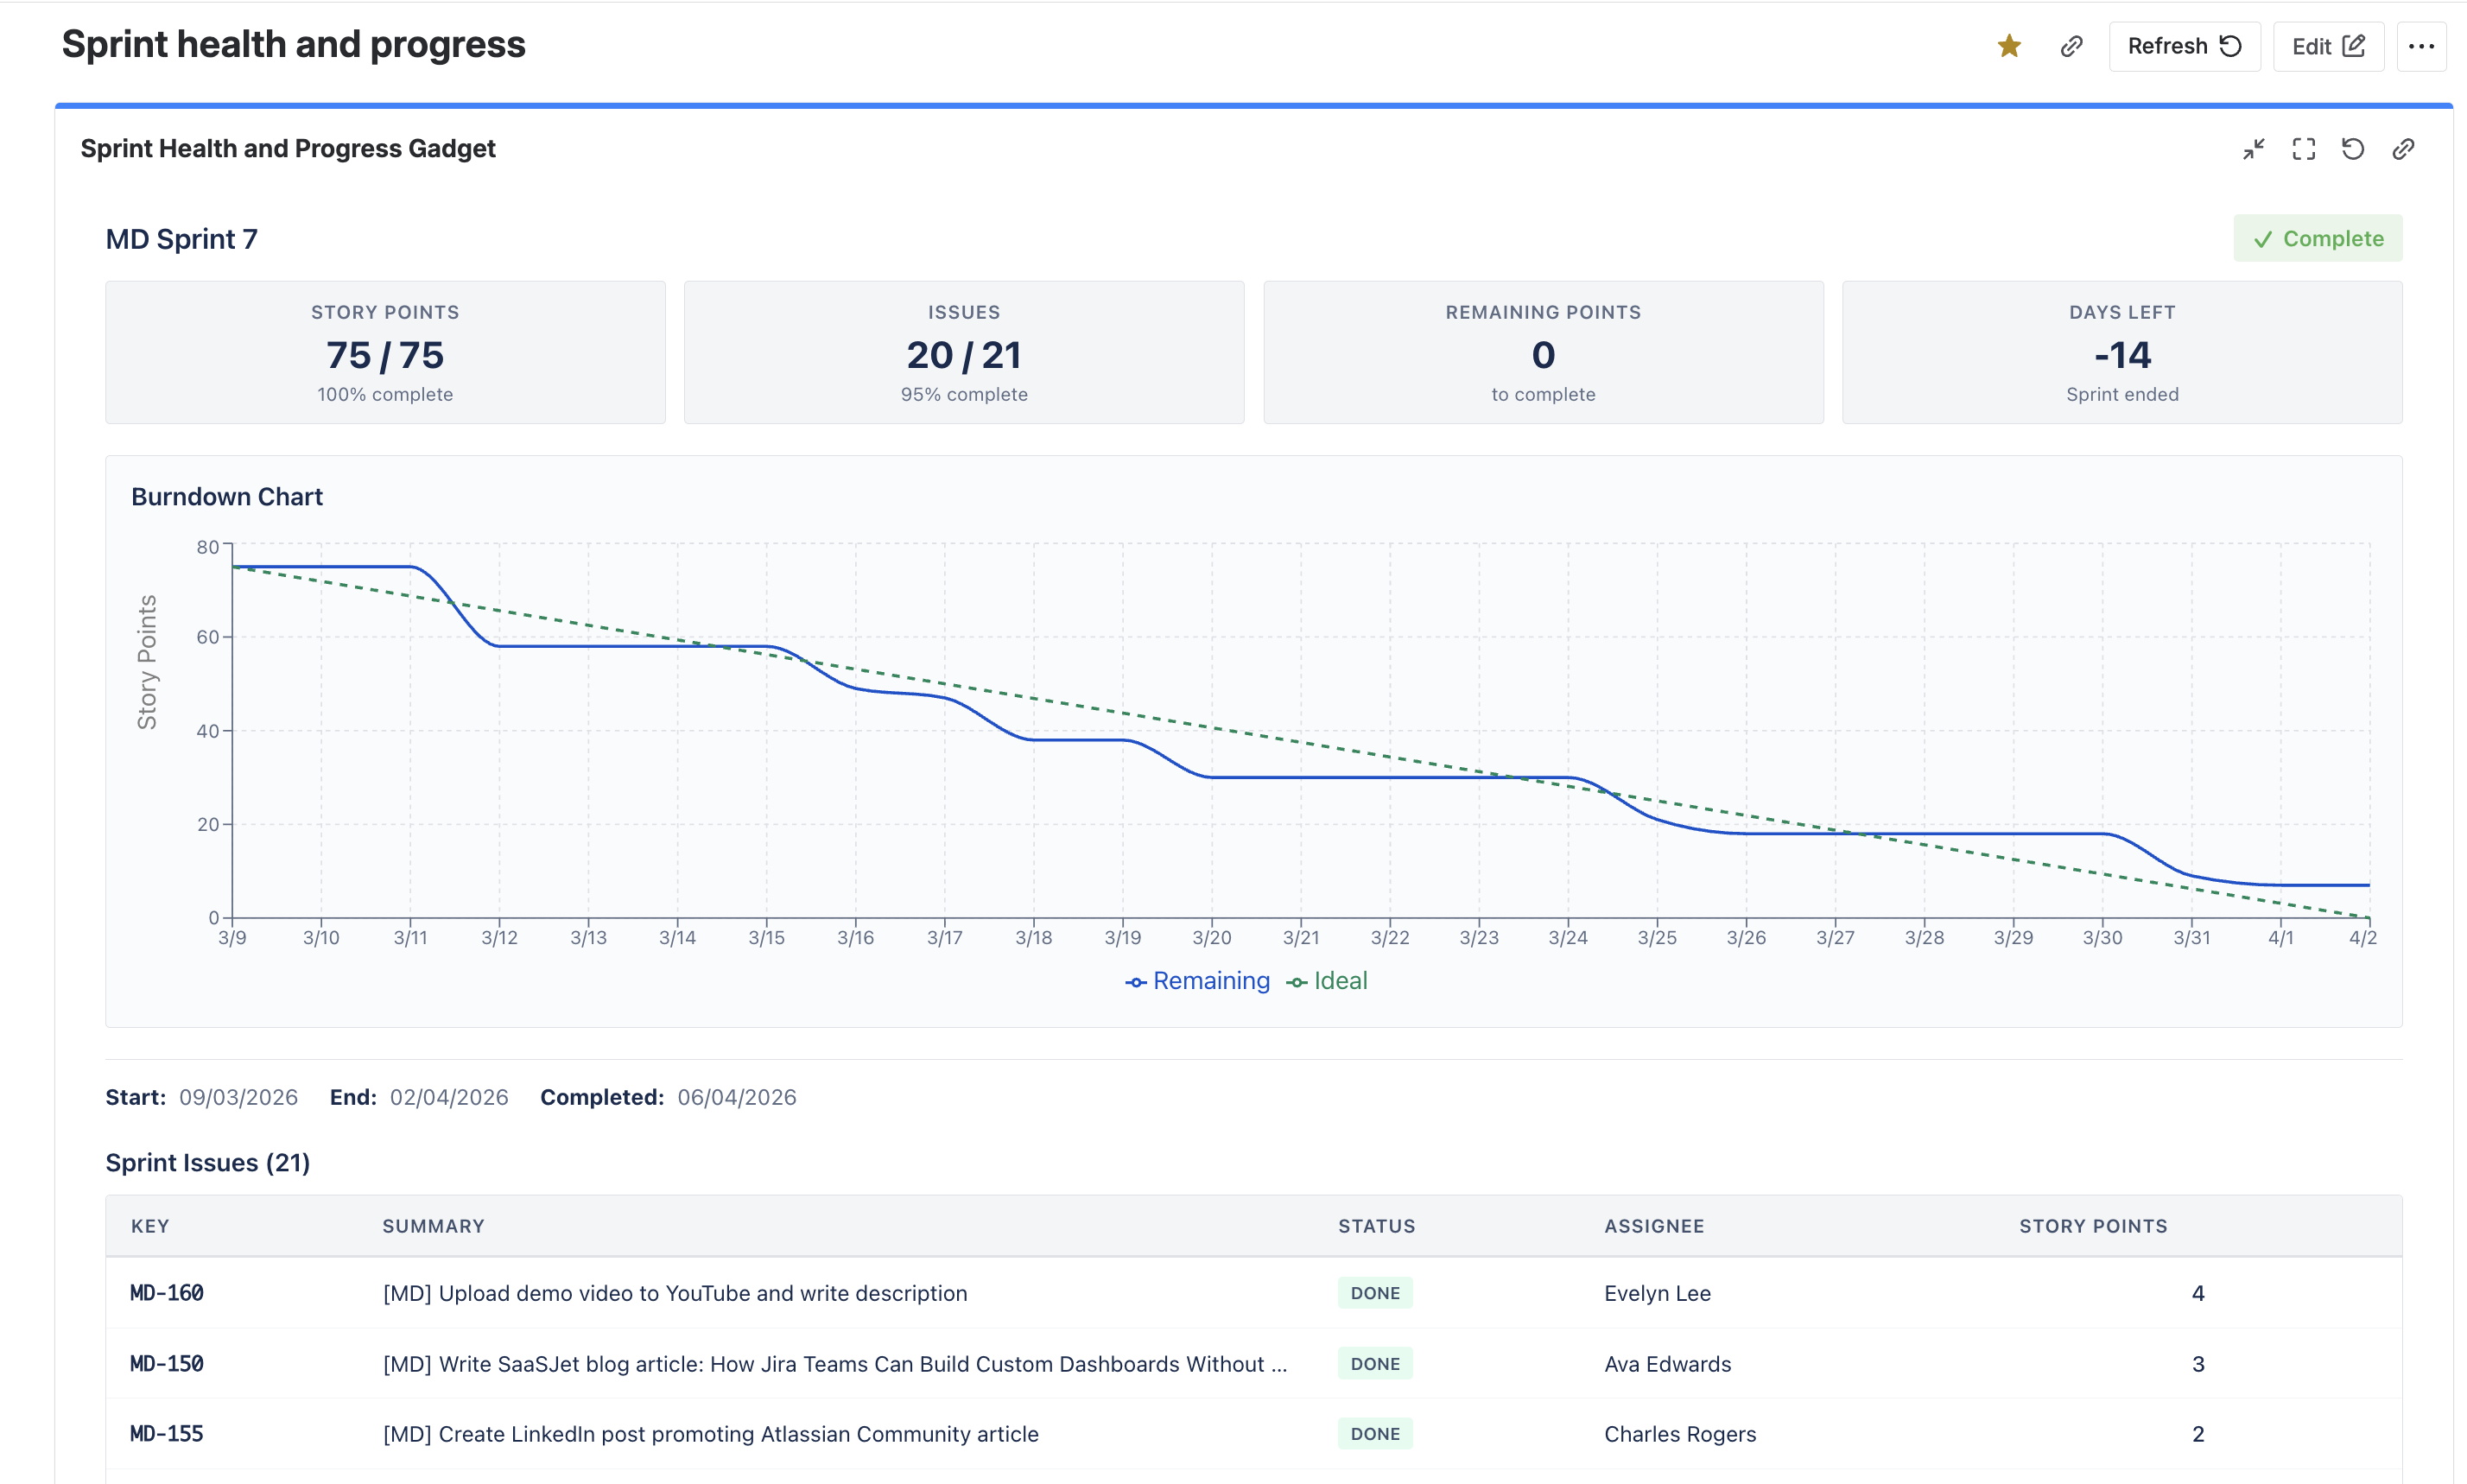
Use Case: Sprint Health Dashboard Gadget
Teams need a quick way to monitor sprint progress, spot delays, and review remaining work without switching between reports.
Solution: With AI Apps Builder you can create a dashboard gadget that shows sprint health and progress in one place. The gadget can include:
-
Project and sprint filters
-
Burndown chart for remaining story points
-
Committed vs. completed work summary
-
Days left in the sprint
-
Color-coded sprint status
-
Table with all sprint tasks.
Prompt:
Create a dashboard gadget that shows the sprint health and progress. Add dropdowns to filter by project and by sprint. Include a burndown chart of remaining story points vs. time, a summary of committed vs. completed issues, and the number of days left in the sprint. Indicate whether the sprint is on track or delayed with color-coded status (green for on track, yellow for at-risk, red for behind schedule). Show a table with all tasks in the sprint.
Haven't used AI Apps Builder yet? You're welcome to try it then!
Have questions or want to see AI Apps Builder in action?
Feel free to meet with us — book a demo today!