
|
📝 Context: Reports are essential tools used at various levels to detail data and evaluate progress and productivity. They help uncover workflow intricacies, ensure efficient and timely work, and verify resource allocation. To create comprehensive reports, different teams use metrics such as story points, time in status, and other issue fields. |
|---|
|
🤔 User Problem: Teams struggle to customize and generate meaningful reports that provide insights into their workflows. They need a flexible and powerful tool to create detailed, customizable reports that reflect their specific needs and help them identify areas for improvement. |
|---|
Customizing Regularly Grid Time in Status Report
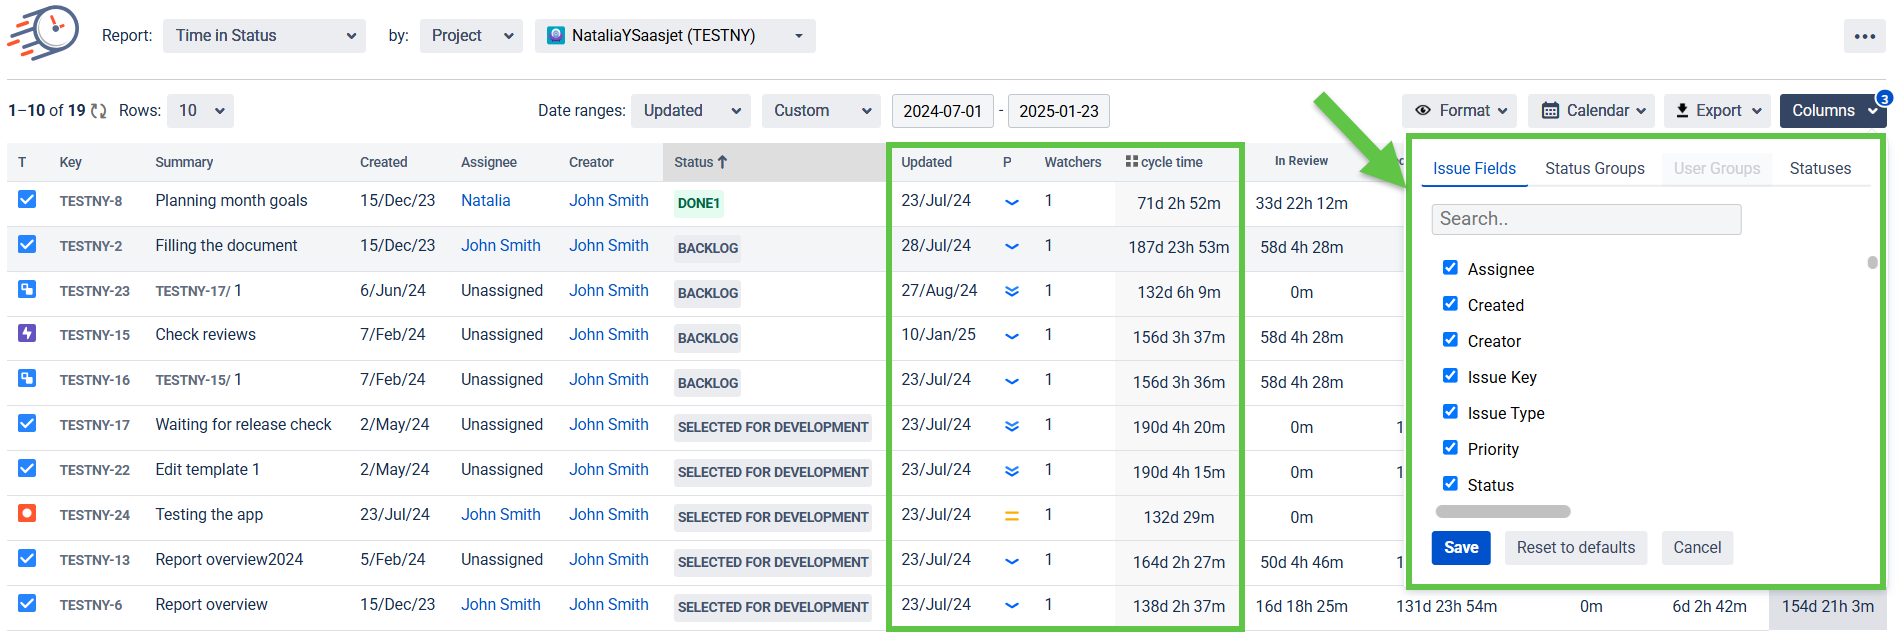
Regular Time in Status, Average Time, etc., reports can be customized by adding additional columns to the grid, allowing users to access more information with just a few clicks.
You can choose which Jira issue fields to display on the report using the Column Manager in the right corner.
Status Group Creation - Lead and Cycle Time, Resolution Time, Wait Time, etc.
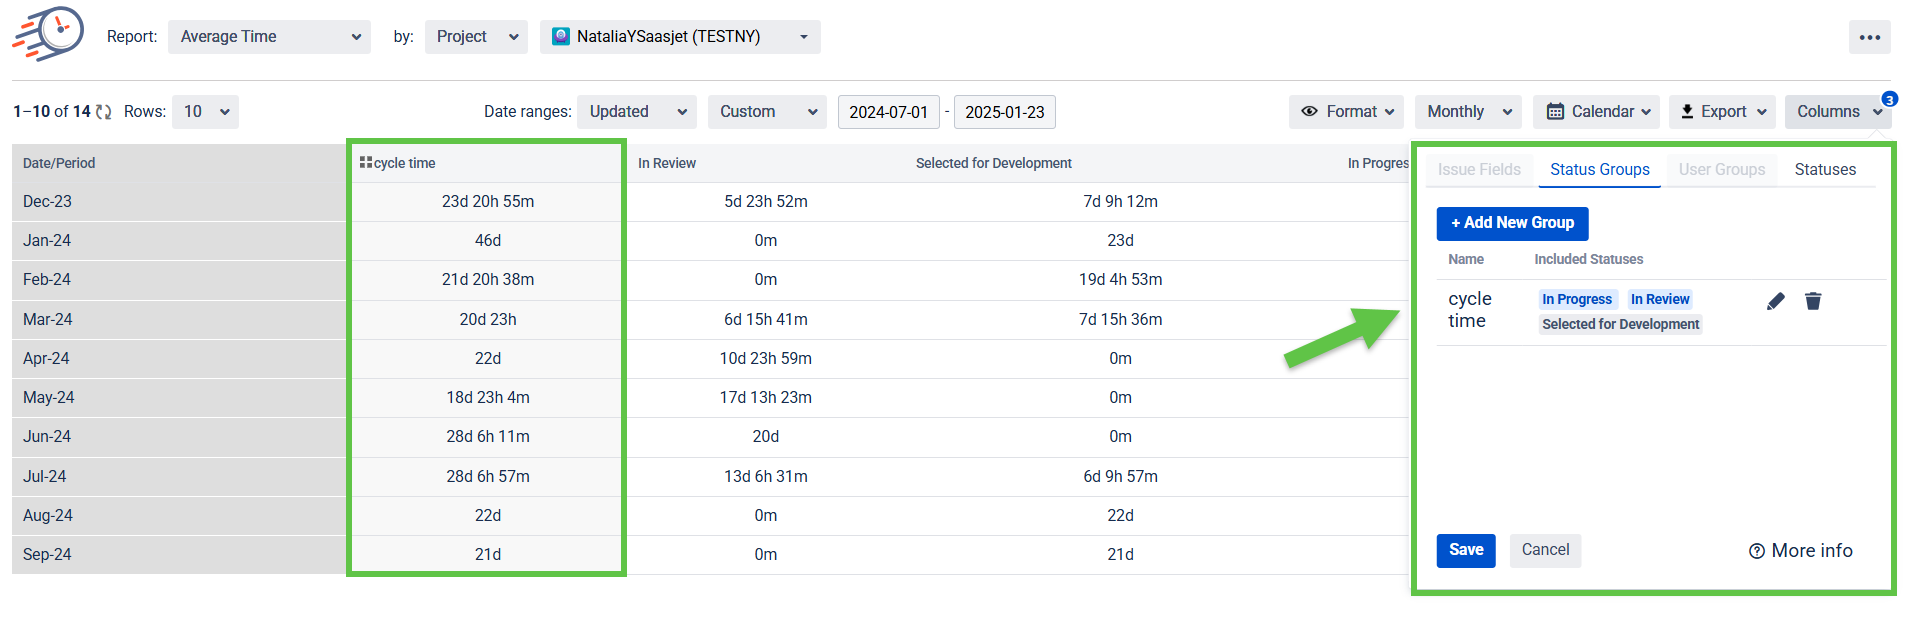
Status Group is an opportunity to calculate various time metrics related to the broad concept of Delivery Time (Lead & Cycle, Time to First Response, Time to Fix Bug, Time to Resolution, etc.)
All you need to do is to define, according to your Jirs workflow, which metrics you want to calculate and what statuses they should contain. Then, in the same Column Manager, you organize them into Status Groups and immediately see them displayed on the grid.
If you select the Average Time report, for example, the report will show you the average value of these time KPIs.
Stay Up-to-Date with Dashboard Gadgets for Real-Time Reporting
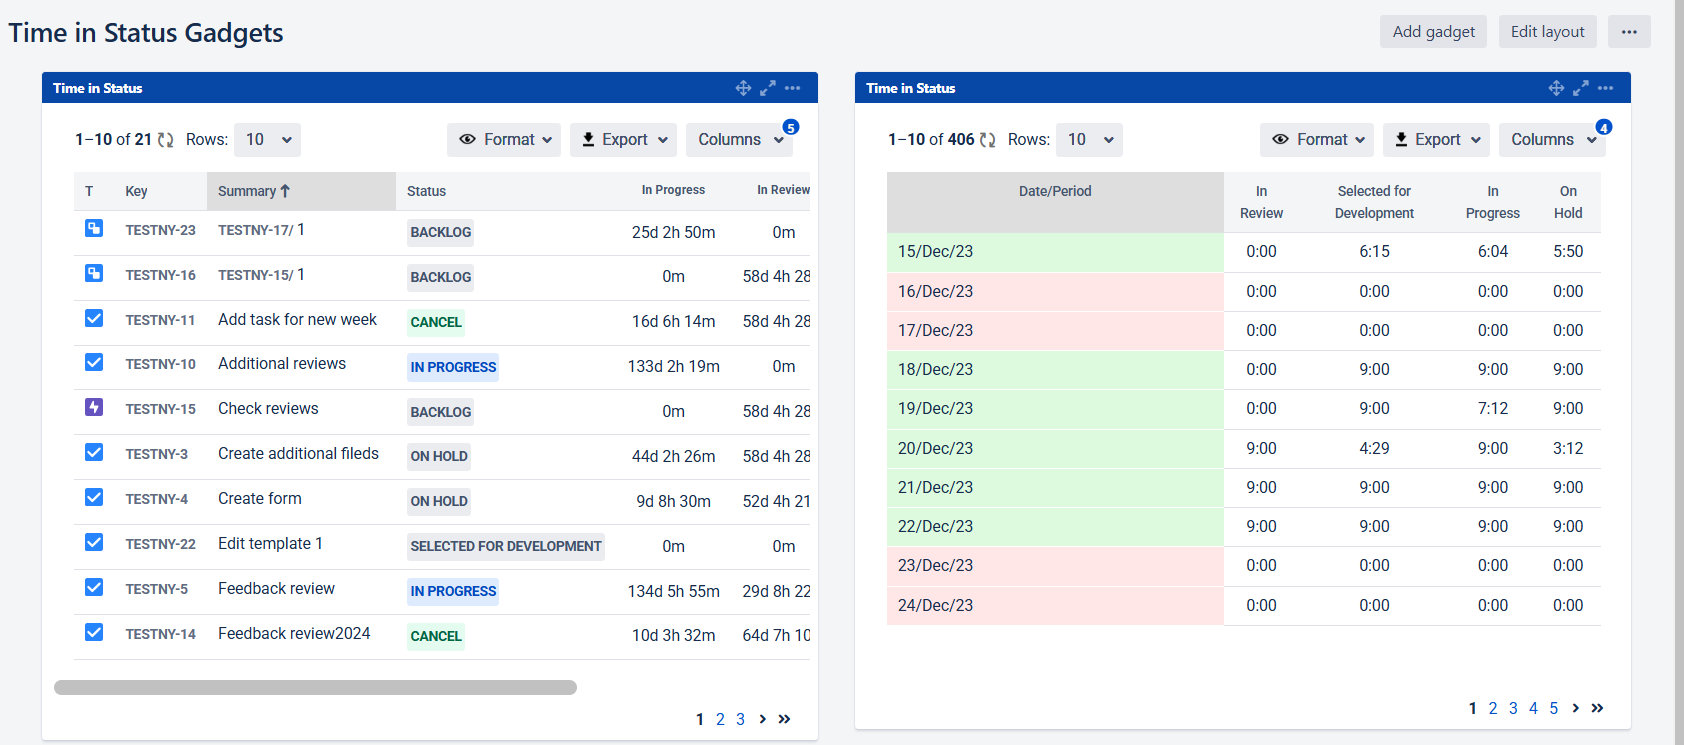
It's hard to overestimate the popularity and convenience of Jira Dashboard. This is also a reporting tool, just in a smaller format, and designed to monitor the "health" of the project in real-time.
The Time in Status app allows you to display each of its reports as a gadget.
|
📈 Outcomes:
|
|---|
If you need help or ask questions, please contact SaaSJet Support or email us at support@saasjet.atlassian.net
Haven’t worked with the add-on yet? Give it a try