
How to Identify Aging Tasks in Azure DevOps in Minutes
In every development team, there are tasks that quietly remain in the same state for too long.
They don’t seem urgent.
They don’t trigger alerts.
They don’t block deployments.
And that’s exactly what makes them risky.
If you don’t actively identify aging tasks, they stay hidden inside your workflow - gradually increasing cycle time, delaying releases, and creating silent bottlenecks.
The real challenge isn’t tracking statuses.
It’s understanding how long work has actually been sitting in them.
That’s where Time in State for Azure DevOps becomes essential.
Step 1: Open Time in State Analytics
With the Time in State extension for Azure DevOps, you can instantly see how long each work item has remained in every workflow stage.
Instead of manually reviewing history, the report displays:
Time spent in each state
Total lifecycle duration
Transition history
Current state duration
This turns Azure DevOps from a simple status tracker into a time-based workflow analysis tool.
At first glance, everything may look normal.
But when you look closer, you can immediately see how long each task has remained in every stage.
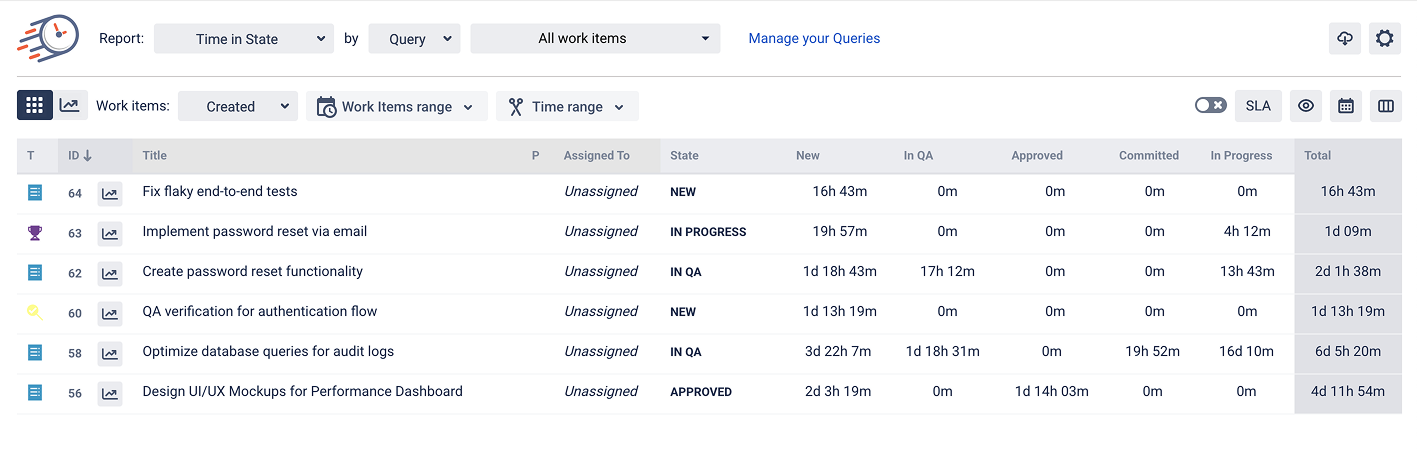
For example:
“Create password reset functionality” spent 1d 18h 43m in New
“Optimize database queries for audit logs” accumulated significant time across multiple states
Some items are still Unassigned, indicating potential ownership gaps
This is where aging becomes visible.
Step 2: Filter by Current State Duration
Inside the Set SLA panel (where you define time limits per state), you configure:
A custom label (e.g., Needs Immediate Attention, Too Long, At Risk)
The specific workflow state (New, In QA, Committed, etc.)
A time threshold (e.g., 2d 01h, 1d 05h, 6h 30m)
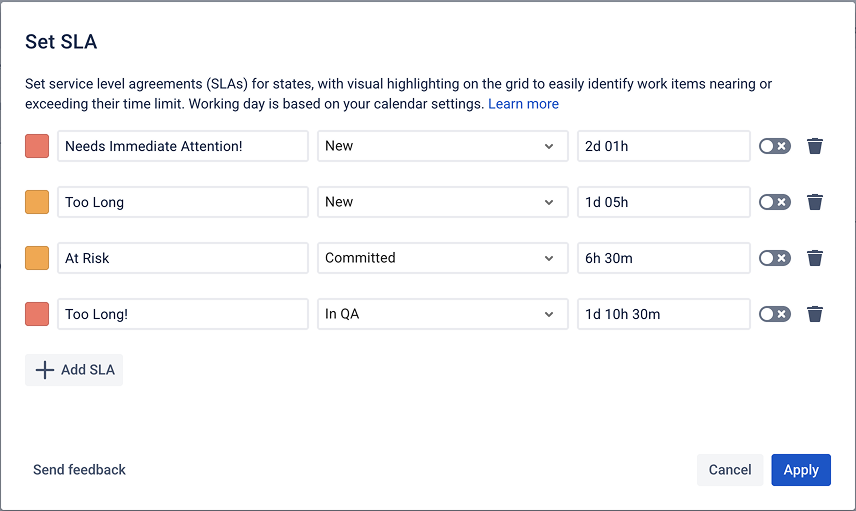
Once applied, items that exceed those thresholds are automatically highlighted.
The report shifts from passive data to active monitoring.
Instead of wondering:
“Has anything been sitting too long?”
You immediately see:
“This task has exceeded its expected duration.”
Step 3: Act Before Delays Escalate
Now, instead of scanning numbers manually, you see visual signals:
🟠 Orange cells → tasks approaching a critical threshold
🔴 Red cells → tasks that have exceeded acceptable limits
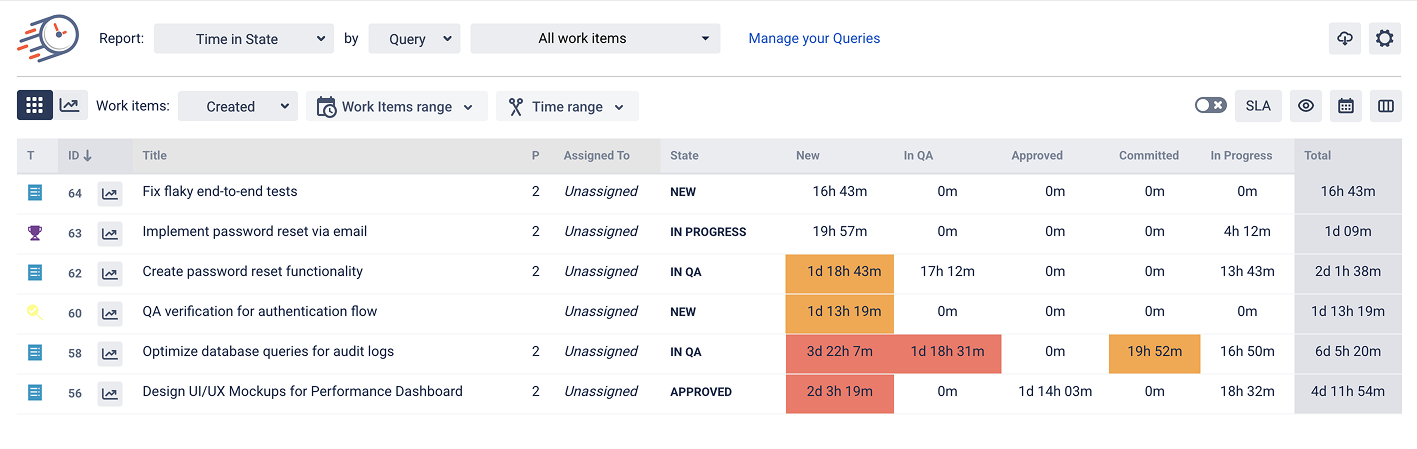
For example:
“Optimize database queries for audit logs” is highlighted in red after spending 3d 22h 7m in one state
“Design UI/UX Mockups” shows extended time in New
QA stages display prolonged durations
This visual layer makes aging tasks instantly visible, no manual calculations required.
That’s workflow transparency in action.
Once aging tasks are clearly identified, teams can:
Reassign blocked work
Prioritize long-waiting items
Escalate review delays
Improve Dev–QA handoffs
Instead of discovering issues at the end of the sprint, you address them early.
Why This Improves Delivery Predictability
When aging tasks are identified quickly:
Sprint planning becomes more accurate
Release forecasting improves
Bottlenecks are resolved faster
Team performance becomes measurable
The biggest benefit isn’t just visibility - it’s control.
If you need help or want to ask questions, please contact SaaSJet Support or email us at support@saasjet.atlassian.net
Haven't used this add-on yet? Try it now >>>Time in State for Azure DevOps