Average Time Report
The Average Time Report provides insights into the duration that Work Items remain in a particular state over a defined period.
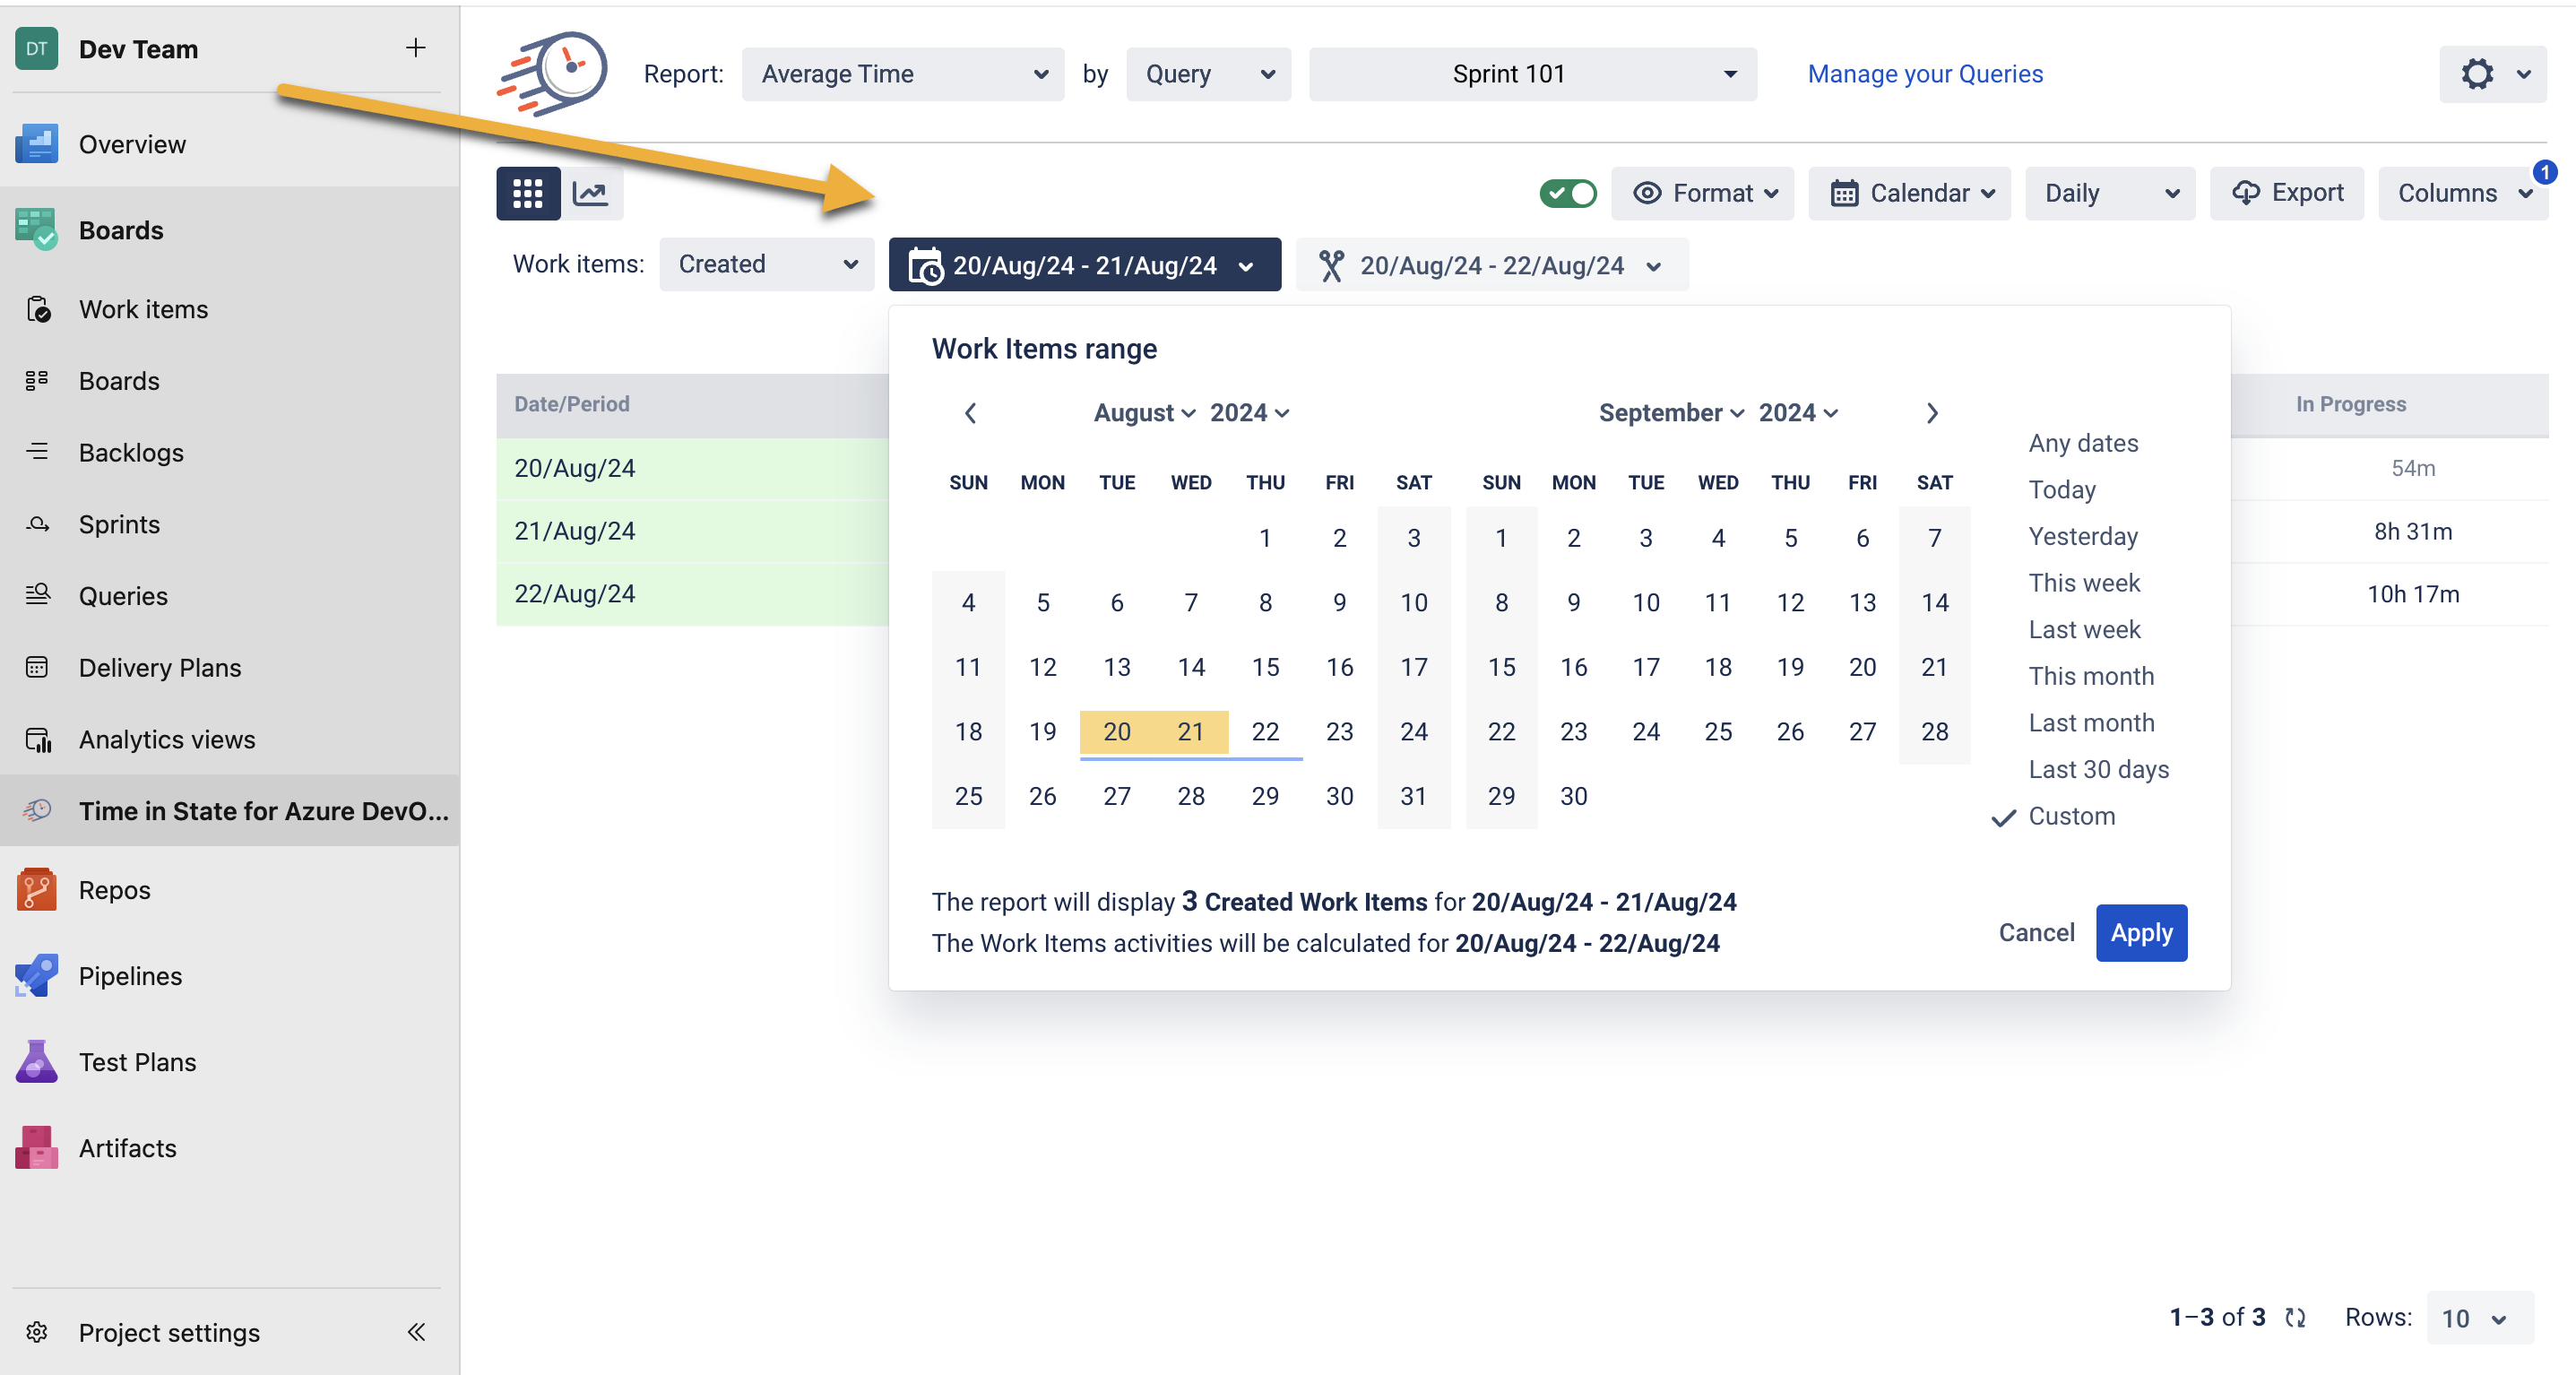
Choose the Average time report;

Filter by the Query you need.

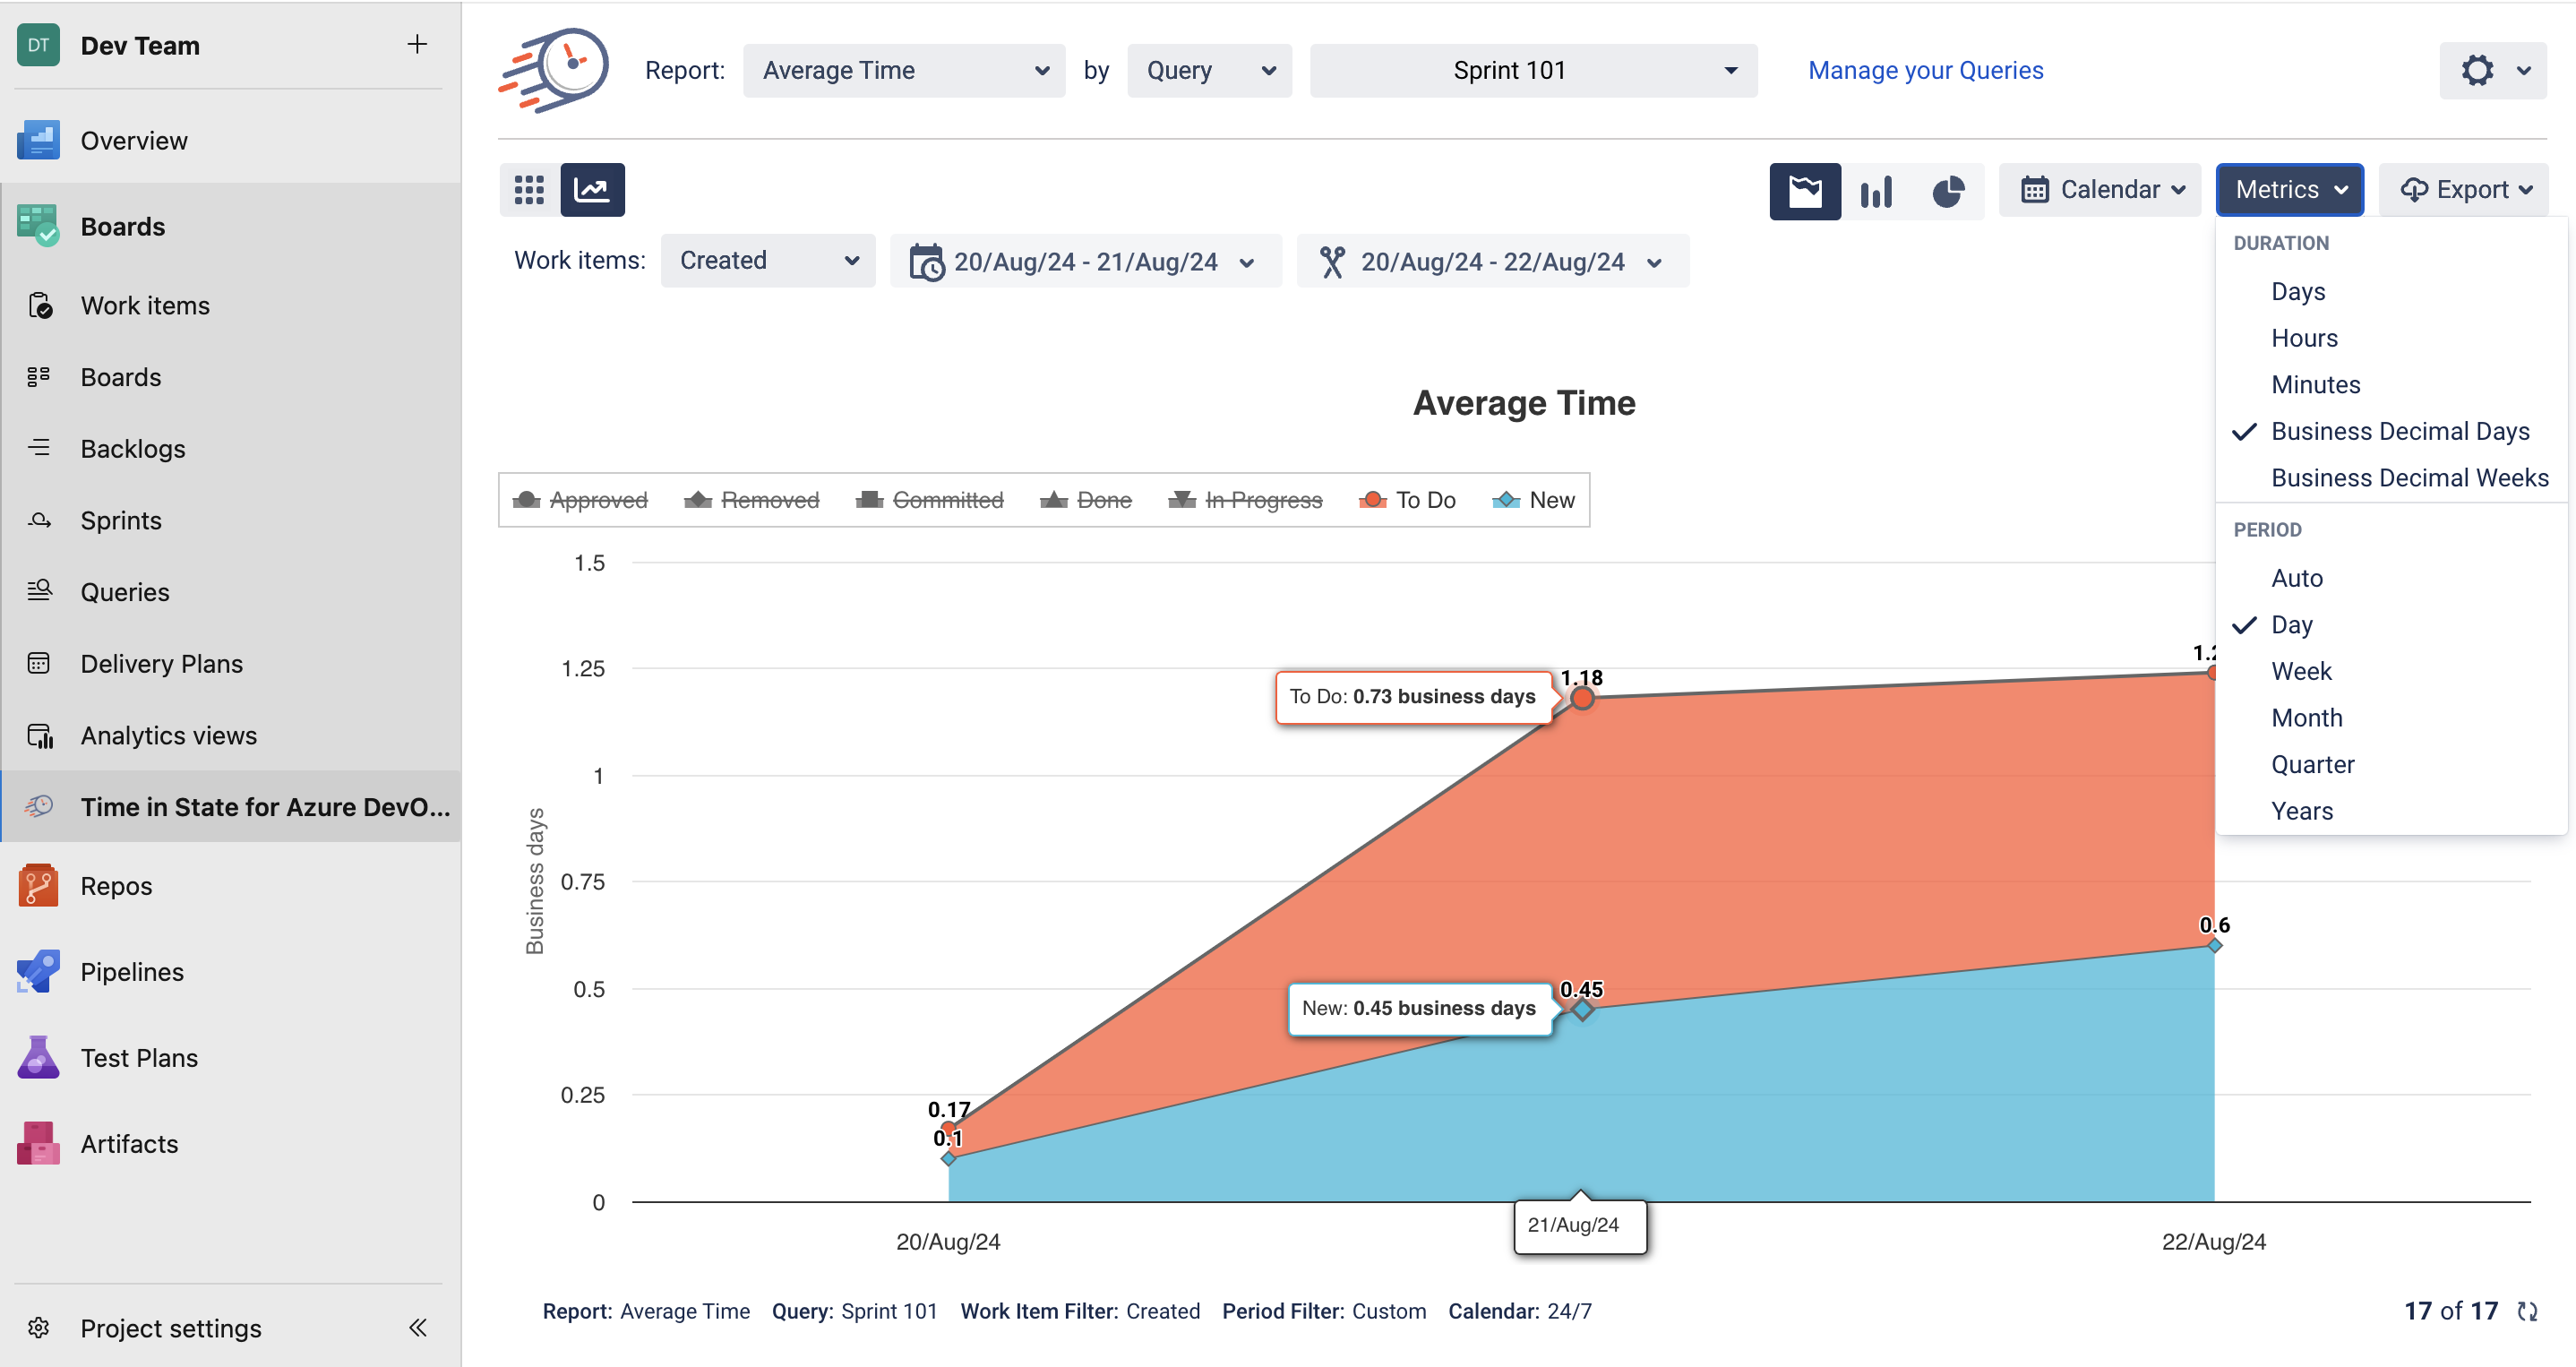
You have the option to choose the time granularity: hourly, daily, weekly, monthly, or quarterly.

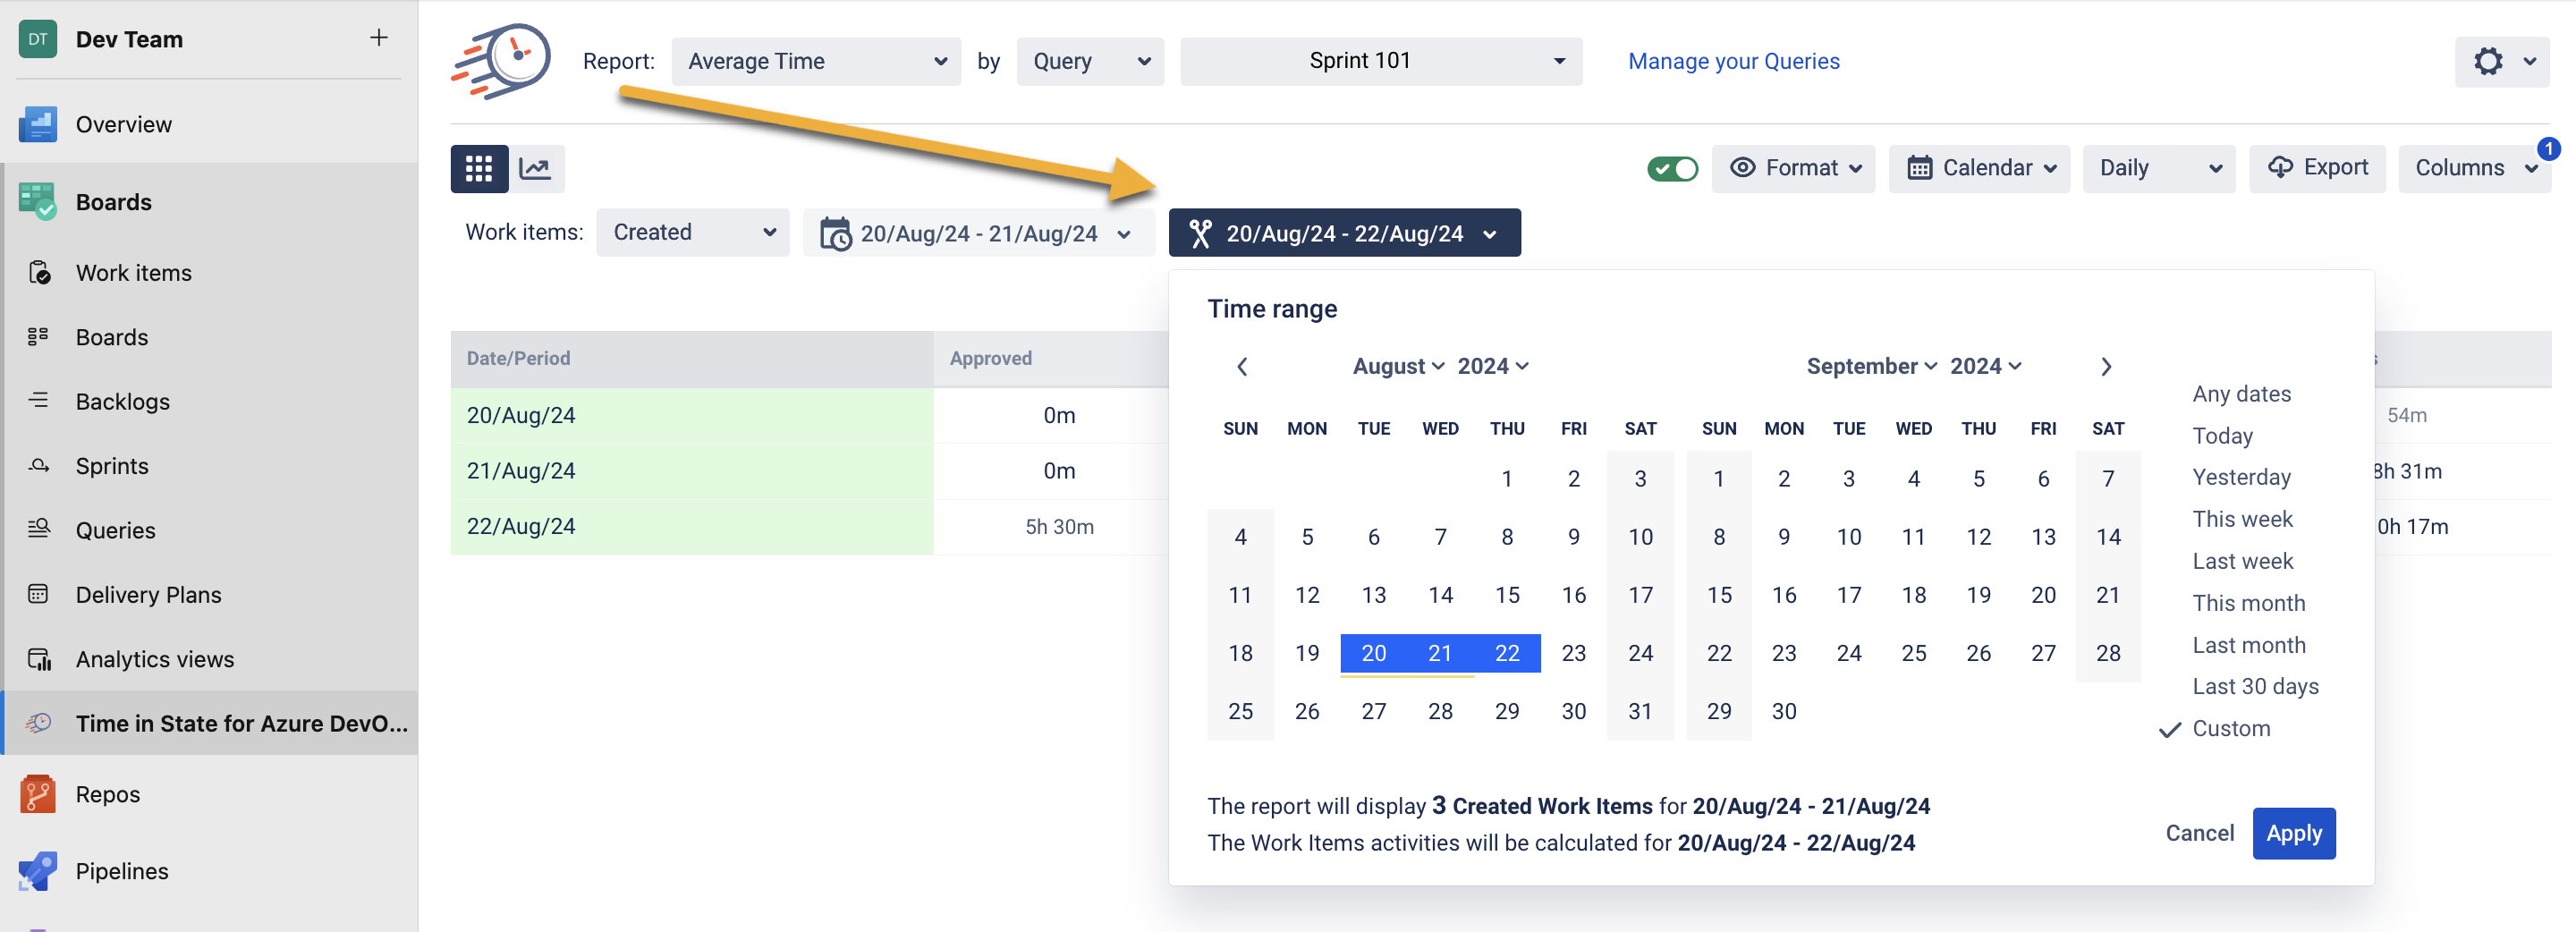
Choose the Work Items range;

Choose the Time ranges;

Choose a Format type that will be represented on the grid.

On the Charts, you can view the average duration that items have remained in specific states over a designated period. For instance, on August 21st, tasks were in the To-Do state for 0.73 business decimal days and in the New state for 0.45 business decimal days. This results in a cumulative total of 1.18 business decimal days for the states on August 21st.

How does the calculation of the Average time occur?

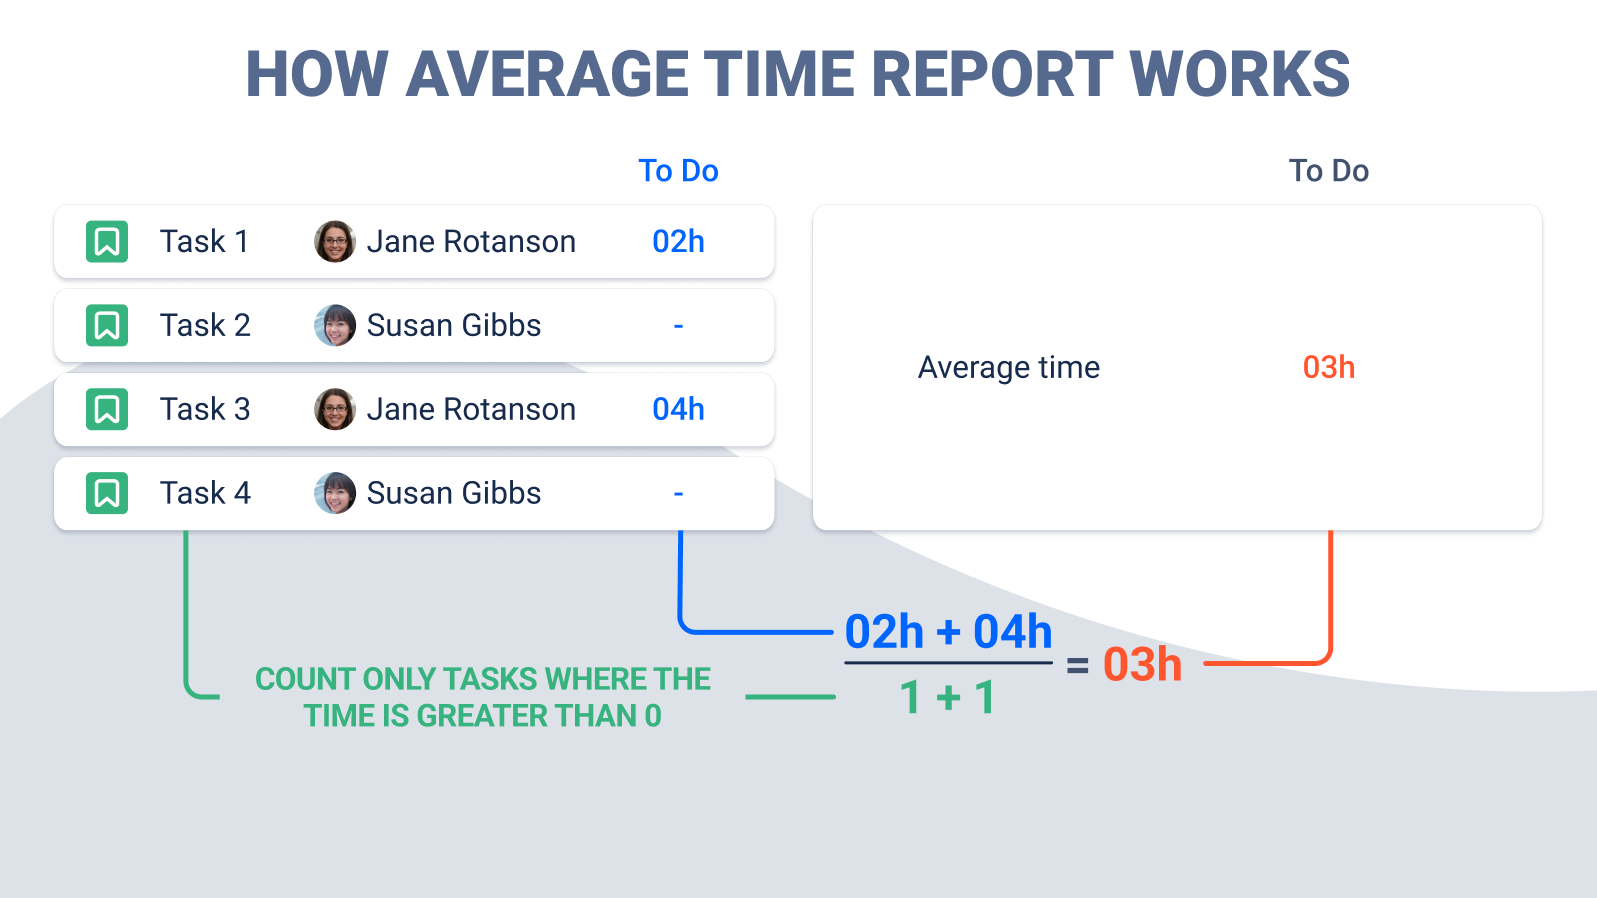
The picture shows the logic of calculating the Average time.
We count the number of tasks that have been in a particular status (To-Do status in this case) (green line),
Then, sum up the time spent on these tasks (blue line). We take into account only those tasks that have been in the status.
Divide the total time by the number of tasks. (1/2)
This is how the calculation of each value on the grid is occurring.
💡 Key Insights of Average Report:
Bottleneck Detection and Process Improvement: Average Report in Azure DevOps allows you to quickly identify where work items are getting delayed in specific states, such as "To-Do" or "In Progress." This insight helps in streamlining processes and reallocating resources to clear bottlenecks, improving overall efficiency.
Performance Evaluation: Average Time Data helps in refining sprint planning, ensuring that high-priority tasks are completed on time, and making informed decisions about resource allocation.
Accurate Forecasting and Stakeholder Reporting: The report provides historical data that project managers can use to predict future timelines more accurately. It also offers clear, visual representations of time spent in each state.
If you need help or want to ask questions, please contact SaaSJet Support or email us at support@saasjet.atlassian.net
Haven't used this add-on yet? Try it now >>>Time in State for Azure DevOps