Average Time for Work Item in Azure DevOps
🤔 Context: A project manager needs to measure the efficiency of their team’s workflow by calculating Key Performance Indicators (KPIs) such as Average Time. These metrics are crucial for assessing the time tasks spend in various states and identifying inefficiencies throughout the project’s lifecycle.
🌧️ User Problem: As a project manager, I need to accurately measure how long, on average, tasks spend in specific states to understand workflow bottlenecks and improve the efficiency of our processes. By having precise insights into these durations, I can make informed decisions to optimize our workflow and meet project goals more effectively.
☔ Solution: Calculate Average Time to gain insights into your project’s efficiency.
What is Average Time?
Average Time is a key metric widely used to assess the effectiveness of workflow processes. It helps track the average duration work items remain in a particular state, providing valuable information for process optimization. Accurately measuring these durations is essential for making data-driven decisions and continuously improving your project management practices.
How to Calculate Average Time in Azure
Identify Relevant States: Determine which states you want to measure. For example, tracking how long tasks stay in “To-Do,” “In Progress,” or “Code Review” can highlight areas where work is delayed.
Generate the Report: Follow these steps to calculate Average Time using the Time in State add-on:
Select the Average Time Report in the add-on interface.

Choose a query that defines the Work Items you want to analyze.

Select Time Granularity: Decide how granular you want your report to be — options include hourly, daily, weekly, monthly, or quarterly timeframes.

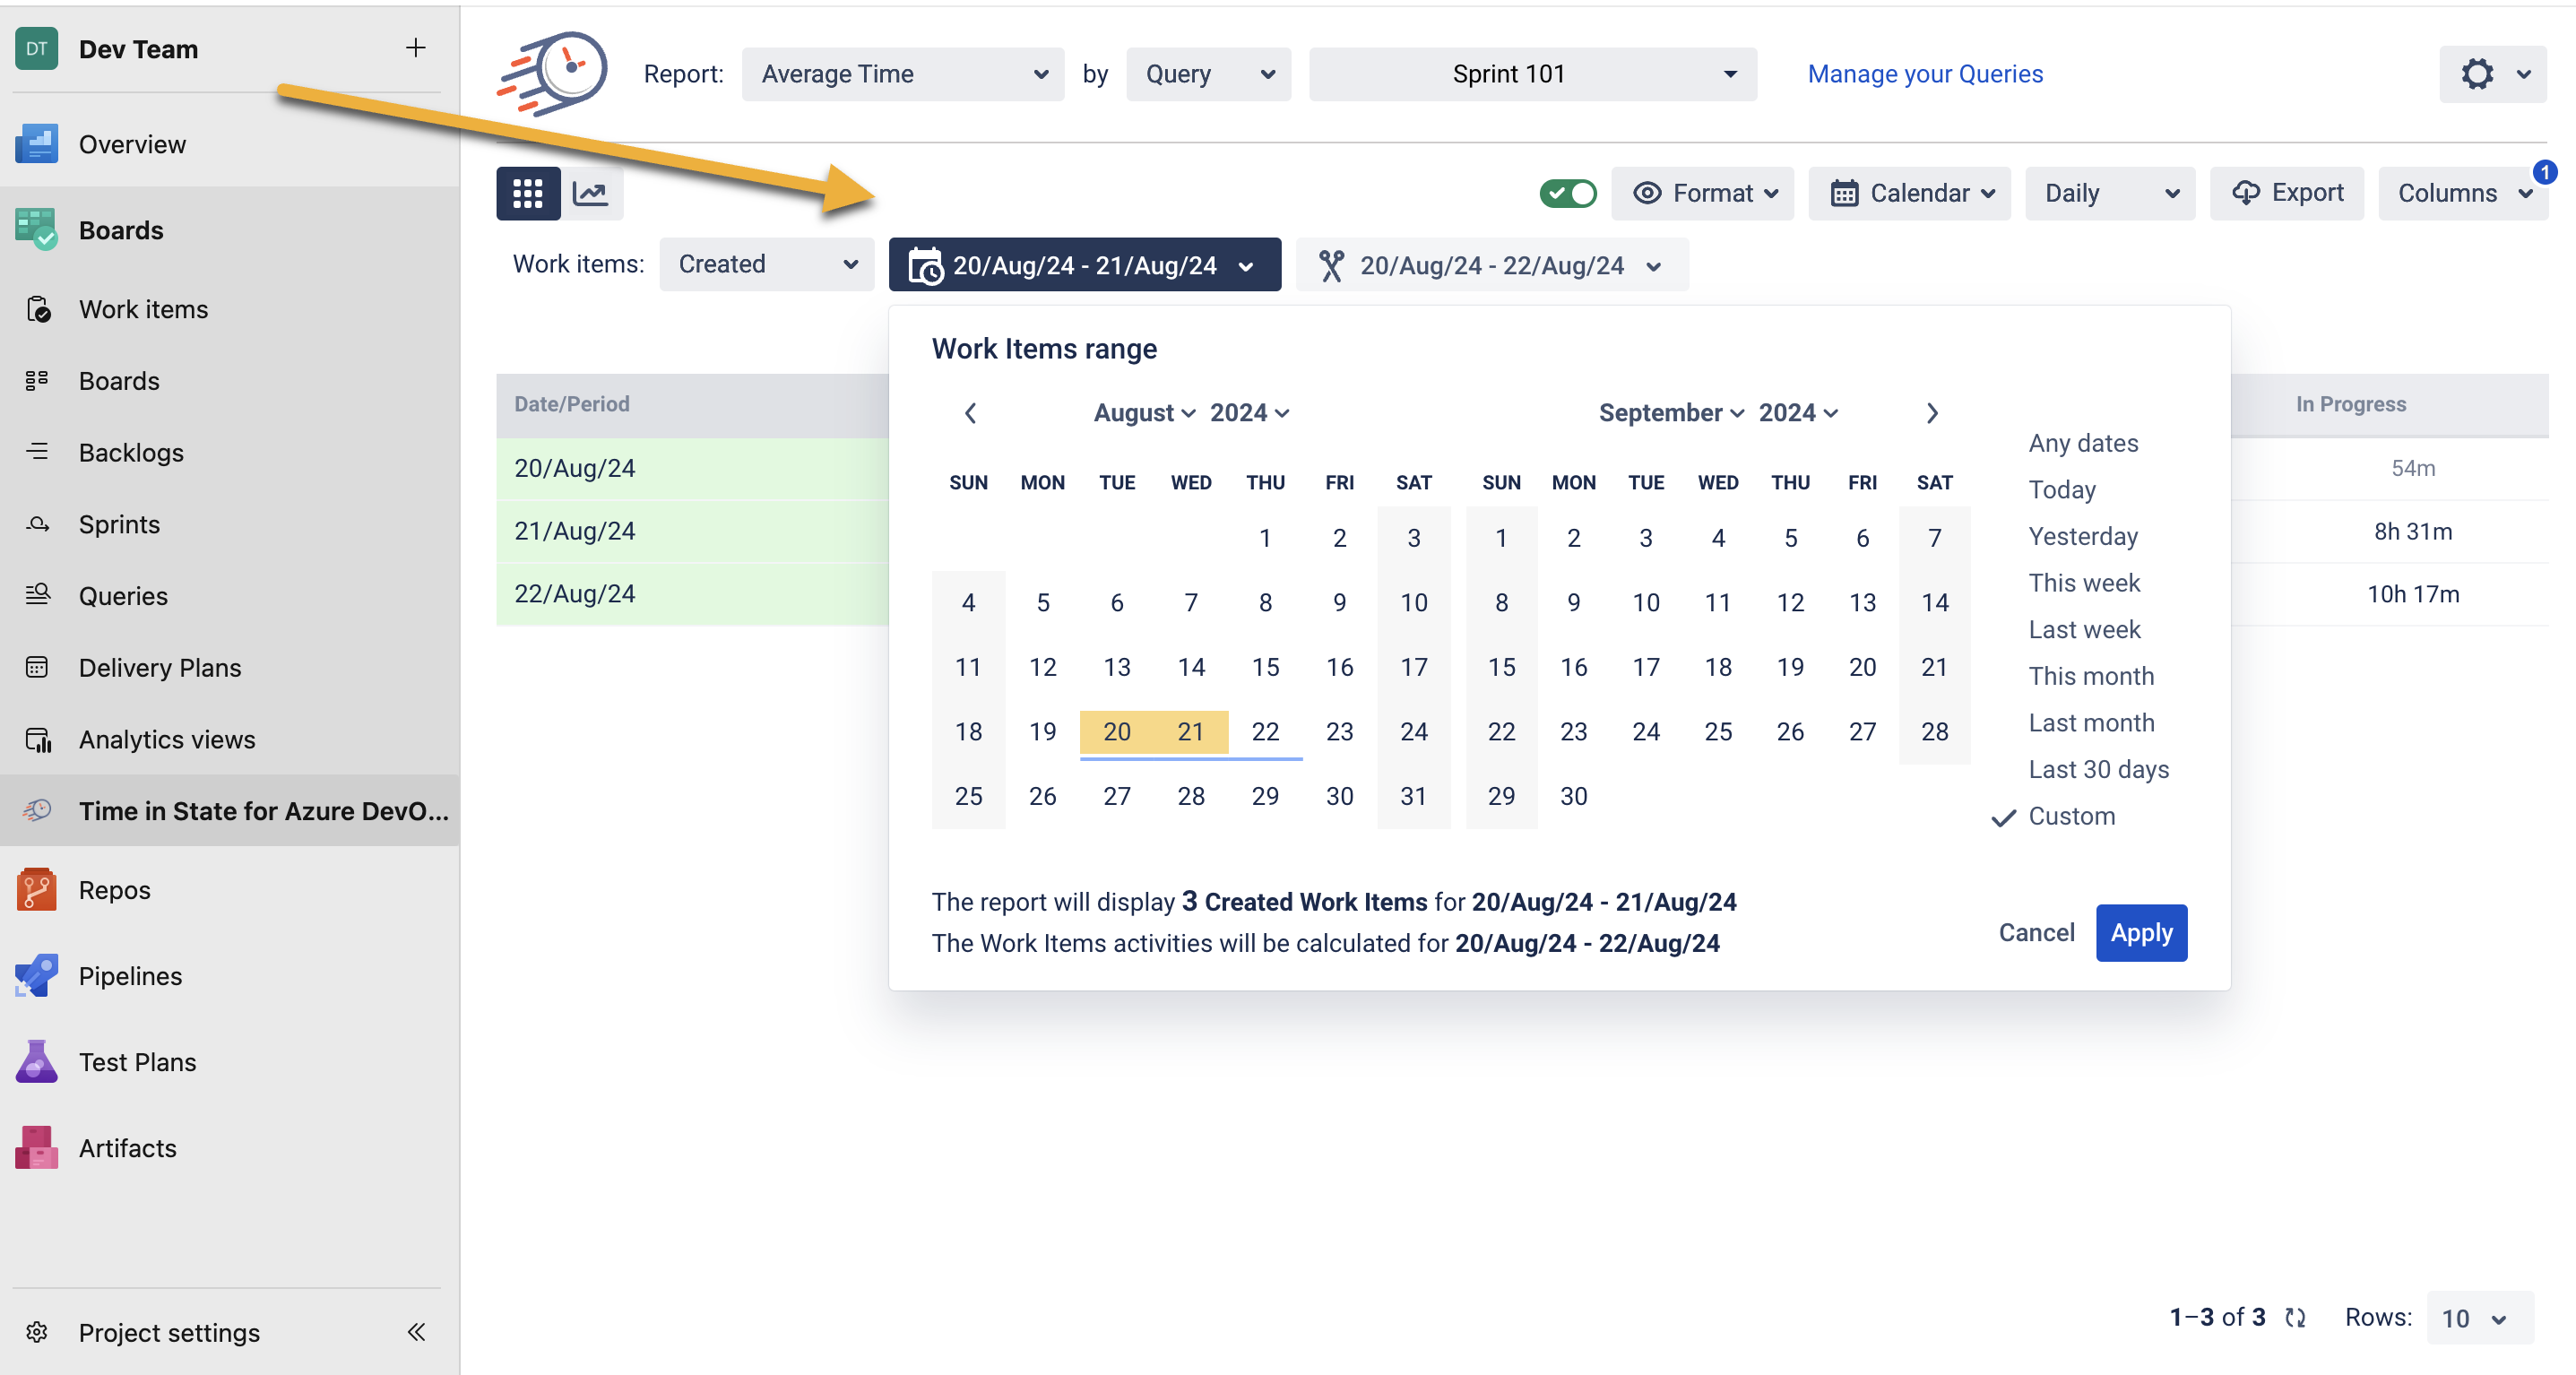
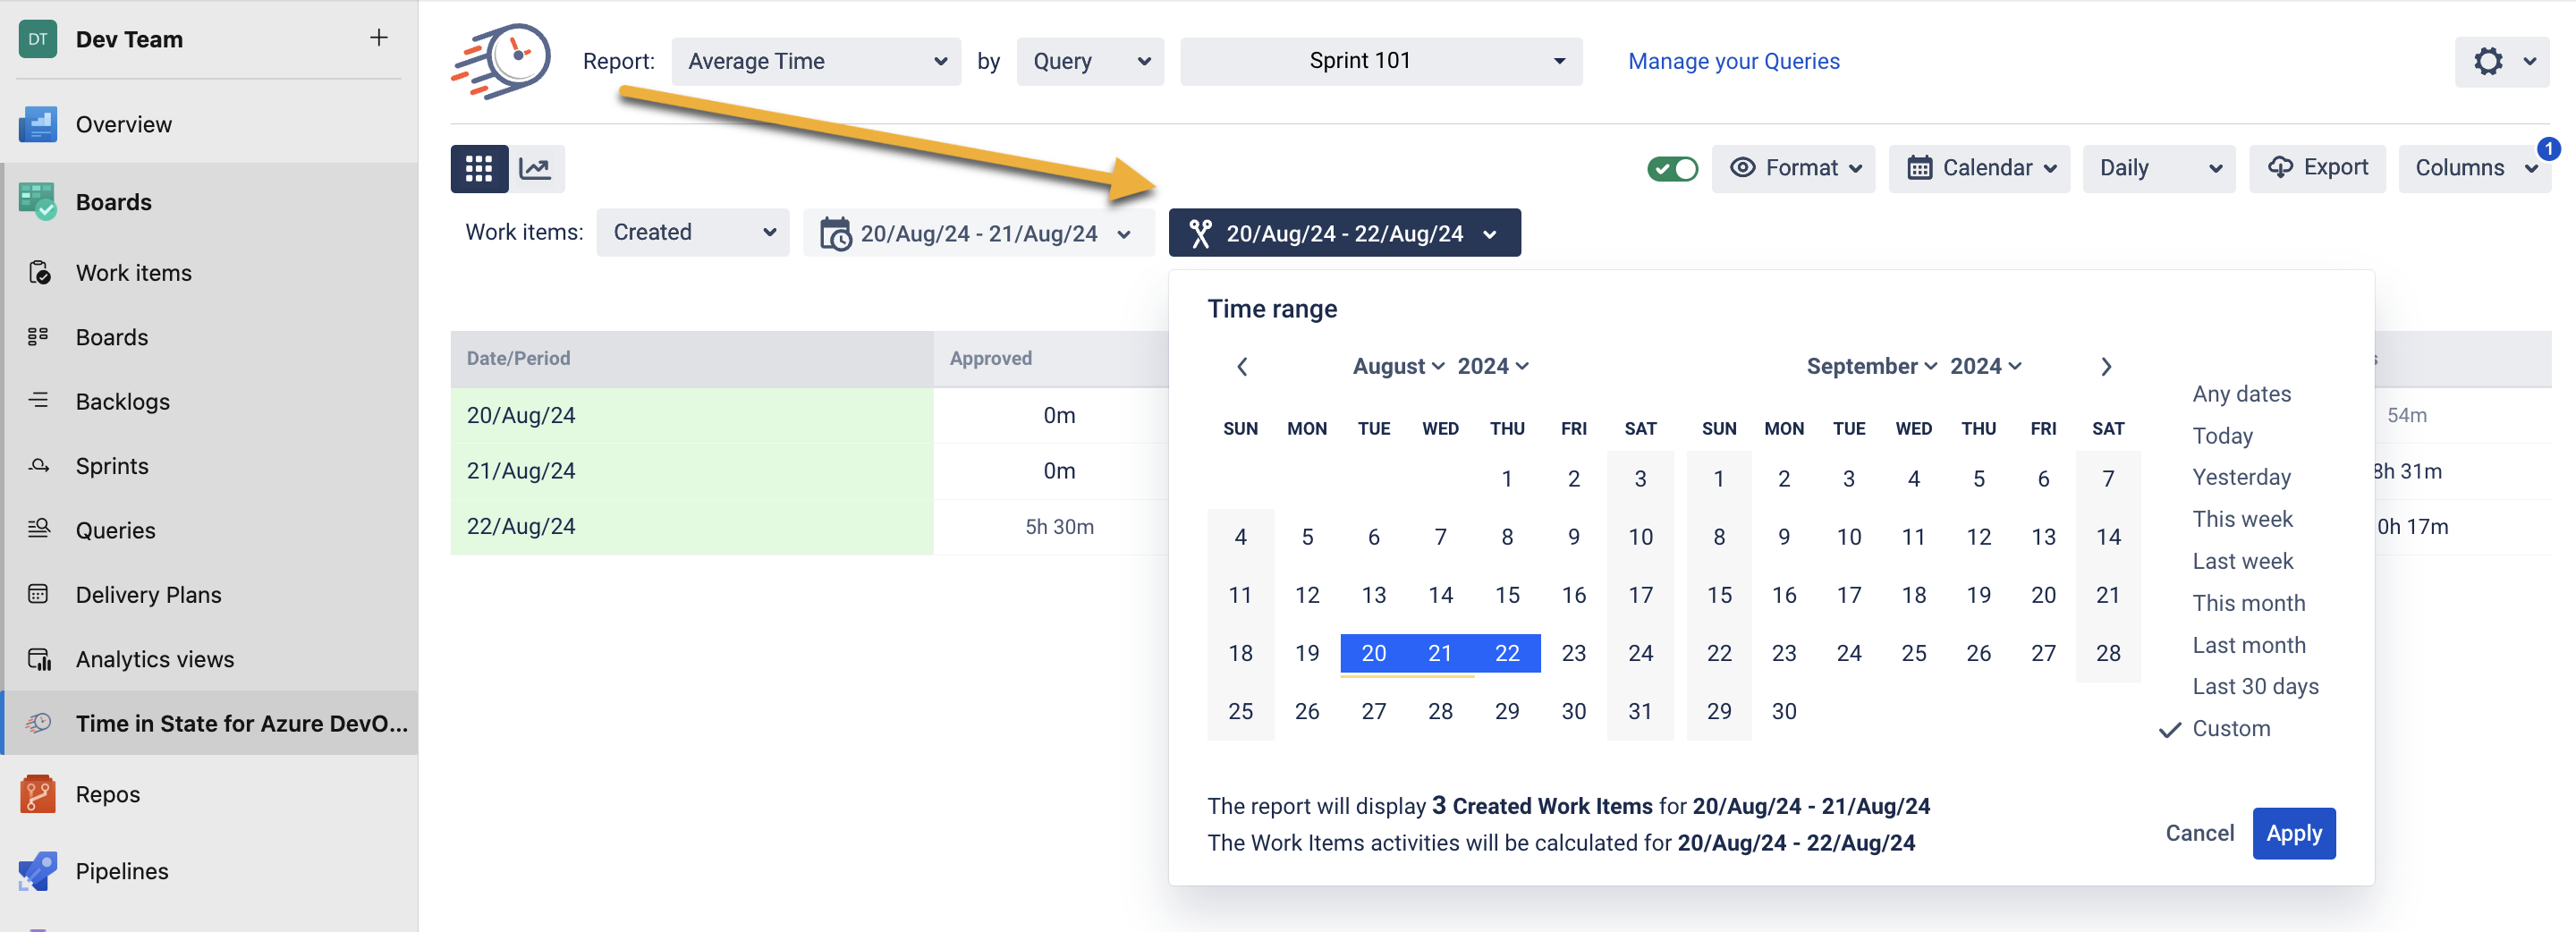
Optionally, select a specific range of Work Items in the “Work Item” dropdown.

Set a time range to display calculations for a specific period.

Analyze the Insights: Use the report to identify stages where work is delayed. For example, if tasks are spending too much time in the “Code Review” state, it may indicate a need for more reviewers or process improvements.
How Average Time Report is Calculated in Azure?
Calculating the average time for tasks can help you understand your workflow better. Here’s a straightforward guide to help you:
Count the Tasks: First, find out how many tasks are in a specific status, like “To-Do.” Knowing these tasks is the first step to managing your workload.
Add the Time Spent: Next, calculate the total time all these tasks have spent in that status. It’s important to recognize the effort and time spent on each task.
Divide Total Time by Number of Tasks: Finally, divide the total time by the number of tasks you counted. This calculation shows the average time each task has spent in that status, giving you helpful insights to improve your workflow.
For example, if two tasks spent 2 and 4 hours in the “To-Do” status respectively, the total time is 6 hours. Divide this by 2 (number of tasks), resulting in an Average Time of 3 hours.
 Key insights from Average Time Report:
Resource Management: The report provides data that aids in resource planning. For instance, if a particular stage consistently takes longer, it may indicate a need for additional team members or a review of the task assignment strategy. This allows for a more strategic allocation of resources based on workload and priorities.
Informed Sprint Planning: You can use Average Time metrics to refine sprint planning. Knowing how long tasks typically take in different states helps set realistic expectations and plan more achievable sprints, avoiding overloading or underutilizing team members.
Performance Tracking: The Average Time Report clearly shows team performance over time. It enables you to monitor improvements or identify trends in task duration, providing a basis for performance reviews and continuous improvement efforts.
Enhanced Forecasting: With historical data on how long tasks stay in specific states, you can make more accurate predictions for future timelines. This ensures that stakeholders receive realistic updates, improving communication and trust.
If you need help or want to ask questions, please contact SaaSJet Support or email us at support@saasjet.atlassian.net
Haven't used this add-on yet? Try it now >>>Time in State for Azure DevOps
